


Stocks Soar on Ceasefire Hopes: Nasdaq, S&P 500 into Next Week
While some degree of skepticism remains around the ceasefire announcement into the weekend equity markets seem far more certain, as stocks have rallied in a big way despite oil prices staying elevated.
Written by
James Stanley
Sr. Strategist
I talked about this earlier in the week and as US equity prices began to snap back in the month of March I was retaining a bullish view with eyes on longer-term trends, looking at the prospect of buying some of the equity leaders of the most recent rally at a relative discount. Similar to last year’s scenario, when Liberation Day tariffs brought a sizable pullback to markets, I think the overriding driver of President Trump’s actions will ultimately push ahead in a way that’s friendly for stocks. And at this point, pullbacks present opportunity as the potent combination of a friendly and relatively dovish Fed combined with a President willing, able and wanting to pump markets can work out favorably to the long side of stocks.
This was an impactful force during much of his first administration, and it’s, so far, been an impact through his second administration.
And I think more to the point – ever since the Fed figured out that they could accumulate balance sheet – thereby keeping US treasury rates low and making bond investments as somewhat unattractive - there’s been a motive to push for higher levels of risk than what may have been considered normal even twenty years ago.
What’s the point of asset allocation if 30-year Treasuries are at a paltry 4.5%? If rates do rise, well any Treasury investments locked in at low rates stand to suffer from lower prices. And combine that with the Fed’s embrace of the wealth effect and we get multiple episodes, such as last year or the year before, when the bank is cutting interest rates even with core inflation more than 50% above their own self-imposed target.
Unfortunately, I wasn’t the only one with the idea of using the March pullback as opportunistic, and the NVDA chart illustrates that well. There’s been a mere 23.6% pullback in the broader bullish move that’s spanned as much as 1,862% from the 2022 lows.
And the stock is up more than 15% in less than two weeks.
NVDA Weekly Chart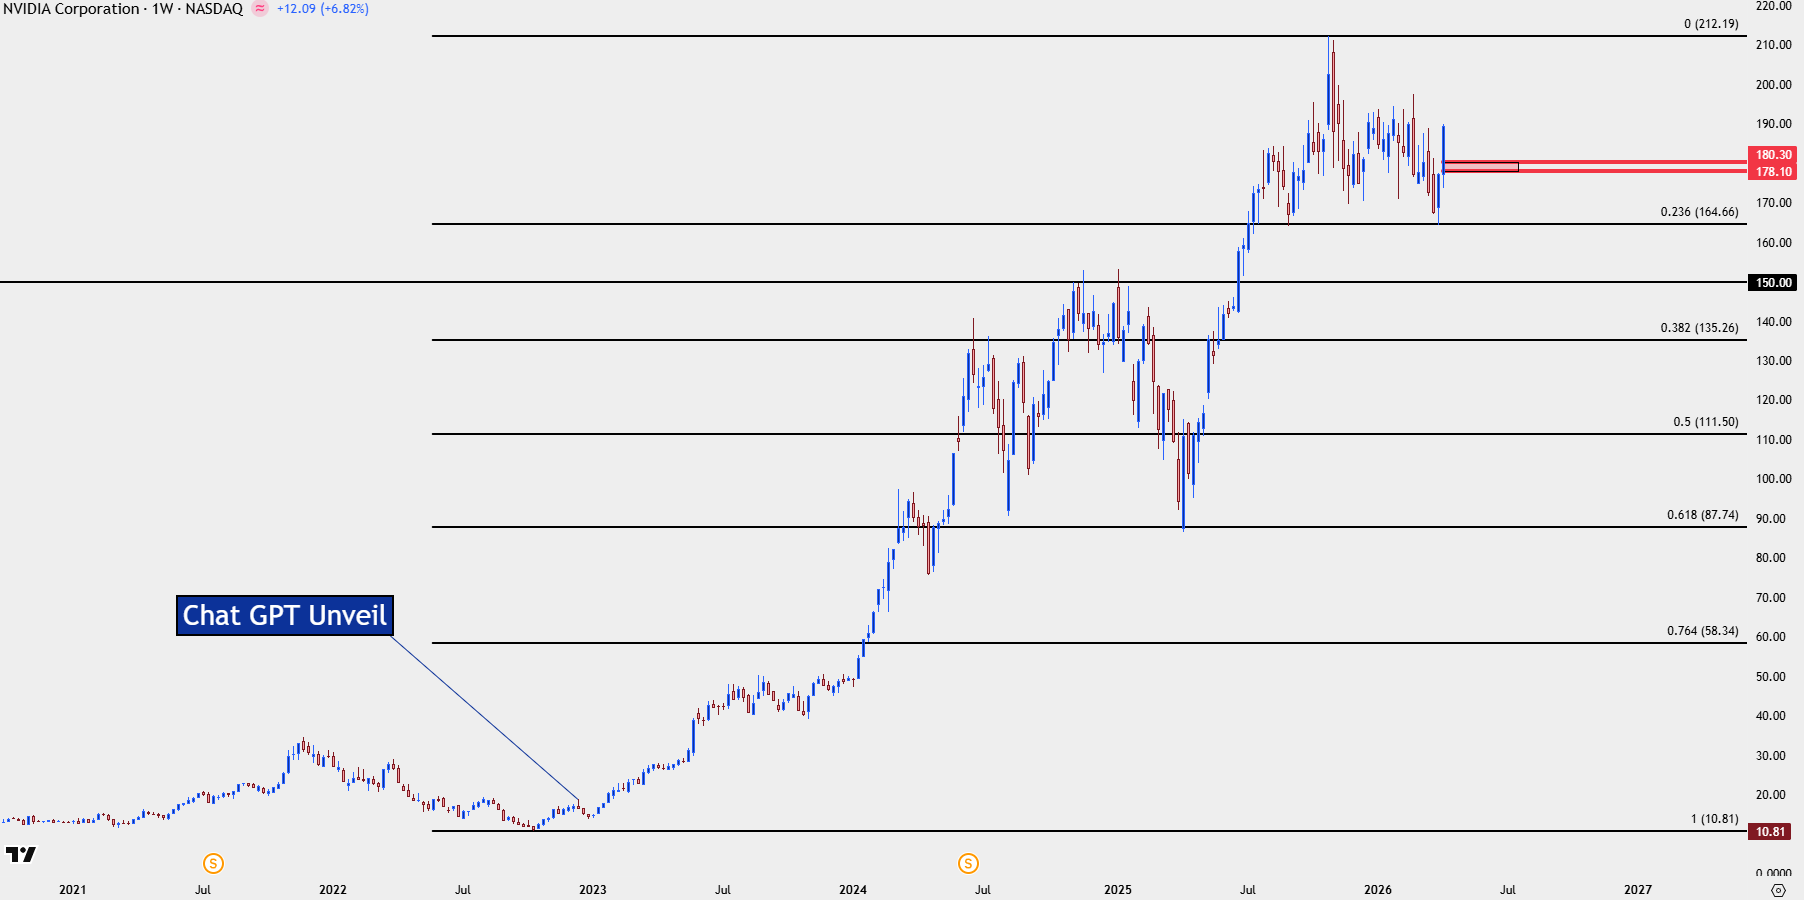
Chart prepared by James Stanley; data derived from Tradingview
Nasdaq 100
This is highly relevant for the Nasdaq, as well, as the tech-fueled rally of the past few years saw massive appreciation in large cap tech stocks like NVDA or META. As the equity sell-off started taking over last month the Nasdaq even held up a bit better.
And even in the prior week, when tensions were still high around Iran, Nasdaq 100 futures built a bullish engulfing candlestick on the weekly and that continued in a very big way last week as the index gained nearly 5%.
For next week – if we do see a firming of tensions then a short-term pullback sets up for the possibility of higher-low, and I’m considering the Nasdaq as the more attractive venue to seek out that bullish continuation scenario amongst US equity indices.
There’s support for next week at 25k and then the zone from 24,578-24,721; and if neither of those can hold, I’d even be willing to look at the zone around 24,100 which was a big spot of prior resistance-turned-support.
Nasdaq 100 Futures – Daily Chart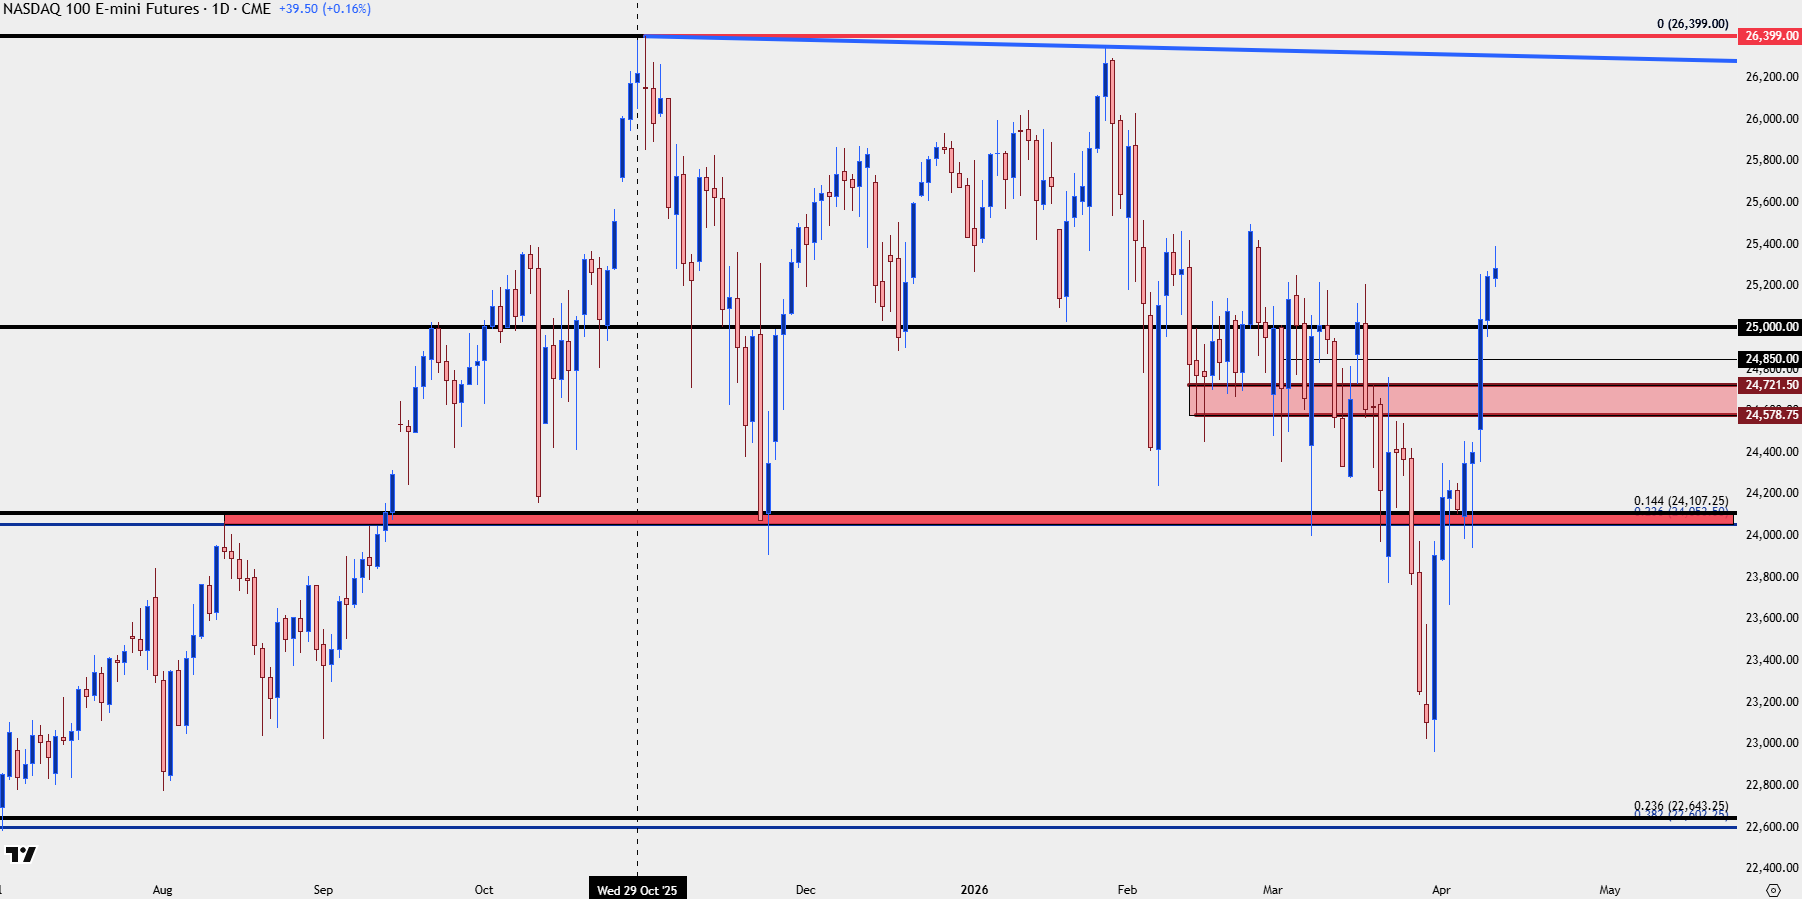
Chart prepared by James Stanley; data derived from Tradingview
SPX – 7k
The cash S&P 500 index has already recovered a bulk of the March losses but the question I have is whether the index can finally push through the 7k level that proved too difficult to break in January. The challenge here is just how short-term overbought the index is, which speaks to my point at the intro of this article where investors were using this pullback to position in at more favorable prices.
Similarly, I think pullbacks here are of interest for bullish continuation, and it’s the 6500-6550 zone that stands out, in my opinion. There remains a large swath of unfilled gap from the Wednesday move, following the ceasefire announcement and that entire area sets up for a possible higher-low as well.
Notably, the 61.8% retracement of the pullback move plots at 6740 and that’s what I’m looking to as the ‘s1’ support level for the cash index into next week, as the 76.4% retracement is what’s helping to hold the current high. Below that, the 50% marker of the sell-off plots in the middle of the gap, around 6,660 with the bottom of the gap around 6620.
SPX Daily Price Chart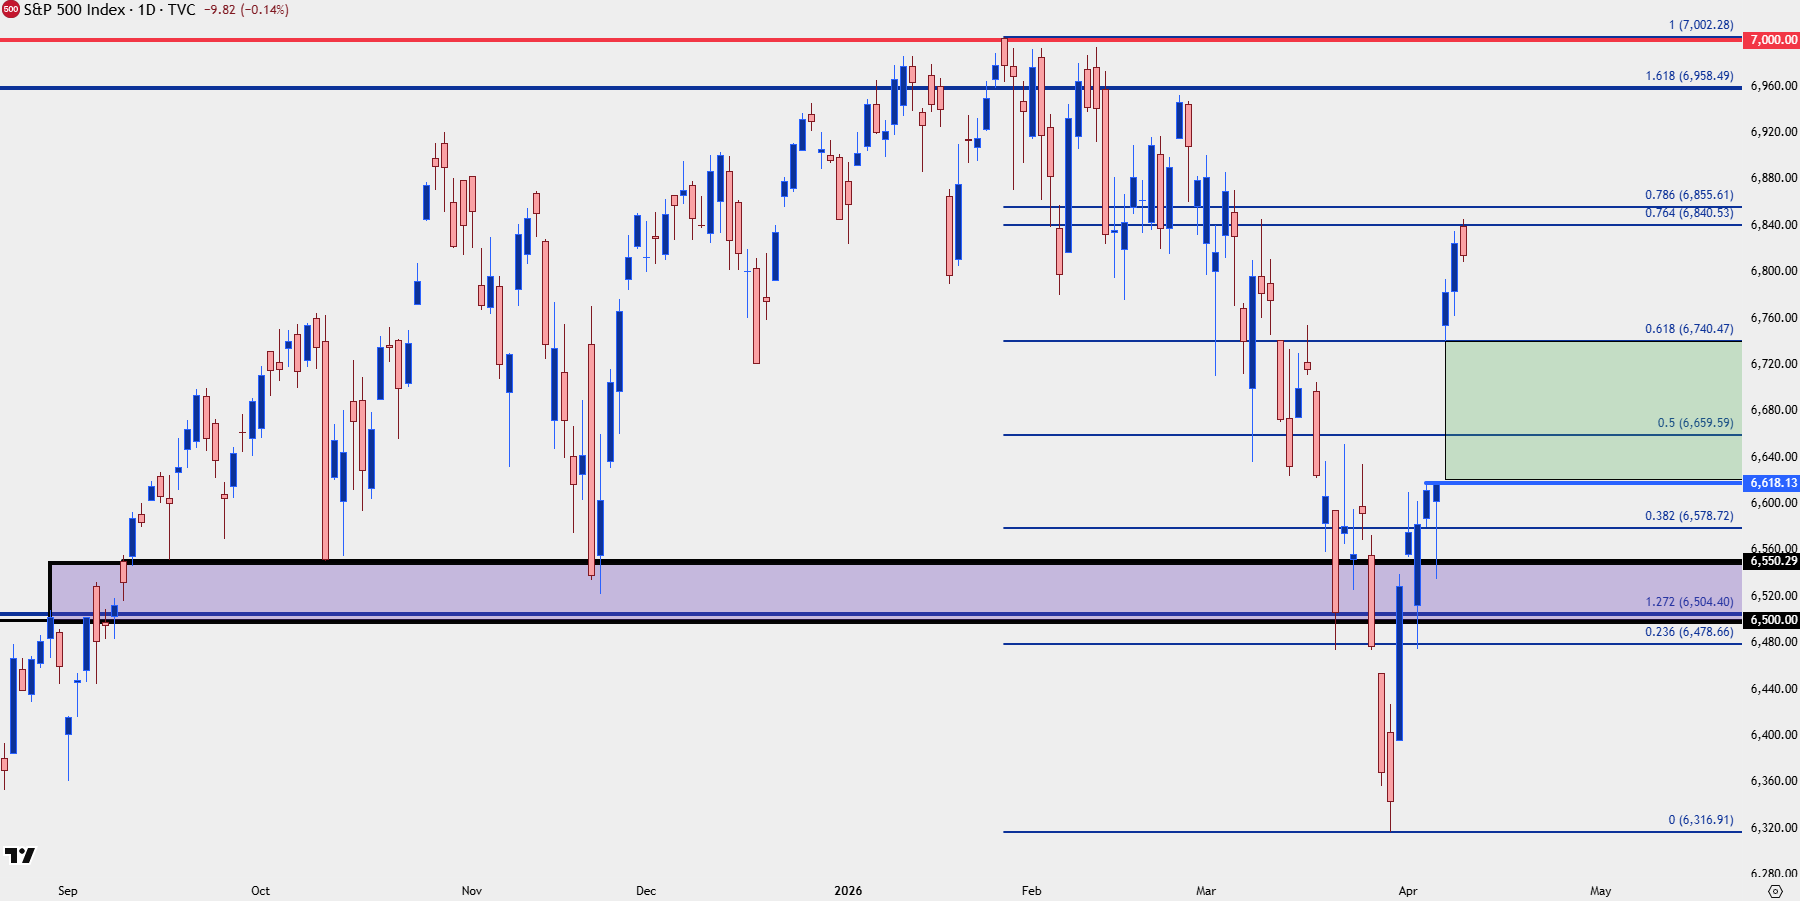
Chart prepared by James Stanley; data derived from Tradingview
--- written by James Stanley, Senior Market Analyst, Global Macro
Related tags:
Latest market news











Web Trader platform
Our sophisticated web-based platform is packed with features.
Open an account today
Experience award-winning platforms with fast and secure execution.
Economic calendar
Related articles

Gold and S&P 500 analysis: What now after Warsh’s hawkish speech?
The dollar surged across the board after the Fed Chair Kevin Warsh surprised with a hawkish-leaning speech at the Jackson Hole summit. All the bearish dollar bets that had been accumulated since last Friday on the back of data weakness and bond market troubles had to be squared and that triggered a short squeeze rally for the dollar. Gold and silver dropped, as a result, as too did bitcoin, while US indices were giving back earlier gains.


Nasdaq 100 Forecast: NDX slips ahead of Fed Chair Warsh’s speech
U.S. stocks are edging lower on Friday, giving back some of yesterday's gains after Nvidia's strong outlook revived the tech trade. The focus has now shifted firmly to Fed Chair Kevin Warsh's Jackson Hole speech, with investors looking for more clarity on the outlook for interest rates.


S&P 500 Forecast: SPX after Nvidia revives confidence in the AI trade
U.S. stocks are heading higher on Thursday, with technology leading the move after Nvidia's stronger-than-expected outlook revived confidence in the AI trade.