

US Dollar Price Action Setups: USD/JPY, GBP/USD, EUR/USD, Gold, BTC
Weakness can be opportunity, particularly when a counter-trend move shows in a broader theme that remains in-place. Markets are still pricing in rate hikes for later this year and the below-expected CPI print earlier this morning produced a pullback in the US Dollar.
Written by
James Stanley
Sr. Strategist
US Dollar Price Action Setups:
- As discussed yesterday the bullish trend in both the USD and USD/JPY was in a difficult spot to chase.
- The below-expected CPI print out of the US has produced pullbacks in both markets, and the reaction from bulls here can be telling for broader trend resumption.
- For USD-weakness, GBP/USD looks more attractive, as discussed in the below video, and both Gold and Bitcoin are of interest for bigger picture themes to go along with USD scenarios.
US Dollar
The trend is fairly clear from both weekly and monthly charts as the bullish breakout in the Dollar has, so far, held higher-low support. At the time of the above webinar there was a support test going down at an important spot, and I went over this from a few different perspectives as to how and why it mattered. At this point, buyers are making a move, and from the daily chart, we can see yet another underside wick at support from prior resistance, keeping the door open for a push towards the highs.
US Dollar Daily Chart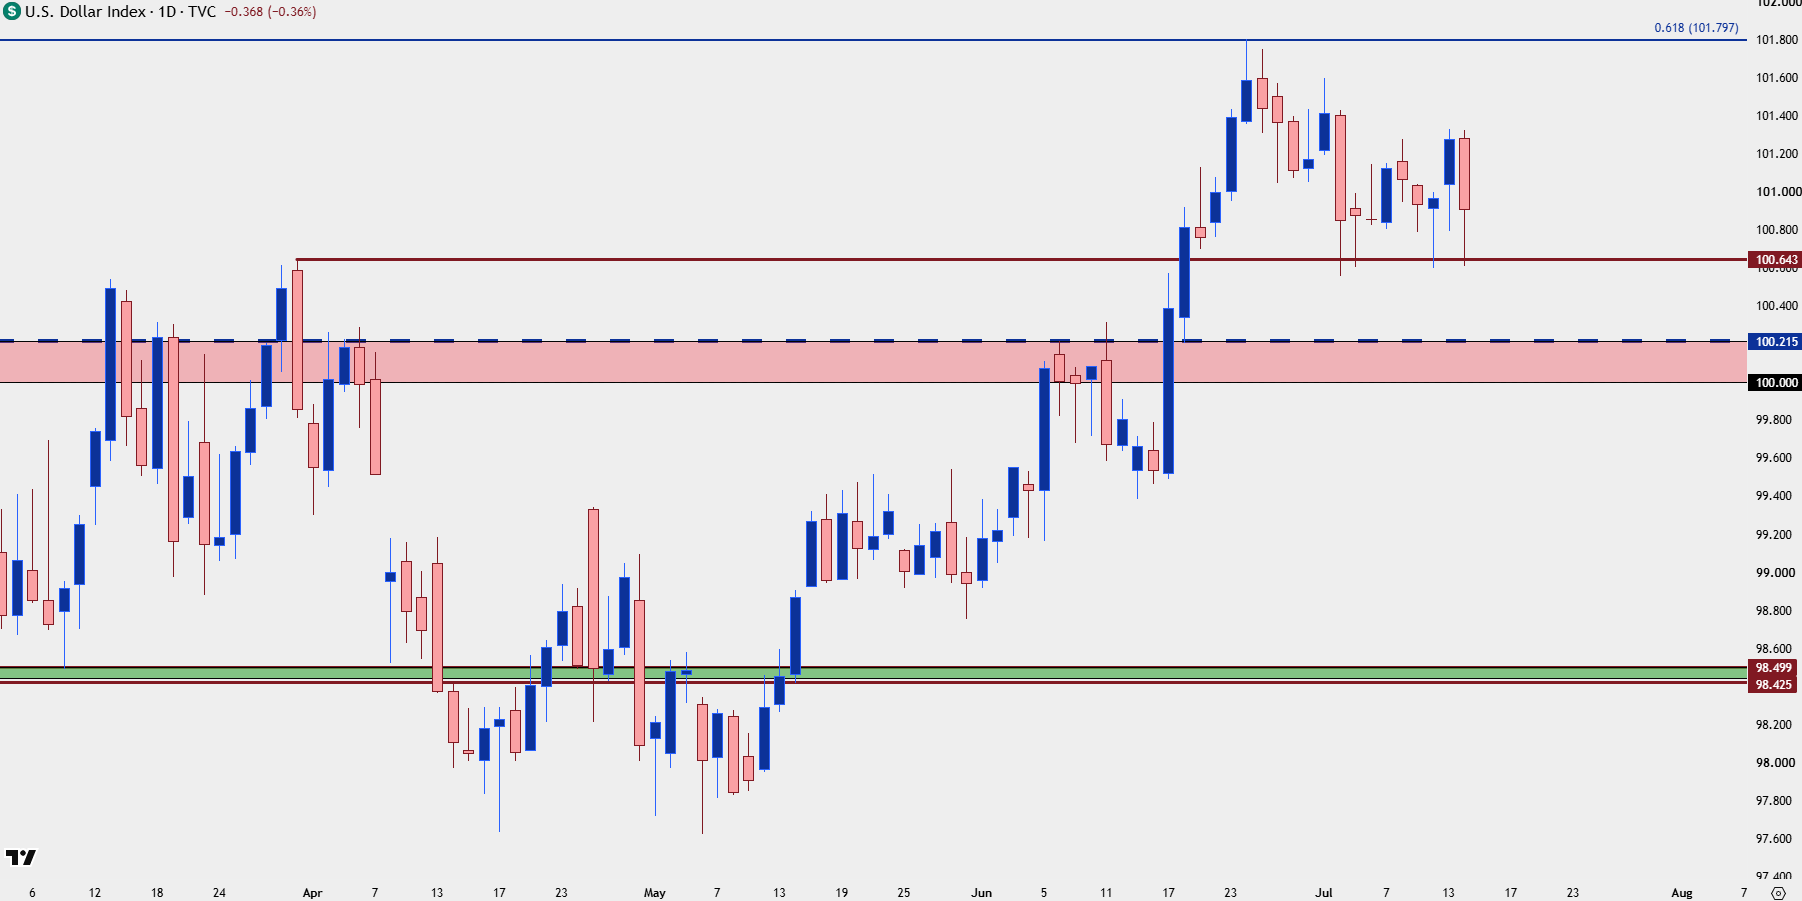
Chart prepared by James Stanley; data derived from Tradingview
USD/JPY
I looked at this theme in yesterday’s USD/JPY article and as was the case a few months ago, USD/JPY remains my favored bullish USD setup. The 165 handle has some historical importance and 163 is the big spot of resistance for now, but like the USD above, the below-expected CPI print produced an opportunity for bulls that, so far, have responded well to the 161.95 level.
The door remains open for a run at highs and possibly even a breakout.
USD/JPY Daily Chart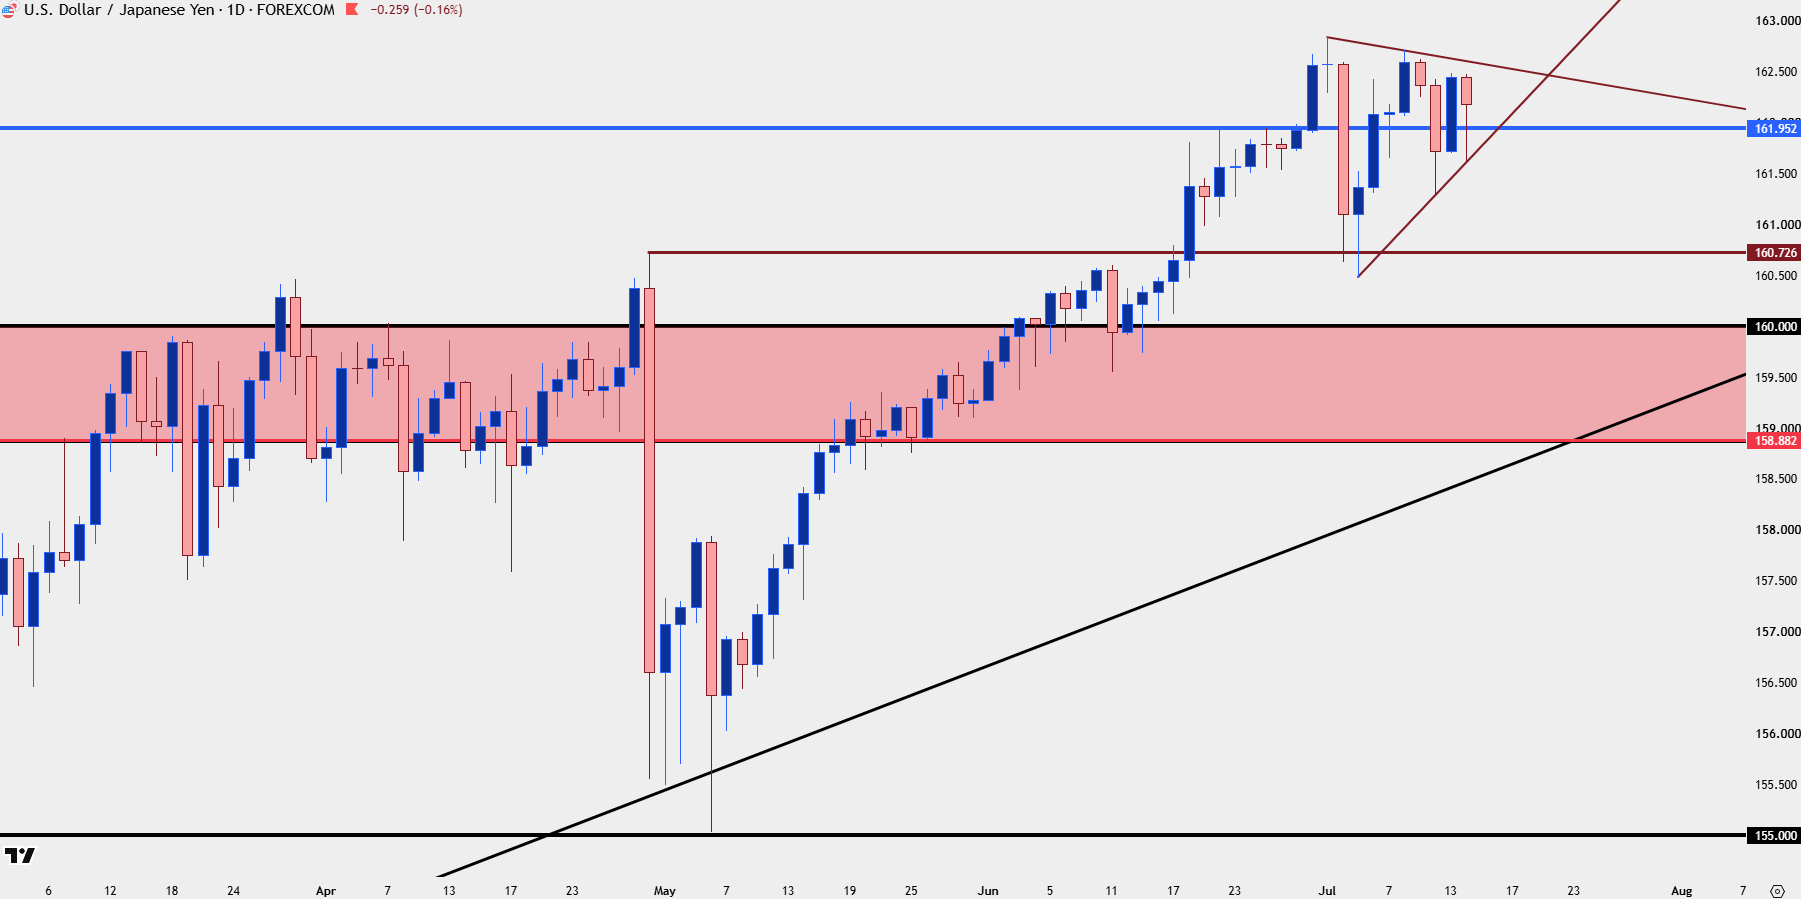
Chart prepared by James Stanley; data derived from Tradingview
GBP/USD
For USD-weakness scenarios, I still like Cable, which has held up fairly well over the past few weeks, all factors considered. It also comps nicely against EUR/USD which has broken down to a fresh lower-low.
With that said, if USD-strength remains aggressive even a brighter backdrop in GBP/USD may not be able to overcome a stronger slide, and price is already testing the ‘s1’ support level looked at in the webinar, with s2 and s3 just below.
GBP/USD Four-Hour Price Chart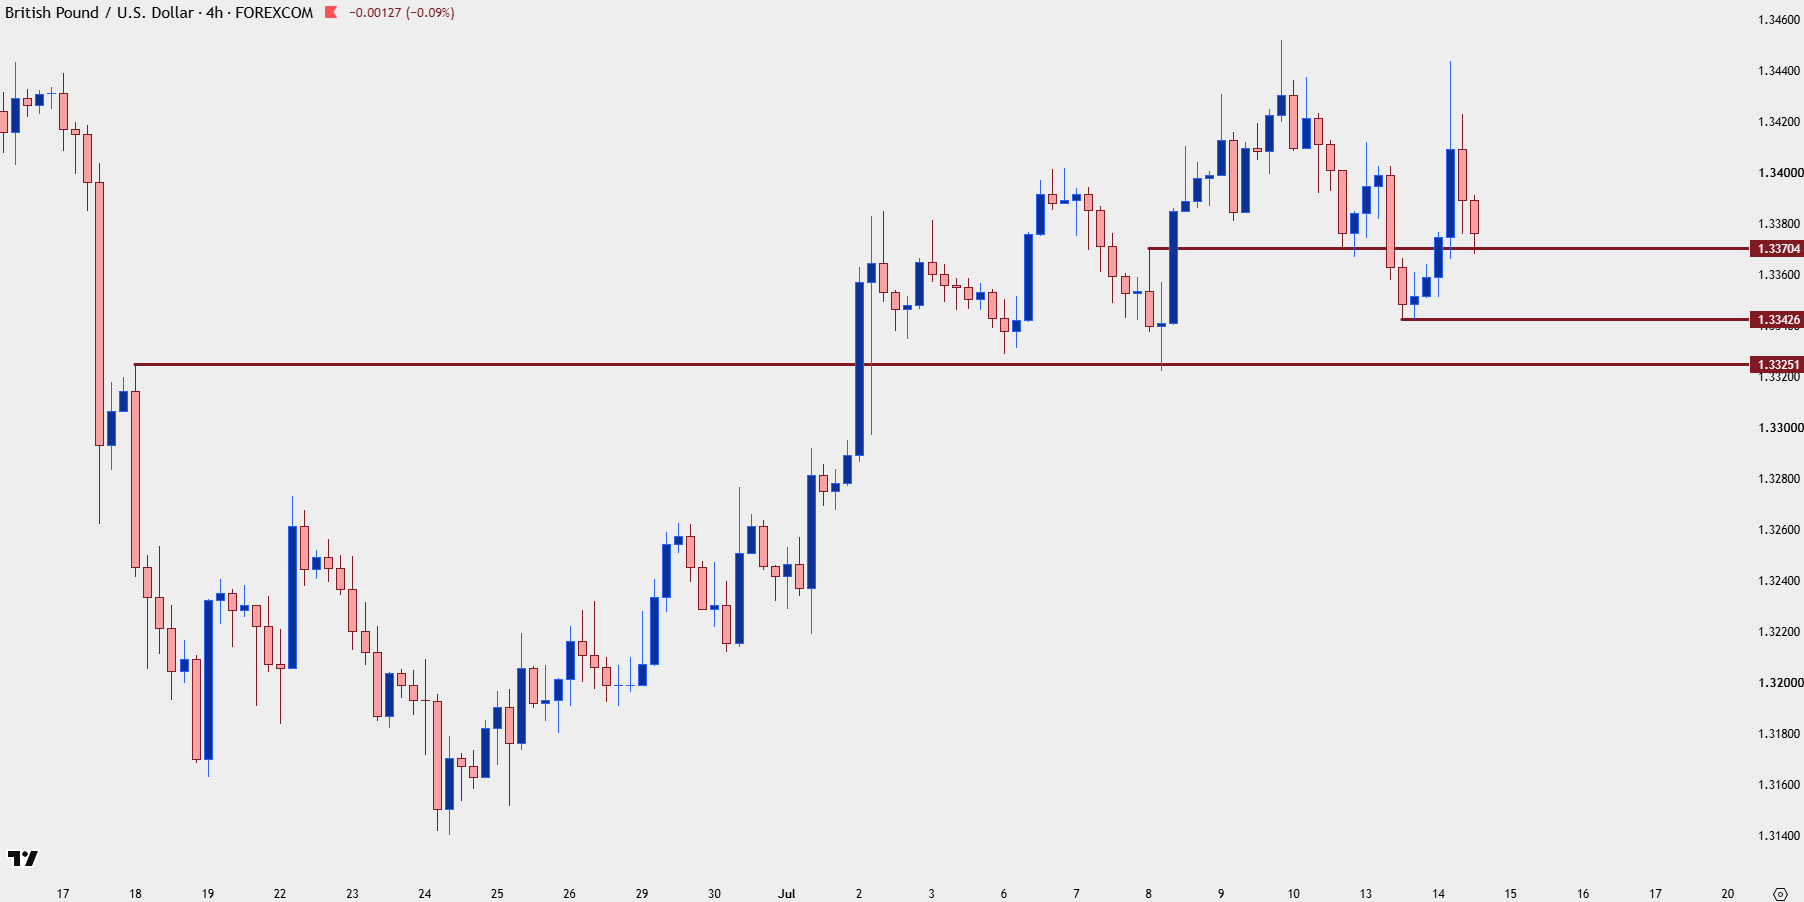
Chart prepared by James Stanley; data derived from Tradingview
EUR/USD
The Euro is an incredibly large part of the DXY basket at 57.6% and echoing the Dollar’s strength above, we have a bearish backdrop in EUR/USD, at he moment. That said, the move has so far been stalled for three weeks after a break to a fresh lower-low, so I’d be cautious of chasing at this point until greater evidence of bearish continuation appears. And for bullish USD backdrops that USD/JPY setup still carries more attraction, in my opinion.
In EUR/USD, there’s already been a few tests of prior support at 1.1469 so I’d want to look for a resistance reaction around 1.1500, at a minimum, before plotting for downside continuation. Above that, I’m tracking a zone from 1.1576 up to 1.1613 and then an ‘r3’ level around 1.1669.
EUR/USD Weekly Price Chart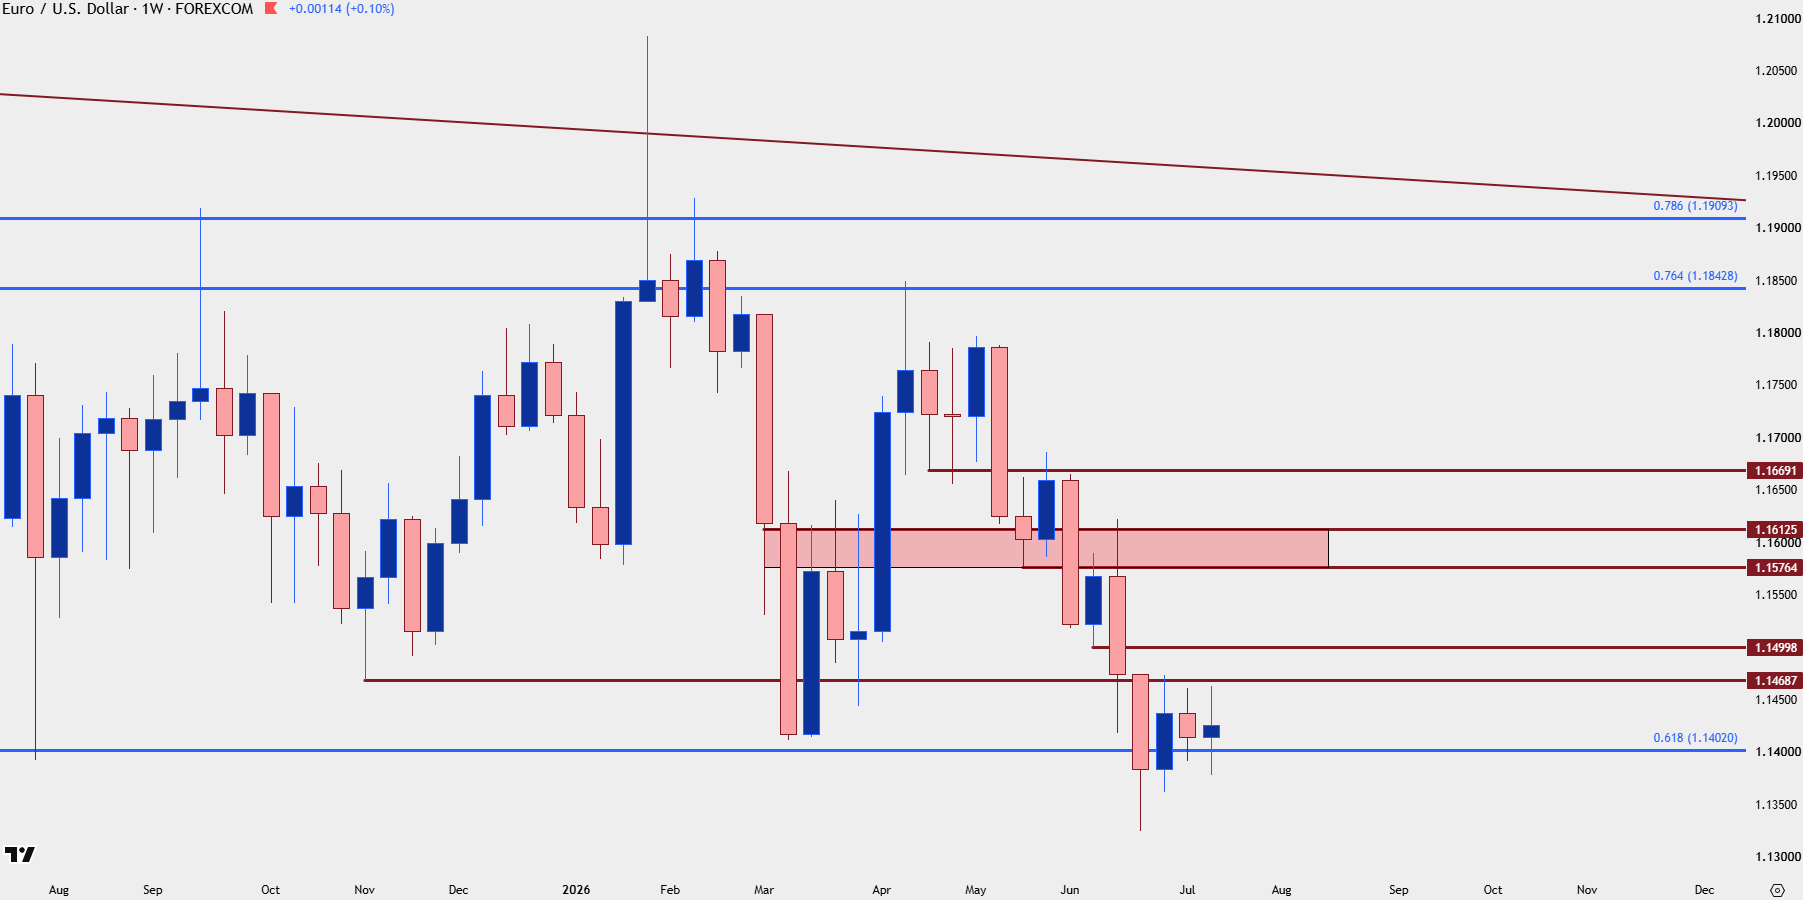
Chart prepared by James Stanley; data derived from Tradingview
Gold
Gold continues to flirt with a break of the 4k level which, so far, has been well supported. Sellers have remained persistent, however, helping to produce a descending triangle, and until buyers can push above 4200 there’s a case for further downside.
As shared in the webinar, I remain bullish on gold due to longer-term fundamentals and related expectations, but for now, the technical setup just is not there on the daily or weekly charts. Shorter-term, I did share how that could possibly change but at this point buyers have some work to do.
Gold Daily Price Chart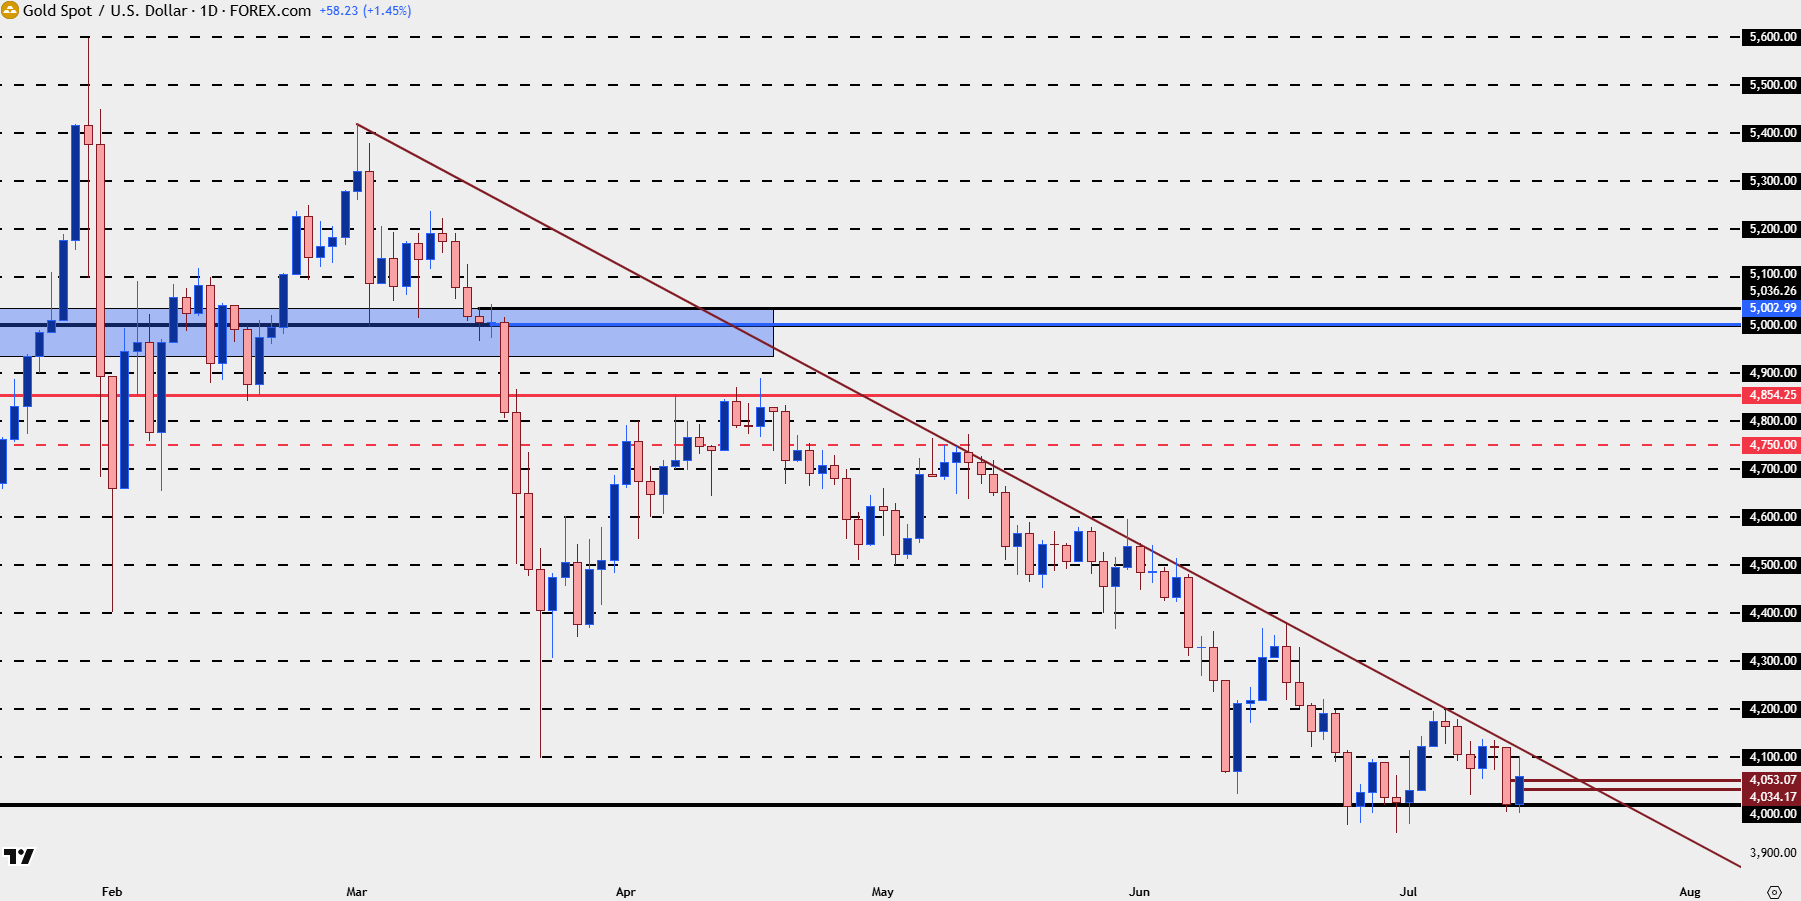
Chart prepared by James Stanley; data derived from Tradingview
Bitcoin
While gold outperformed BTC late last year and earlier this year, more recent dynamics have begun to shift as gold teeters at support while Bitcoin threatens a larger breakout. The 65k level remains a big line in the sand and a break above that opens the door for bigger picture trend resumption, although for buyers to really take away the trend they’re likely going to need some help from the US Dollar above.
But, for now, both BTC and USD are rallying after the CPI report so this certainly isn’t a situation where the Dollar must be weak for BTC to exhibit strength.
BTC/USD Daily Chart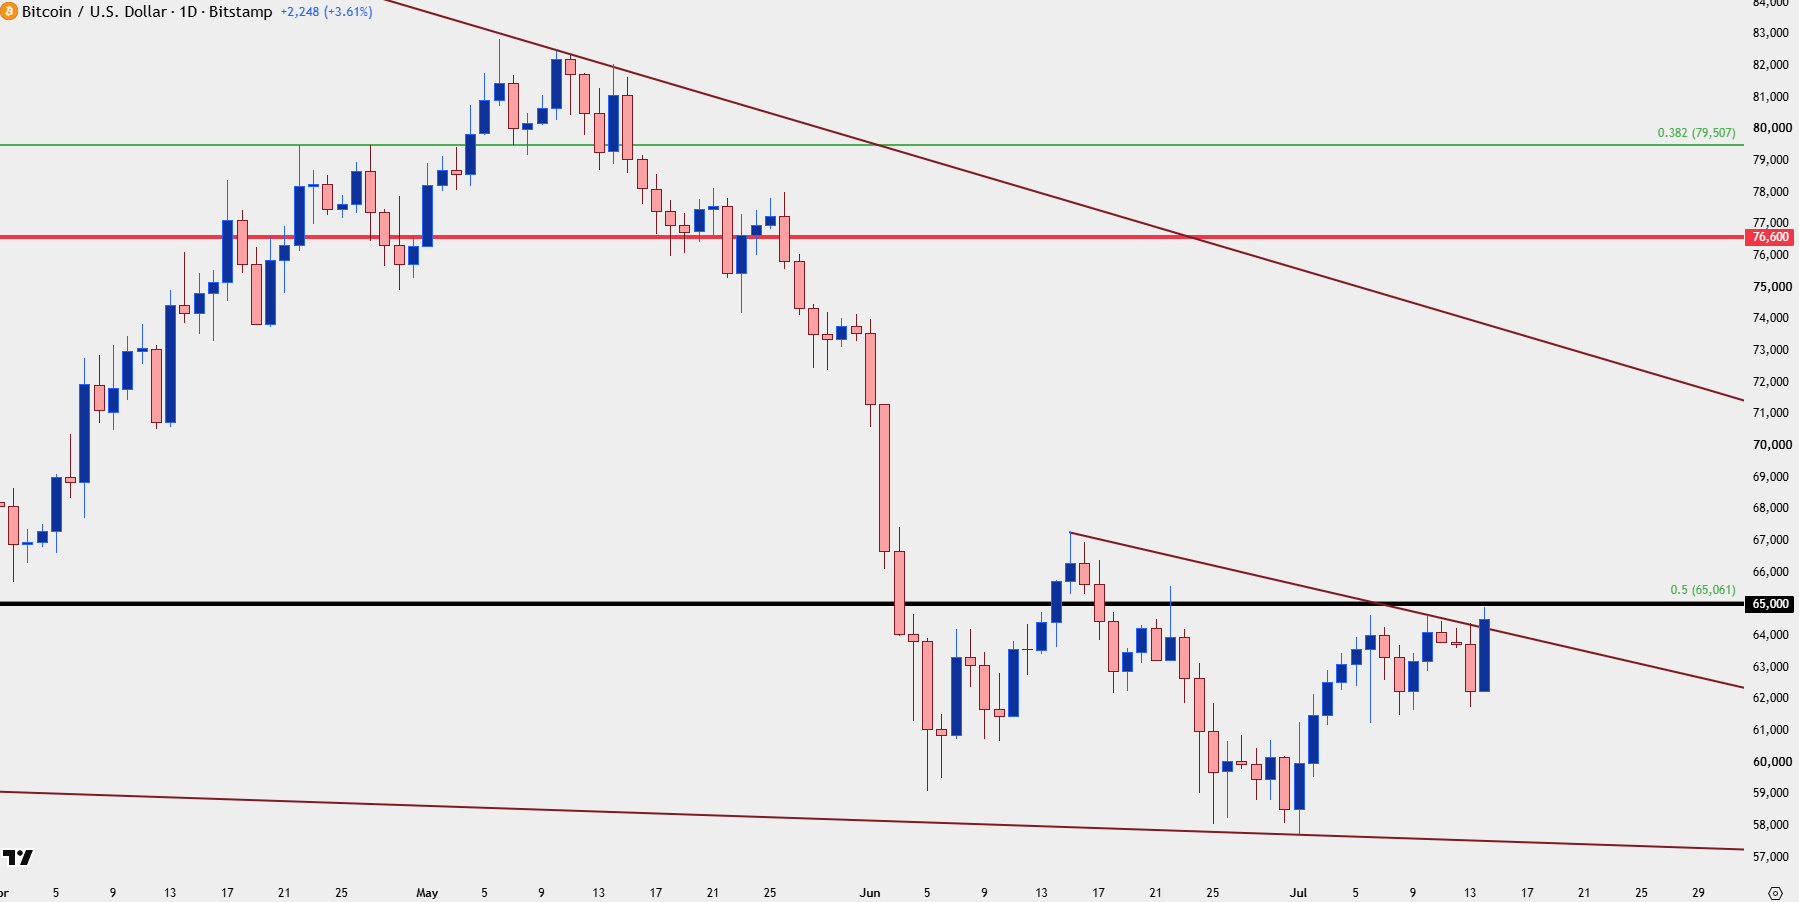
Chart prepared by James Stanley; data derived from Tradingview
--- written by James Stanley, Senior Market Analyst, Global Macro







Web Trader platform
Our sophisticated web-based platform is packed with features.
Open an account today
Experience award-winning platforms with fast and secure execution.
Economic calendar
Related articles

USD/JPY weekly outlook: Payrolls may challenge the Fed’s hawkish reset
USD/JPY has finally woken from its slumber. Payrolls now loom as the key test of whether the latest hawkish repricing sticks or sinks.


Euro Short-term Outlook: EUR/USD Pullback Nears Pivotal Uptrend Support 8 28 2026
Warsh's comments accelerated the EUR/USD selloff, raising the stakes as buyers look to stabilize the broader recovery.


Gold and S&P 500 analysis: What now after Warsh’s hawkish speech?
The dollar surged across the board after the Fed Chair Kevin Warsh surprised with a hawkish-leaning speech at the Jackson Hole summit. All the bearish dollar bets that had been accumulated since last Friday on the back of data weakness and bond market troubles had to be squared and that triggered a short squeeze rally for the dollar. Gold and silver dropped, as a result, as too did bitcoin, while US indices were giving back earlier gains.
