


US Dollar Slammed, USD/JPY Sinks on Treasury Buybacks
The US dollar broke support as Treasury buybacks sent long-end yields lower, dragging USD/JPY towards important downside levels.
Written by
Matt Simpson
Market Analyst
The US dollar suffered its sharpest decline in three weeks after increased Treasury buybacks drove long-end yields lower. With DXY breaking support and USD/JPY turning lower again, traders are watching whether the move has further to run.
View related analysis:
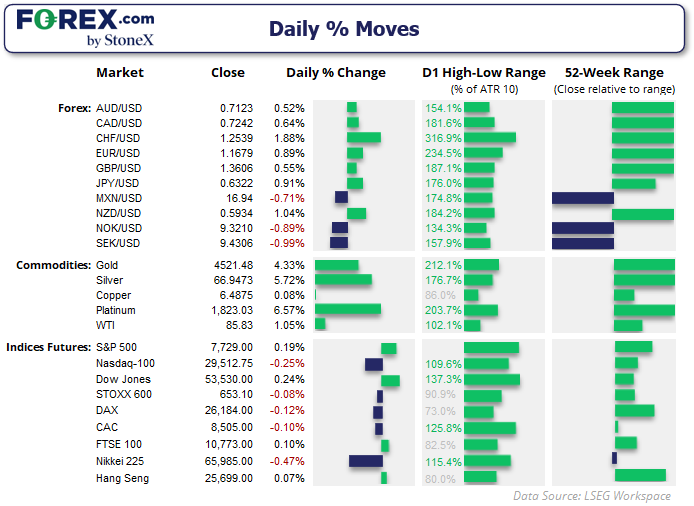
US Dollar and USD/JPY Slide as Treasury Buybacks Hit Yields
Treasury Buybacks Send Bond Yields and US Dollar Lower
The US dollar was smoked on Wednesday after the US Treasury stepped in to support the flailing bond market, sending yields at the long end sharply lower.
Ultimately, the US Treasury increased its buying of longer-dated bonds, which supported bond prices and pushed yields lower. That matters for the US dollar because lower yields reduce the relative appeal of US assets to global investors, removing a source of support for the greenback.
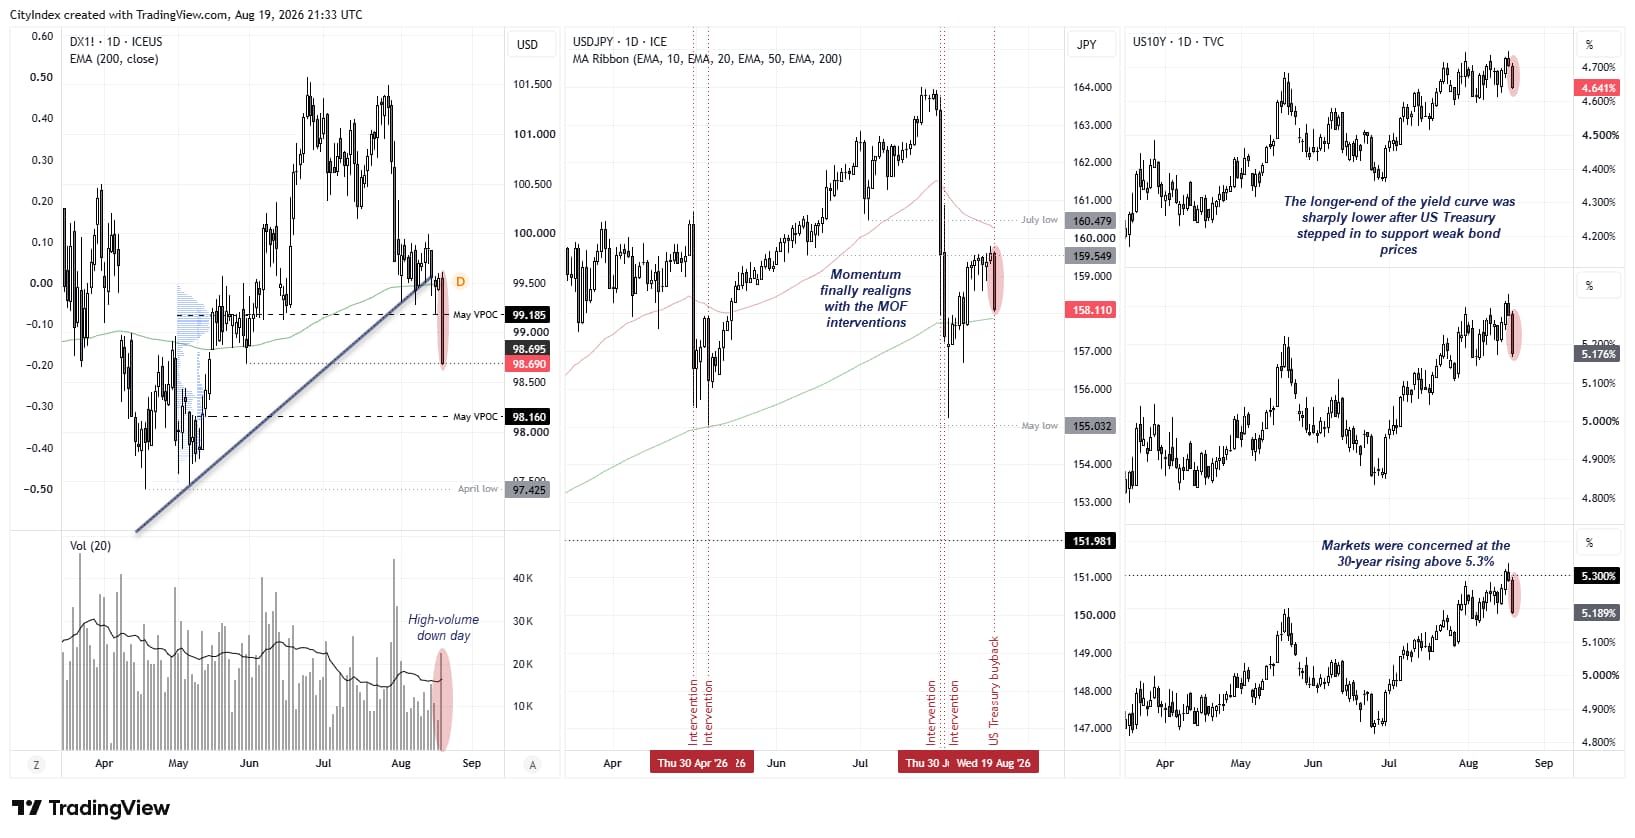
The 30-year yield fell from 5.3%, a level tested on Tuesday that had not been touched since 2007, just ahead of the global financial crisis. The 20- and 30-year yields both declined around 10bp on Wednesday, with the 30-year posting its largest daily fall in nearly two years.
And this resulted in the US dollar finally breaking several key support levels to fall 0.8%, its worst day since the US Treasury and Japan’s MOF joined forces to strengthen the Japanese yen three weeks ago.
Source: ICE, TradingView
US Dollar Breaks Support as Treasury Yields Reverse
- DXY: The broken trendline and 200-day EMA have been convincingly cleared to the downside, with the US dollar index clinging to the 98.67 swing low – a break of which brings the May VPOC into focus, just above the 98 handle. I continue to suspect we saw a major high on the US dollar index in June.
- USD/JPY: Shows the yen reaction was substantial, while the intervention markers provide useful context for why traders may already be sensitive to renewed JPY strength. Traders are now eyeing a break of the 200-day EMA
- Treasuries: The 10-, 20- and 30-year yields all reversed sharply from recent highs. Importantly, the 20- and 30-year panels make the long-end reversal obvious, supporting the Treasury-buyback narrative.
This content was created by an affiliate of FOREX.com and represents the views and opinions of the author/speakers, not the views and opinions of FOREX.com, StoneX Group Inc., or its subsidiaries. The content has not been independently reviewed by FOREX.com.
Could Treasury Buybacks Put a Ceiling on Long-Term Yields?
It's whether markets interpret the announcement as establishing a soft ceiling for long-term yields — i.e. if yields become sufficiently uncomfortable, Treasury will increase its intervention. That perception could matter considerably more for USD, gold and equities than the actual dollar amount of the purchases.
And that makes the 30-year Treasury yield particularly important to watch from here. If it rebounds towards 5.3% despite the increased buybacks, yesterday's USD selloff could look increasingly like an overreaction. If yields remain suppressed, the dollar has lost one of its recent supports.

USD/JPY Technical Analysis: US Dollar vs Japanese Yen
I have been running on the assumption that bears were waiting to retake control of USD/JPY – whether that be via another MOF intervention or otherwise. It seems Scott Bessent went with the latter, sending the US dollar broadly lower while the yen strengthened against FX majors thanks in part to safety flows. But with the US Treasury and Japan’s MOF effectively teaming up, bearish USD/JPY has been my preferred vehicle for a potentially stronger yen.
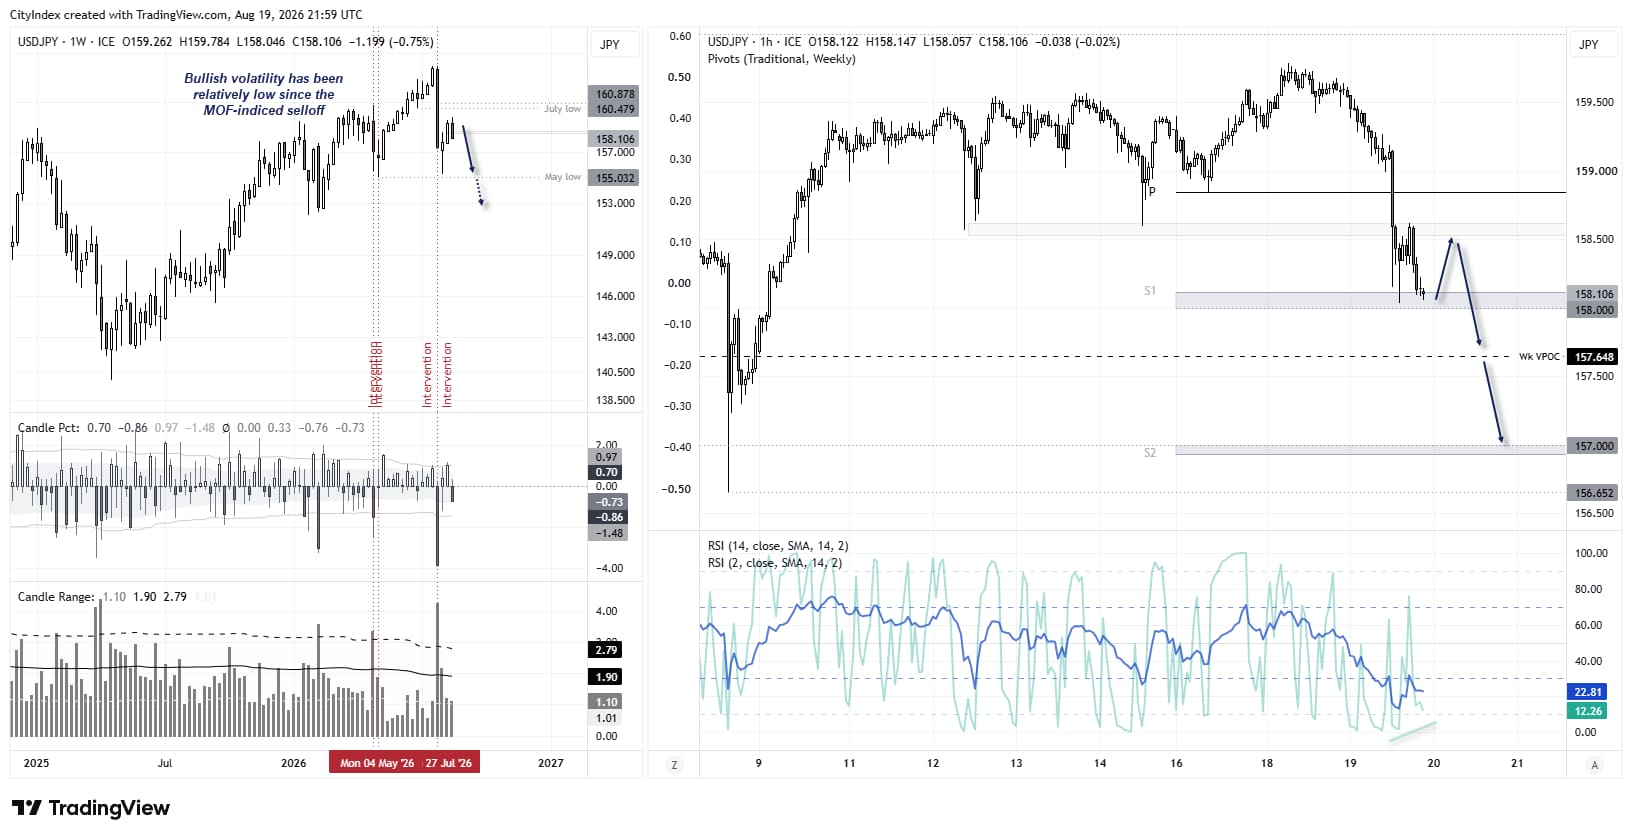
The weekly chart shows how aggressive the selloff was three weeks ago when the MOF intervened and the Fed helped. A relatively mild two-week rebound by comparison appeared unconvincing to my bearish eyes, and I have argued that USD/JPY may have topped for the year three weeks ago, while the US Dollar Index may have topped in June. Wednesday’s price action merely strengthens that view.
USD/JPY Bears Eye Another Leg Lower
Clearly, a lot of eyes will be on USD/JPY today for a potential second selloff. If the MOF had any intentions of intervening, the timing makes sense with momentum on their side. That is not to say they will, but something to consider as we get into today’s session. The MOF have been known to take advantage of weak US dollar sentiment in recent years under similar scenarios.
However, for now USD/JPY is trying to hold above 158, near the weekly S1 pivot point. If it can manage a minor bounce, I suspect bears may be seeking to fade into moves towards resistance areas such as the zone around 158.60 or the weekly pivot point around 158.80.
A break beneath 158 brings the weekly VPOC into focus at 157.65, a break of which brings 157 into view.
Source: ICE, TradingView
View the full economic calendar
-- Written by Matt Simpson
Follow Matt on Twitter @cLeverEdge
How to trade with City Index
You can trade with City Index by following these four easy steps:
- Open an account, or log in if you’re already a customer
• Open an account in the UK
• Open an account in Australia
• Open an account in Singapore
- Search for the market you want to trade in our award-winning platform
- Choose your position and size, and your stop and limit levels
- Place the trade
Related tags:
Latest market news










Web Trader platform
Our sophisticated web-based platform is packed with features.
Open an account today
Experience award-winning platforms with fast and secure execution.
Economic calendar
Related articles

Gold Falters at Resistance, Grappling With PCE, Month-End Flows and Jackson Hole
Gold has pulled back from resistance after sticky PCE data, with month-end flows and Jackson Hole now shaping the near-term outlook.

AUD/USD slips as DXY ignores the playbook
The US dollar moved against its recent macro playbook on Monday. AUD/USD paid the price, although bulls still hold the upper hand.

ASX 200 Outlook: Jackson Hole Puts Monday Volatility in Focus
ASX 200 volatility tends to rise after Jackson Hole, while sector correlations highlight the clearest support, resistance and leadership signals.