


USD/CAD & Dow Jones Outlook: Key Breakout Scenarios
USD/CAD and Dow Jones outlook as strong earnings and softer US CPI compete with Hormuz tensions. Key support, resistance, and breakout levels to watch.
Written by
Razan Hilal
Market Analyst
Market sentiment remains caught between stronger-than-expected corporate earnings and a softer US CPI report on one hand, and a cautious second-half outlook alongside lingering geopolitical risks surrounding the Strait of Hormuz on the other.
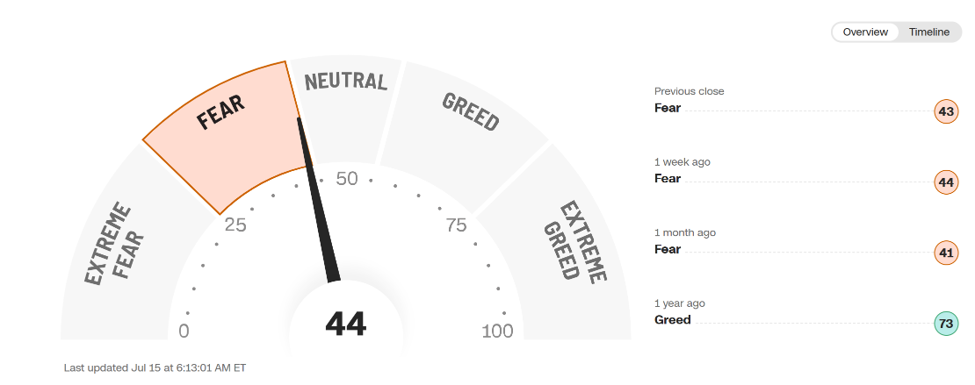
CNN Fear & Greed Index
Source: CNN
This crosscurrent continues to tilt sentiment toward fear, supporting the US dollar and crude oil while limiting upside momentum across major currency pairs and risk assets.
Markets are increasingly being influenced by:
- Disruptions to global shipping, with higher transit costs and restricted access across parts of the Strait of Hormuz.
- A cautious second-half outlook from corporate management teams despite stronger-than-expected earnings from major US banks, including JPMorgan and Goldman Sachs, as well as AI semiconductor leader ASML.
- Crude oil rebounding toward the $80 mark.
- Equity indices continuing to consolidate below their record highs rather than extending comfortably to the upside.
From an FX perspective, the US Dollar Index (DXY) and USD/JPY remain among the most important charts to monitor. USD/JPY is trading near levels last seen in the 1980s and could be at risk of another steep bullish breakout toward 170 should the DXY confirm its own breakout above 102.
As leaders across the FX market, the technical outlook for DXY and USD/JPY—together with the broader outlook for precious metals discussed in my latest article—could spill over into both the USD/CAD and Dow Jones charts. USD/JPY & Silver Outlook: Dollar Holds, Silver Weakens
- USD/CAD is rebounding from the psychological 1.4000 level while hourly oversold momentum reaches levels last seen in May 2026, coinciding with the DXY's rebound from 100.60.
- The Dow Jones continues to respect an ascending resistance trendline that has guided price action since April 2026, following the latest pullback from its record high near 53,300.
I discussed these technical patterns in the latest bi-weekly webinar.
USD/CAD Price Outlook: Three-Day Time Frame – Log Scale
Source: TradingView
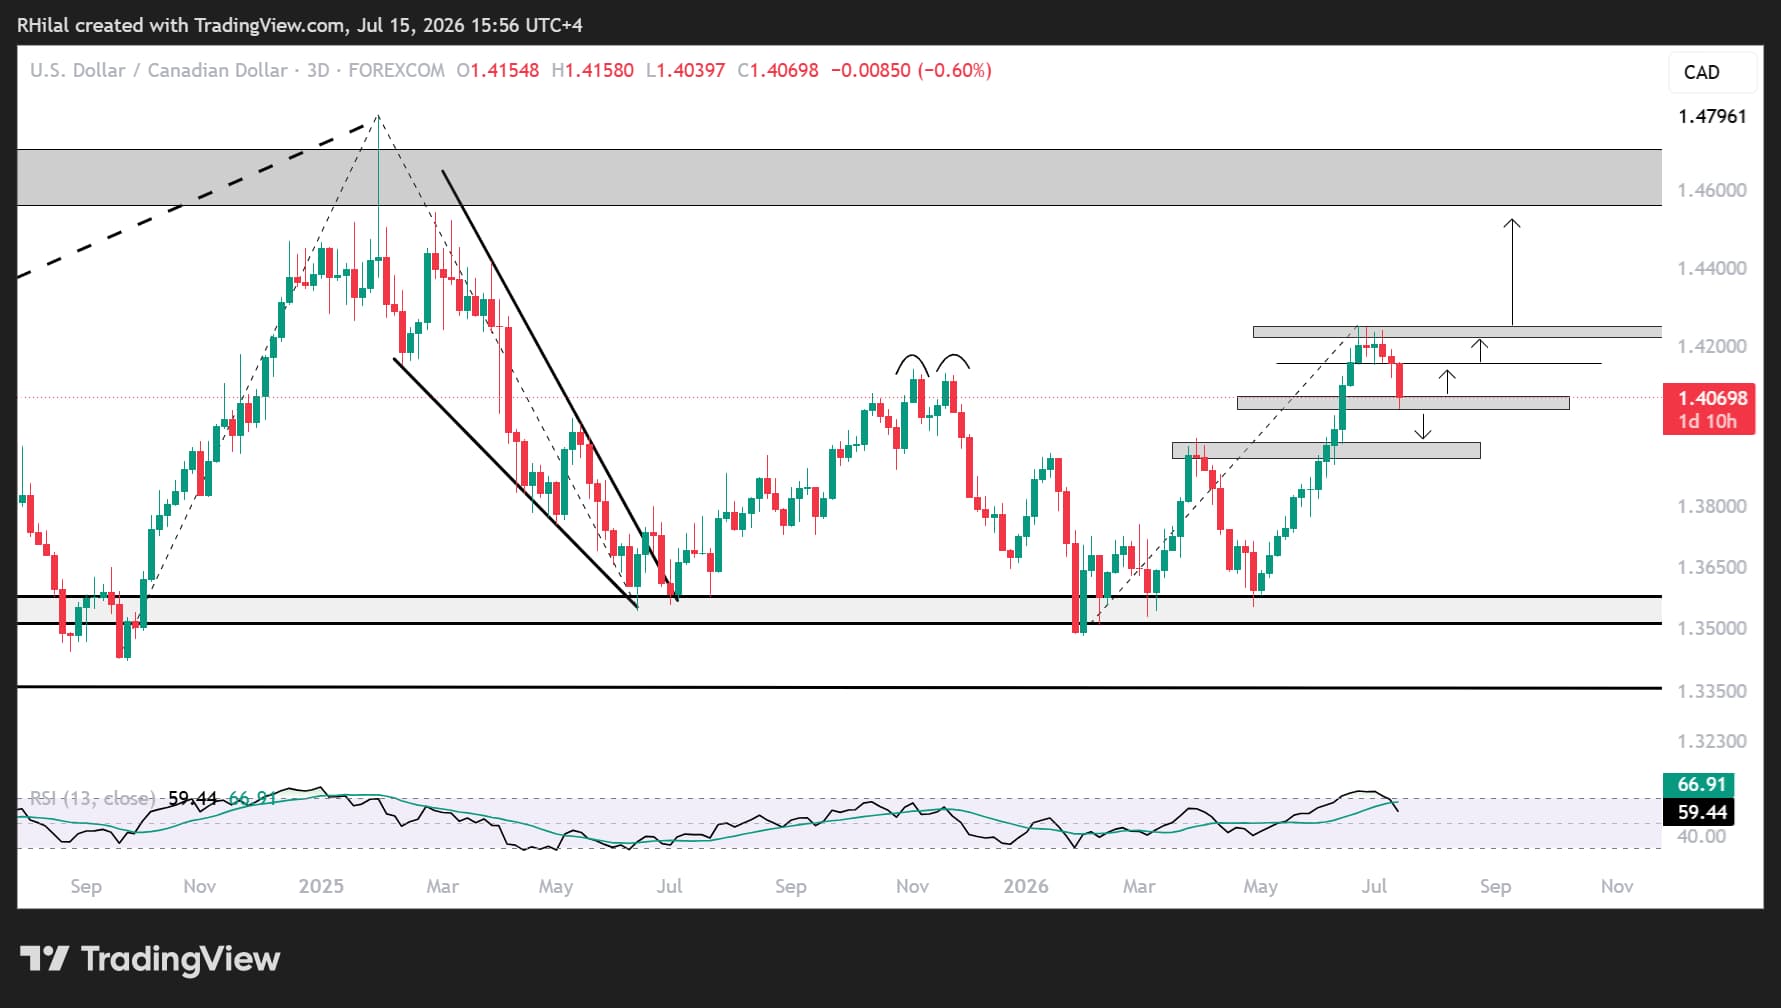
USD/CAD continues to hold above the psychological 1.4000 level and the 27.2% Fibonacci retracement of the January-June 2026 advance. In line with the DXY holding above 100.60 and USD/JPY remaining above 162, USD/CAD may continue recovering as oversold momentum begins to stabilize on the four-hour chart.
A breakout above 1.4070 would expose the 1.4150 and 1.4250 resistance levels once again, where price could either stage another pullback or extend its recovery toward the 1.4500 high last seen in February 2025.
On the downside, a breakdown below 1.4000 would increase drawdown risks in line with bearish daily momentum, exposing the next Fibonacci retracement level at 38.2%, which also aligns with the April breakout zone near 1.3960-1.3900. This area represents a high-probability rebound zone. Failure to hold there could indicate that a broader US dollar correction is developing across the FX market.
Dow Jones Price Outlook: Weekly Time Frame – Log Scale
Source: TradingView
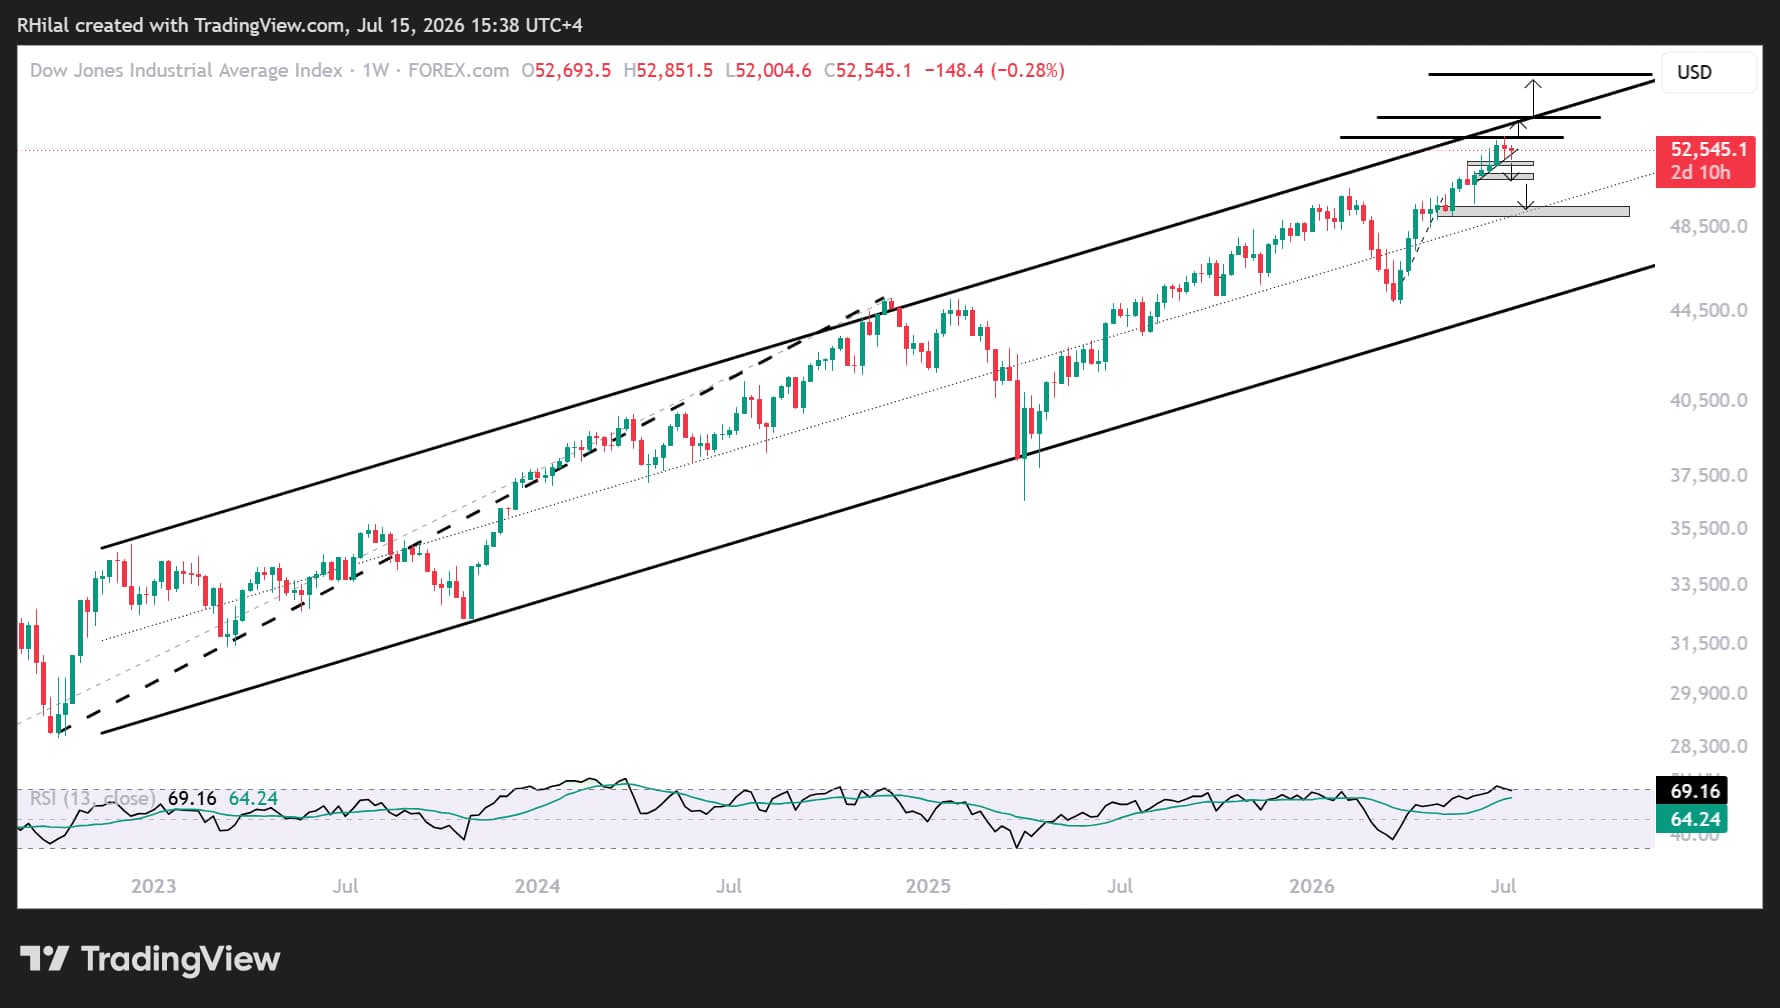
The Dow Jones has recently pulled back from a major technical confluence zone that aligns with:
- The upper boundary of the ascending parallel channel in place since 2022.
- The ascending resistance trendline connecting consecutive highs since April 2026.
- The 100% Fibonacci extension of the October 2022-November 2024-April 2025 advance.
Should the index break sustainably above 53,000, the next upside objective would be 54,300 for a high probability pullback risk in line with the upper channel boundary. If momentum continues to advance beyond that level and channel, the dow is expected to extend gains towards the 127.2% Fibonacci extension near 57,000, representing a significant breakout above a four-year resistance zone.
However, weekly momentum conditions continue to point toward overbought territory, increasing the probability of a deeper corrective pullback toward the midpoint of the ascending channel near 49,700.
A confirmed breakdown below 51,900, followed by 50,900, 50,000, and 49,700, would strengthen the bearish case, exposing the 27.2% and 38.2% Fibonacci retracement levels of the March-June advance and potentially setting the stage for another major rebound.
Key Takeaway
Similar to the triangle consolidations currently developing on the Nasdaq and USD/JPY charts, both USD/CAD and the Dow Jones are approaching decisive technical inflection points.
Whether these consolidations resolve higher or lower is likely to depend on the evolution of the Strait of Hormuz tensions, the resilience of the US dollar, crude oil's ability to sustain its rebound, and whether corporate earnings continue to outweigh growing geopolitical risks during the second half of the year.
Written by Razan Hilal, CMT
Follow on X: @Rh_waves







Web Trader platform
Our sophisticated web-based platform is packed with features.
Open an account today
Experience award-winning platforms with fast and secure execution.
Economic calendar
Related articles

Euro Short-term Outlook: EUR/USD Pullback Nears Pivotal Uptrend Support 8 28 2026
Warsh's comments accelerated the EUR/USD selloff, raising the stakes as buyers look to stabilize the broader recovery.


Gold and S&P 500 analysis: What now after Warsh’s hawkish speech?
The dollar surged across the board after the Fed Chair Kevin Warsh surprised with a hawkish-leaning speech at the Jackson Hole summit. All the bearish dollar bets that had been accumulated since last Friday on the back of data weakness and bond market troubles had to be squared and that triggered a short squeeze rally for the dollar. Gold and silver dropped, as a result, as too did bitcoin, while US indices were giving back earlier gains.


Nasdaq 100 Forecast: NDX slips ahead of Fed Chair Warsh’s speech
U.S. stocks are edging lower on Friday, giving back some of yesterday's gains after Nvidia's strong outlook revived the tech trade. The focus has now shifted firmly to Fed Chair Kevin Warsh's Jackson Hole speech, with investors looking for more clarity on the outlook for interest rates.
