

USD/CAD dips as Trump brings TACO to tariff talks
The tariff threat overhanging USD/CAD has been abruptly removed, with Donald Trump saying both nations have a deal.
Written by
David Scutt
Market Analyst
- Trump delays threatened 50% tariffs on Canadian goods
- US-Canada deal puts Keystone XL pipeline back on the table
- USD/CAD tariff tail risk materially reduced
As alluded to in a separate analysis piece released on Tuesday, one of the key headwinds overhanging USD/CAD was the status of tariff negotiations between the United States and Canada. Well, it looks like Donald Trump has brought TACO to the tariff negotiations.
In a Truth Social post, Trump said the slated 50% tariffs on roughly US$20 billion of Canadian goods, which had been due to kick in tomorrow morning, have now been postponed for three days. More importantly, he said the two sides, subject to the finalisation of documents, “have a DEAL!”
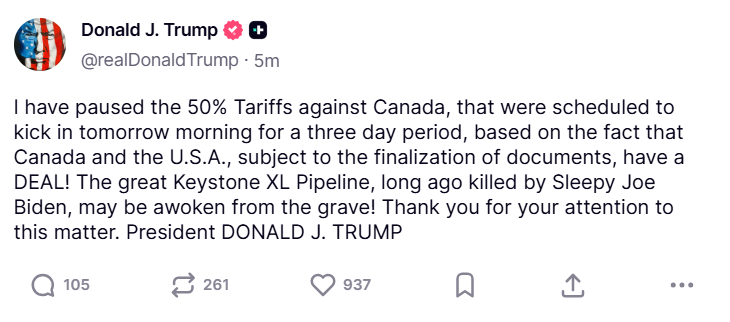
Source: Truth Social
Of note, after repeated setbacks in trying to secure cheaper energy from the Gulf, energy infrastructure looks to be at the centre of the agreement. With talks between the United States and Iran now effectively dead, Trump appears to be looking north for another route to eventually deliver lower US energy prices. He immediately linked the tariff reprieve to the Keystone XL pipeline.
Trump approved the project during his first term, only for the Democrats to pull the plug after returning to power. Now, more than five years later, it looks like it may be back on the table.
Bullish reversal risk recedes
Source: TradingView
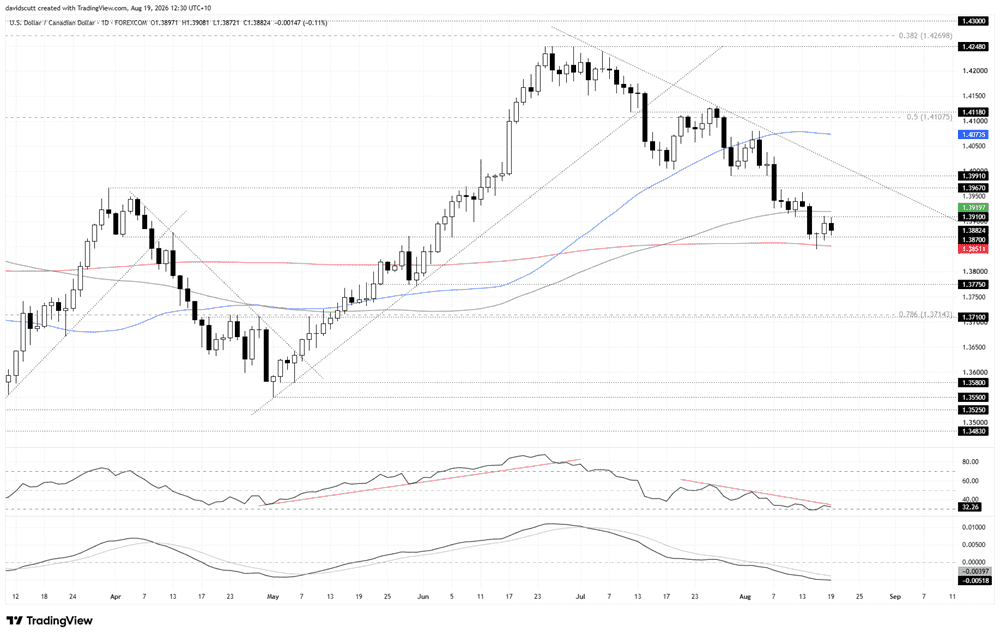
Having flagged bullish reversal risks a little over 24 hours ago, USD/CAD did pop higher on Tuesday, with the close roughly in line with the midpoint of Monday’s bearish candle, completing a three-candle morning star reversal pattern in the process.
However, the latest news flow immediately raises questions about the validity of that signal, with USD/CAD pulling back from minor horizontal resistance at 1.3910. The pair remains stuck in a narrow range between that level on the topside and a support zone running from 1.3870 down to the 200-day moving average at 1.3851. Those are the two immediate focal points for traders.
Given the reaction to the tariff news, the risk of a resumption of the broader bearish trend may be increasing, putting the emphasis on a potential break beneath the lower end of that support zone. If that were to occur, 1.3775 is the first level to watch, followed by a more pronounced support zone around 1.3714, the 78.6% Fibonacci retracement of the September 2024 to January 2025 bull move. That area has seen plenty of work over recent months, acting as resistance for lengthy periods earlier this year.
If the bullish price signal proves more prescient, the immediate focal point above 1.3910 is the 100-day simple moving average at 1.3919, where the price bounced on several occasions before breaking lower earlier this week. A break above would put horizontal resistance at 1.3967 in play, with 1.3991 another minor level overhead before the broader downtrend from the July highs comes into play.
The message from the oscillators still favours selling into strength. RSI (14) continues to trend lower and sits marginally above oversold territory at 32, while MACD confirms the message, continuing to trend lower in negative territory after crossing its signal line from above.
FOMC minutes loom
The FOMC minutes from the July meeting screen as the most likely fundamental catalyst to determine the next move in USD/CAD. With Fed tightening expectations having been pared sharply following the recent run of softer US data, traders will be watching for signs of whether the hawkish dissents seen at the meeting extended more broadly across the committee.
Related tags:
Latest market news










Web Trader platform
Our sophisticated web-based platform is packed with features.
Open an account today
Experience award-winning platforms with fast and secure execution.
Economic calendar
Related articles

EUR/USD forecast: All eyes on Warsh at Jackson Hole - Forex Friday
For much of this week, the EUR/USD has been edging lower with the US dollar regaining some ground after last week’s sell-off that was triggered, in part, by the bond market worries. Investors have been unwilling to bet further against the US dollar so far this week ahead of Kevin Warsh’s keynote speech at the Jackson Hole summit, due later today.


Bitcoin Forecast: BTC/USD Back to $80K Ahead of Warsh’s Jackson Hole Speech
After surging over $15,000 in the past 10 days alone, there is risk of a near-term pullback if Warsh says anything remotely hawkish at Jackson Hole - what are the levels to watch from here?


DAX and EUR/USD forecast: Lower energy prices, yields offer support
But the question, of course, is how much further oil prices and bond yields can fall. For now, the combination is supportive of risk assets and is helping to sustain a relatively benign decline in the dollar. The focus today will be on US core PCE inflation, due for release shortly, while Nvidia’s second-quarter earnings will provide another test for risk appetite after the US markets close – not just for US indices but for global tech-heavy indices given the influence Nvidia has over the global tech and AI names.