


USD/JPY Near 160, Dow Rally Pauses Below Record High
USD/JPY holds its rebound near 160 as the Dow pauses below record highs. Key technical levels signal rising pullback risks amid Fed and geopolitical uncertainty.
Written by
Razan Hilal
Market Analyst
USD/JPY is holding its rebound near the 160 level, testing the possibility of reclaiming its 2026 uptrend as the US Dollar Index maintains its broader bullish structure.
In contrast, US equity indices are showing signs of slowing momentum. The Dow Jones is consolidating near the upper boundary of its 2022-2026 ascending channel and below the 54,700 record resistance, while longer-term momentum is flashing overbought conditions last seen in 2018.
The divergence between a resilient US dollar and increasingly stretched equity markets raises the risk of a short-term pullback across risk assets, particularly as geopolitical uncertainty remains a dominant market driver heading toward Q4.
The latest US CPI report showed headline inflation easing to the expected 3.4%, providing little reason for markets to materially reassess the Federal Reserve outlook. However, another inflation report and employment report are still due before the September Fed meeting, leaving the policy outlook sensitive to incoming data.
Meanwhile, geopolitical risks remain elevated. Crude oil continues to trade at elevated levels above the broader $70-$80 region, while the US dollar remains supported. Together, these conditions maintain short-term downside risks across major currency pairs, risk assets, and precious metals, while potentially supporting further upside across US dollar pairs.
Against this backdrop, USD/JPY and the Dow Jones are approaching technical levels that could help define the next directional move.
USD/JPY Price Outlook: Weekly Time Frame – Log Scale
Source: TradingView
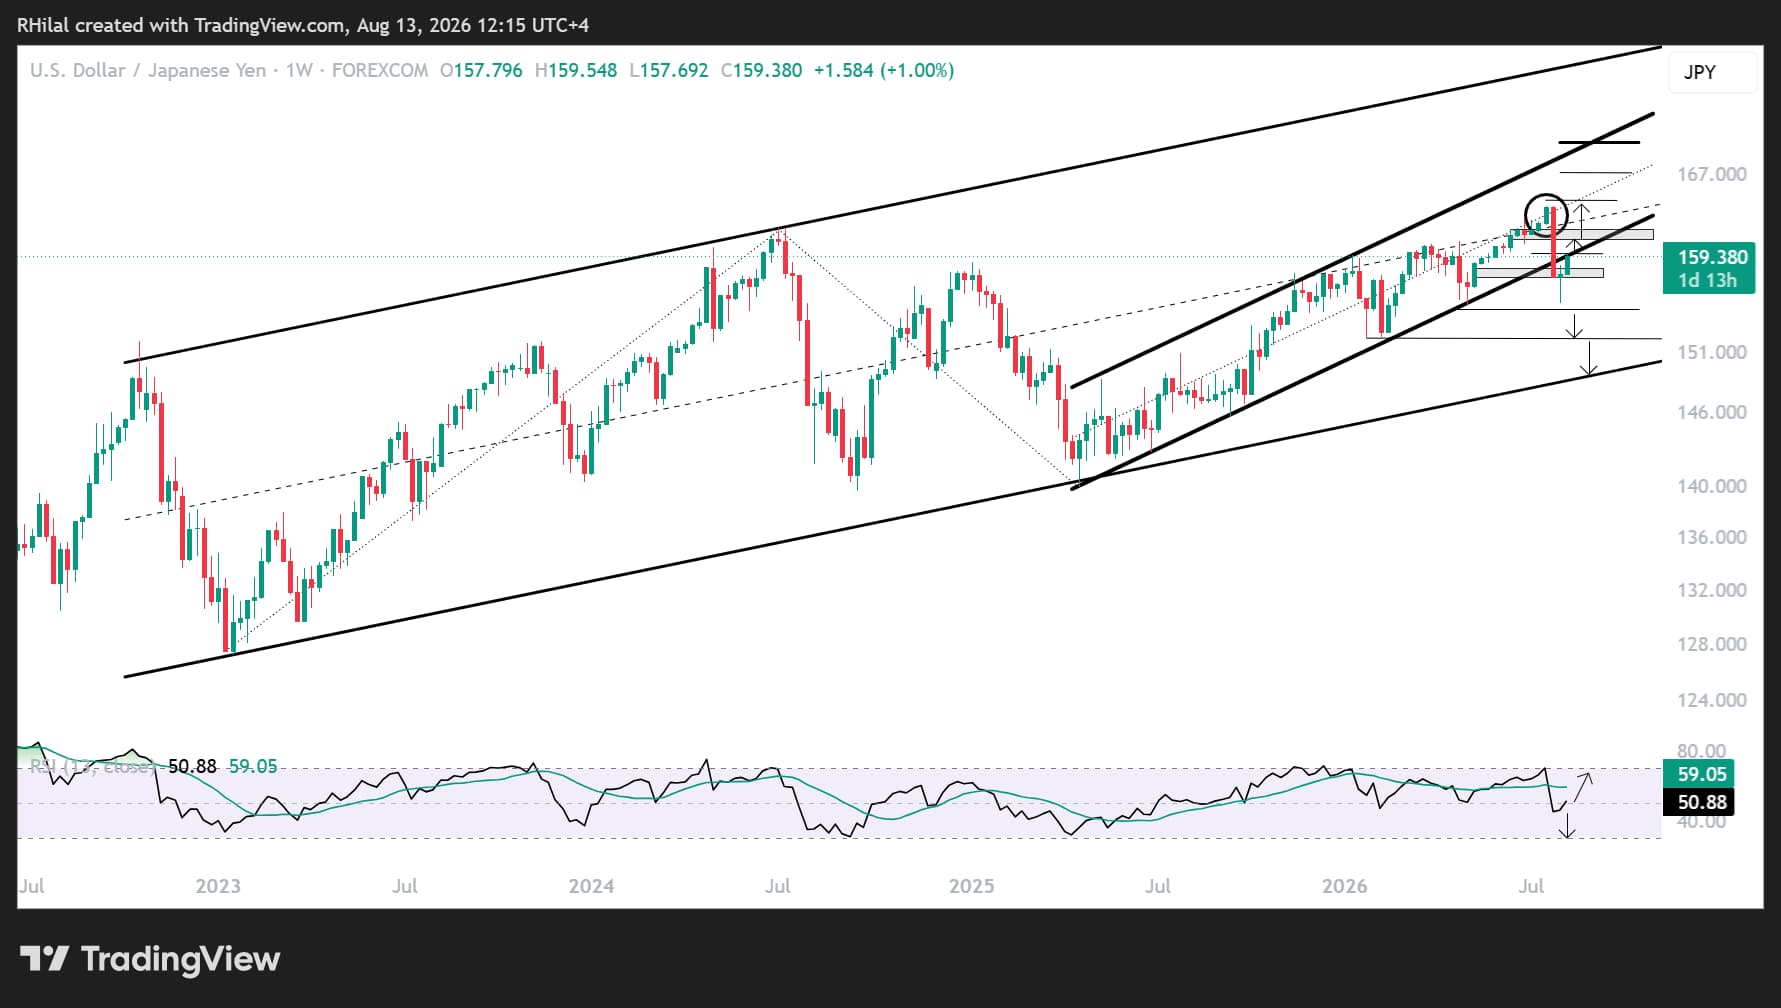
USD/JPY has rebounded strongly after its pullback from the 164.00 confluence zone, an important resistance area aligning with the midpoint of the April 2025-July 2026 channel and the broader 2022-2026 ascending structure.
The decline found support near 155.00, where several technical signals converged:
- The 38.2% Fibonacci retracement of the April 2025-July 2026 advance.
- Daily momentum reaching oversold conditions last seen in 2024.
- The breakdown area around the 2025-2026 ascending channel.
The rebound from this confluence has returned attention to the 159.50-160.00 region.
Should USD/JPY stabilize above 159.50 and reclaim 160.00, bullish momentum could strengthen, exposing 161.00, 161.80, and eventually 164.00.
These former technical levels may now act as resistance as the pair once again approaches price levels not seen since the 1980s.
A sustained breakout above 164.00 would represent a significant technical development, potentially opening the path toward the upper boundary of the broader ascending channel near 170, although such a move would likely require a substantial rebuilding of upside momentum.
Conversely, another rejection from the 159.50-160.00 region followed by a close below 155.00 would weaken the rebound and expose the next support levels at 152.00 and 149.00.
The latter remains a particularly important region, aligning with the lower boundary of the 2022-2026 channel and potentially defining the longer-term bullish versus bearish structure for USD/JPY.
From a broader intermarket perspective, the bullish dollar bias remains supported while geopolitical risks persist, DXY holds above its key 99.30 support, US Treasury yields remain elevated, and expectations for additional Federal Reserve tightening remain in play.
A durable framework governing Middle East shipping routes, a DXY breakdown below 99.30, falling Treasury yields, and a further reduction in Fed tightening expectations would weaken that bullish case.
Dow Jones Outlook: Weekly Time Frame – Log Scale
Source: TradingView
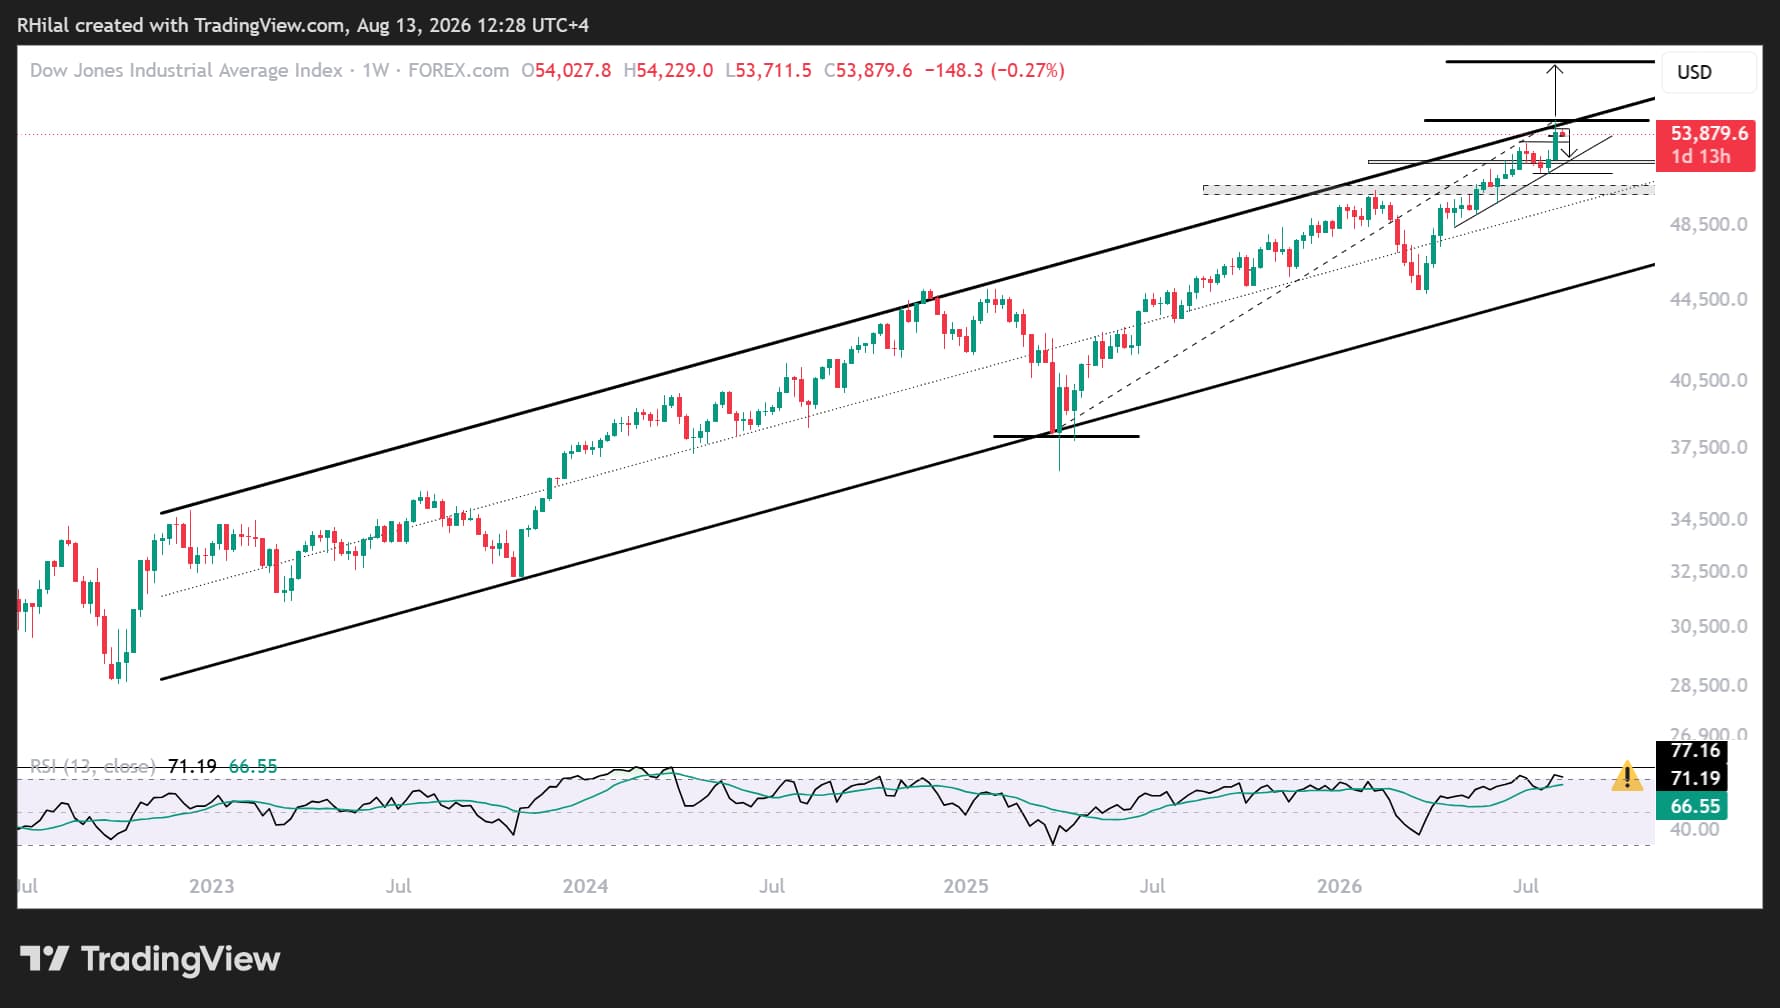
Both the weekly and monthly Dow Jones charts suggest that upside momentum is becoming increasingly stretched, with the index consolidating near a major long-term technical confluence.
The key resistance area combines:
- The upper boundary of the ascending channel that has guided price action since 2022.
- The 100% Fibonacci extension of the April 2025-January 2026-March 2026 price cycle near 54,700.
- Longer-term overbought momentum conditions, increasing the risk of a corrective move if buyers fail to secure a breakout.
From a fundamental perspective, optimism surrounding a potential US-Iran agreement has helped improve market sentiment. However, a lasting framework has yet to be established.
Geopolitical risk premiums therefore remain embedded across financial markets, leaving the Dow's rally vulnerable while the index remains below its major resistance zone.
A decisive breakout above 54,700-55,000 would strengthen the longer-term bullish outlook and signal that buyers remain in control despite stretched momentum.
Conversely, failure to clear this resistance could encourage profit-taking and a corrective pullback.
Should a deeper decline develop, the August low near 52,400-52,200 represents the next major support region, aligning approximately with the 23.6%-27.2% Fibonacci retracement of the March-August advance.
Shorter-term levels provide additional clues about which scenario may develop first.
Dow Jones Outlook: 4-Hour Time Frame – Log Scale
Source: TradingView
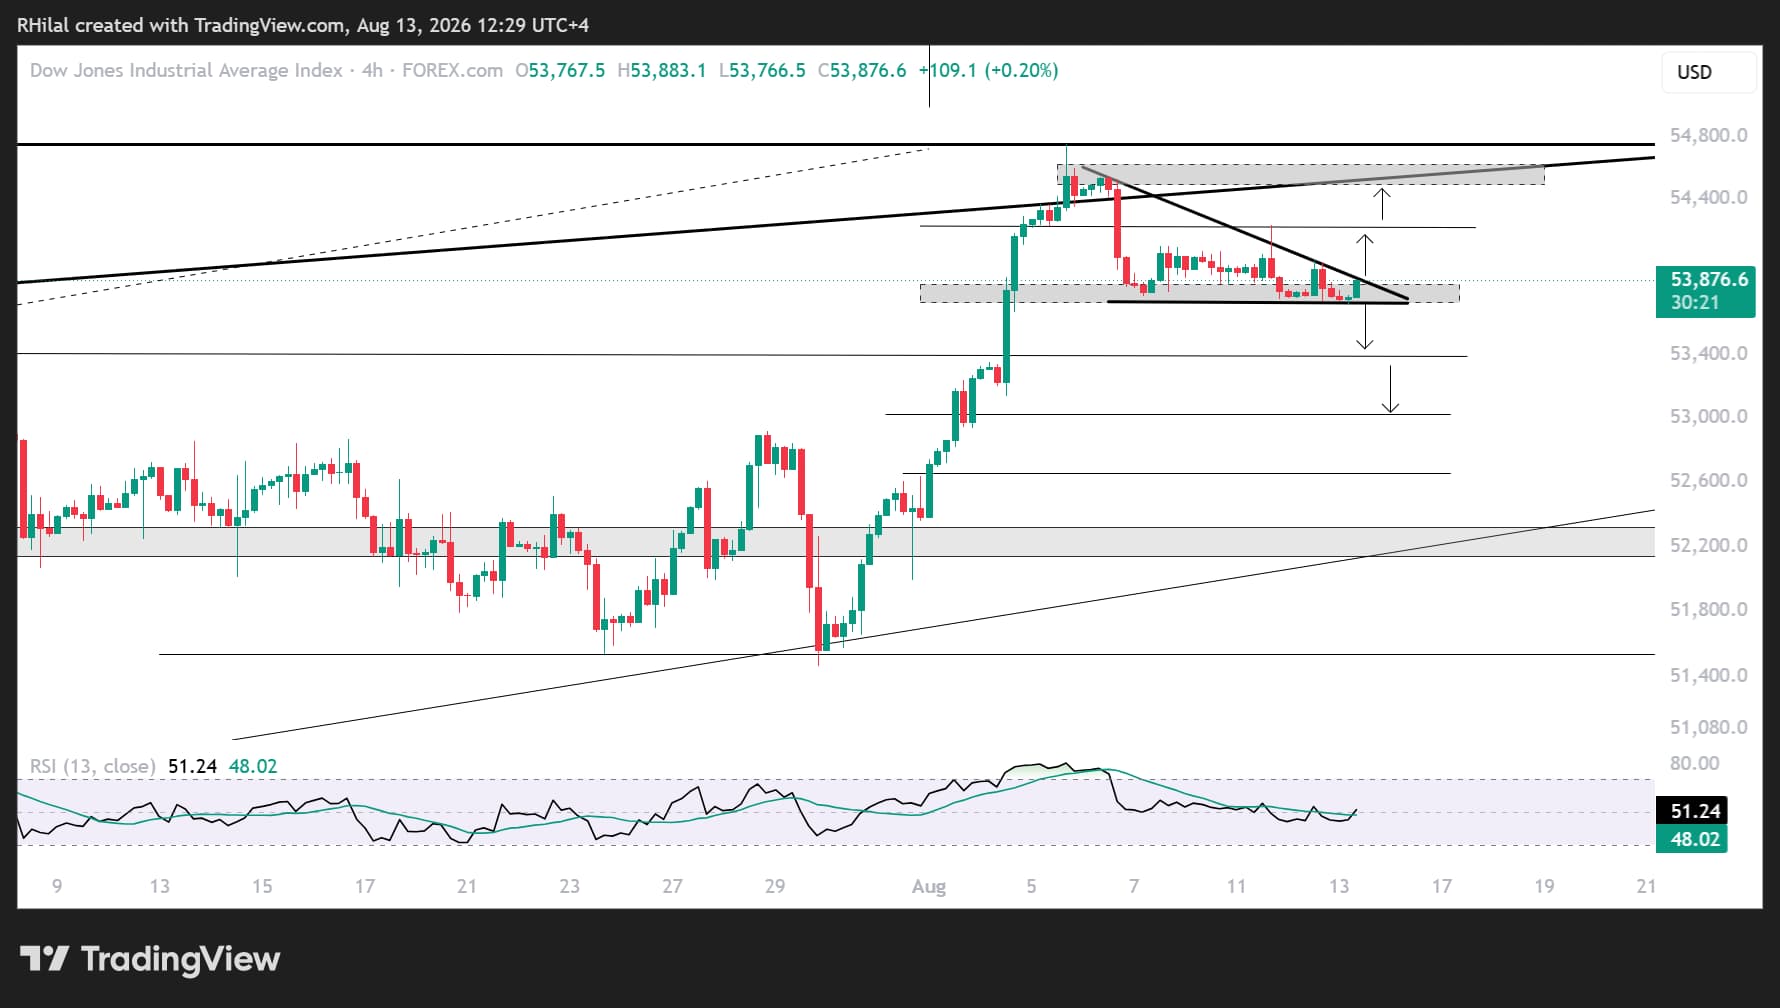
From a four-hour perspective, the Dow's consolidation is approaching a critical contraction point within what resembles a descending triangle formation.
The first downside trigger sits near 53,700.
A confirmed breakdown below this level would expose:
- 53,400, near the 38.2% Fibonacci retracement of the July-August advance.
- 53,000, near the 50% retracement and the approximate target of the descending-triangle breakdown.
A sustained break below 53,000 would increase the risk of a deeper correction toward the broader rising support connecting the higher lows established since April 2026, currently near 52,100.
This would also bring the 52,400-52,200 weekly support region back into focus.
On the upside, a bullish breakout from the consolidation above 54,000-54,200 would shift attention back toward the record high near 54,700.
That level remains critical.
Another rejection from 54,700 could reinforce short-term pullback risks, while a sustained breakout above the record high and ultimately 55,000 could open the path toward another longer-term advance.
Such a breakout would likely gain additional confirmation from an improving risk-on environment, easing geopolitical tensions, and a less hawkish Federal Reserve policy outlook.
USD/JPY and Dow Jones Outlook: Key Levels to Watch
For now, the two markets are sending contrasting signals.
USD/JPY continues to rebuild bullish momentum toward 160, supported by broader US dollar resilience, while the Dow Jones remains near record highs but is showing increasingly stretched momentum beneath major long-term resistance.
For USD/JPY, 159.50-160.00 is the immediate upside test, followed by 161.00, 161.80, and 164.00. A move back below 155.00 would instead weaken the recovery.
For the Dow, 53,700 represents the first short-term downside trigger, while 54,700-55,000 remains the defining resistance zone for the longer-term bullish scenario.
Until these levels are decisively resolved, short-term pullback risks across risk assets remain elevated, while the US dollar retains a relatively stronger technical bias.
Written by Razan Hilal, CMT
Follow on X: @Rh_waves
Latest market news










Web Trader platform
Our sophisticated web-based platform is packed with features.
Open an account today
Experience award-winning platforms with fast and secure execution.
Economic calendar
Related articles

Gold and S&P 500 analysis: What now after Warsh’s hawkish speech?
The dollar surged across the board after the Fed Chair Kevin Warsh surprised with a hawkish-leaning speech at the Jackson Hole summit. All the bearish dollar bets that had been accumulated since last Friday on the back of data weakness and bond market troubles had to be squared and that triggered a short squeeze rally for the dollar. Gold and silver dropped, as a result, as too did bitcoin, while US indices were giving back earlier gains.


Nasdaq 100 Forecast: NDX slips ahead of Fed Chair Warsh’s speech
U.S. stocks are edging lower on Friday, giving back some of yesterday's gains after Nvidia's strong outlook revived the tech trade. The focus has now shifted firmly to Fed Chair Kevin Warsh's Jackson Hole speech, with investors looking for more clarity on the outlook for interest rates.


Bitcoin Forecast: BTC/USD Back to $80K Ahead of Warsh’s Jackson Hole Speech
After surging over $15,000 in the past 10 days alone, there is risk of a near-term pullback if Warsh says anything remotely hawkish at Jackson Hole - what are the levels to watch from here?
