

USD/JPY, Nikkei Break Lower as AI Meltdown Spreads
Thursday’s tech tantrum has become Friday’s fire sale. With Nikkei support giving way and the yen strengthening, could the selling start feeding on itself?
Written by
David Scutt
Market Analyst
- Nikkei breaks beneath key support zone as selling extends
- USD/JPY loses support as yen strength adds equity pressure
- Treasury regressions provide little evidence of forced carry unwinds yet
- Rising volatility and narrowing yield spreads raise liquidation risks
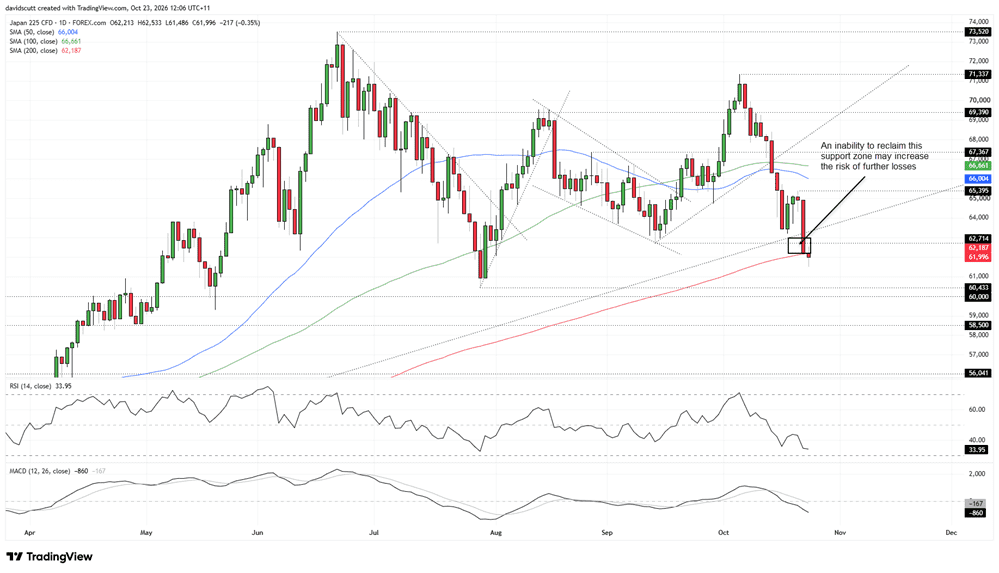
Thursday’s tech stock tantrum has been replaced by Friday’s fire sale, with losses extending on the Nikkei 225, taking the index below its key 200-day moving average. That raises the risk of additional downside and further selling pressure in other AI-linked markets, along with US Treasury yields and potentially the US dollar.
As discussed in this morning’s analysis, broader AI sentiment has become an important driver of moves across equities, bonds and currencies. With three of the Nikkei’s four biggest constituents directly linked to the AI trade, it’s a market to keep on the watch list for signs of whether the selling pressure could extend into European and US trade later Friday.
Yen strength adds to the pressure
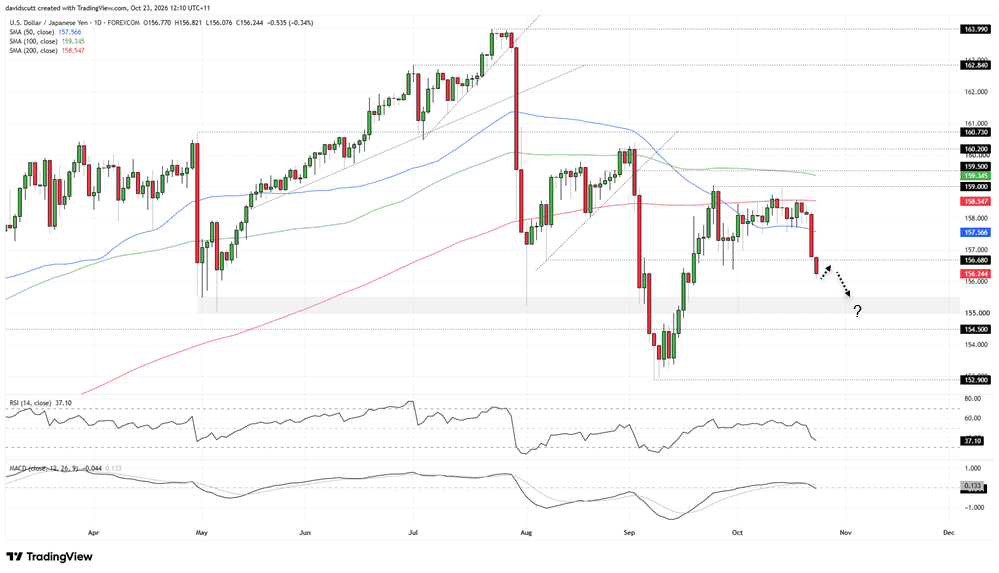
Adding pressure to the index, the Japanese yen is also strengthening, with USD/JPY breaking beneath support at 156.68, a level that attracted bids on each of its previous retests. A stronger yen adds another potential headwind for the Nikkei’s internationally exposed companies, reducing the yen value of overseas earnings. That could compound the pressure from the broader global AI sell-off.
Further AI-linked stock losses globally may also amplify the risk of forced selling as yen-funded carry trades are unwound due to unfavourable movements in yield differentials, yen valuation and volatility.
Little evidence of carry trade unwinds yet
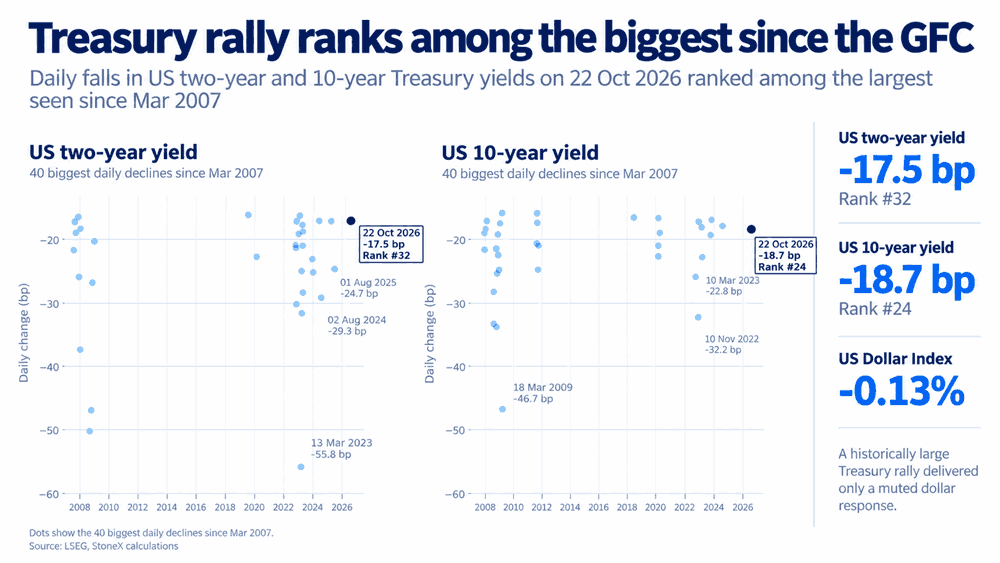
There was little evidence of forced carry-trade unwinds in Thursday’s price action. USD/JPY fell 0.84%, broadly consistent with the collapse in US Treasury yields. Using 40-session regressions, the decline in two-year yields implied a 0.59% fall in USD/JPY, while the decline in 10-year yields implied a 0.69% fall. The yen’s rally was therefore not unusually large relative to the rates move.
Source: LSEG
However, VXN, the Nasdaq 100’s equivalent of the VIX, surged 4.30 points on Thursday. MOVE, which measures implied volatility across the US Treasury curve over the coming 30 days, jumped 10.90 points to 106.84, while US-Japan yield differentials narrowed sharply. Further technology losses accompanied by rising volatility and additional rate compression would increase the risk of forced unwinding.
In that environment, technical levels may count for little relative to the scale of positioning flows.
Nikkei breaks beneath key support zone
Source: TradingView
Our Nikkei 225 contract is sitting just beneath the 200-day moving average, marking the bottom of a broader support zone comprising the Liberation Day uptrend from the April low last year, horizontal support at 62,714, the September 14 low, and the moving average itself. This was the zone flagged in Tuesday’s analysis.
RSI (14) is showing building downside pressure but is not yet oversold, a message reinforced by MACD, which has staged a bearish crossover and turned negative. Just as the index is breaking these key levels, downside momentum is building, increasing the risk of a further unwind towards 60,433, the July 29 swing low, followed by 60,000, which has previously acted as both resistance and support. Beyond that, 58,500 is another level of note should the selling accelerate.
Overhead, the 200-day moving average is the first hurdle, followed by 62,714 and the Liberation Day uptrend, currently around 63,300. Reclaiming the top of that zone would reduce the risk of an extension of the current bearish unwind.
As part of the broader AI sentiment trade, alongside South Korea’s KOSPI, the Nikkei’s price action may also provide an early indication of whether the selling pressure could extend into European and US trade later Friday.
USD/JPY breaks lower
Source: TradingView
USD/JPY has also broken lower, slipping beneath 156.68, a level that attracted bids on each of its previous three tests. Today’s attempt to reclaim it has so far been rejected, keeping the focus on 155.50, the top of a broader support zone extending down to 155.00. That area absorbed selling pressure during intervention episodes earlier this year.
A back test and rejection of 156.68 could allow shorts to be established with a tight stop above the level for protection. RSI (14) is moving further beneath 50, while MACD has staged a bearish crossover and turned negative, supporting the bearish price action. A sustained reclaim of 156.68 would weaken the immediate case for further downside.
Latest market news











Web Trader platform
Our sophisticated web-based platform is packed with features.
Open an account today
Experience award-winning platforms with fast and secure execution.
Economic calendar
Related articles

Gold and S&P 500 analysis: What now after Warsh’s hawkish speech?
The dollar surged across the board after the Fed Chair Kevin Warsh surprised with a hawkish-leaning speech at the Jackson Hole summit. All the bearish dollar bets that had been accumulated since last Friday on the back of data weakness and bond market troubles had to be squared and that triggered a short squeeze rally for the dollar. Gold and silver dropped, as a result, as too did bitcoin, while US indices were giving back earlier gains.


EUR/USD forecast: All eyes on Warsh at Jackson Hole - Forex Friday
For much of this week, the EUR/USD has been edging lower with the US dollar regaining some ground after last week’s sell-off that was triggered, in part, by the bond market worries. Investors have been unwilling to bet further against the US dollar so far this week ahead of Kevin Warsh’s keynote speech at the Jackson Hole summit, due later today.

Bitcoin Forecast: BTC/USD Back to $80K Ahead of Warsh’s Jackson Hole Speech
After surging over $15,000 in the past 10 days alone, there is risk of a near-term pullback if Warsh says anything remotely hawkish at Jackson Hole - what are the levels to watch from here?
