


USDJPY, Gold Price Outlook: Stronger US Dollar Pressures Gold as USDJPY Tests 160 Resistance
USDJPY, Gold Price Outlook: Gold prices remain under pressure below key resistance as a stronger US dollar challenges the precious metal's recovery. Meanwhile, USDJPY tests the critical 160 resistance zone ahead of US CPI data and BOJ policy developments.
Written by
Razan Hilal
Market Analyst
Gold prices remain under pressure as US dollar strength weighs on the metal's fragile recovery. A cautious outlook persists for gold below the 4,360 resistance level and beneath a multi-month trendline extending from the March 2026 highs. At the same time, USDJPY is approaching a critical resistance zone that could determine its next major directional move.
These scenarios were discussed during my daily MENA Call webinars, covering commodities, indices, cryptocurrencies, and UAE equities.
Register for the next webinar here: Registration
Key Events to Watch
- Summer liquidity risks and their interaction with ongoing Middle East geopolitical tensions.
- Key US economic data releases, particularly tomorrow's US CPI report, with expectations pointing to inflation rising toward 4.2%, and the implications for Federal Reserve policy expectations and Treasury yields.
- The Bank of Japan's monetary policy outlook and intervention risks as USDJPY approaches the multi-decade resistance zone between 160.00 and 163.00 once again.
Key Levels to Watch
Gold
- Resistance: 4,360
- Support: 4,270
USDJPY
- Resistance: 160.00–163.00
- Support: 158.00
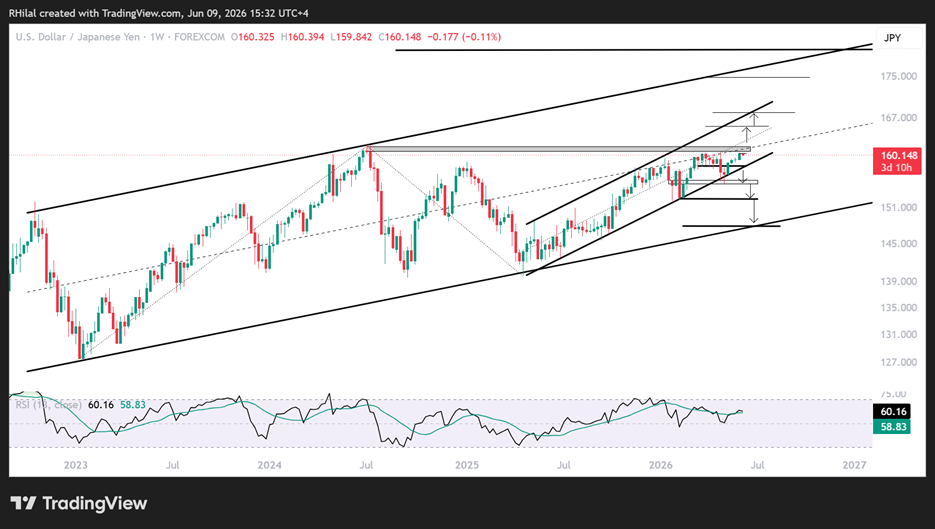
USDJPY Price Outlook: Weekly Time Frame – Log Scale
Source: Trading view
From a weekly perspective, USD/JPY has maintained a bullish structure since 2022, respecting the boundaries of a long-term ascending channel while also trading within a shorter-term one-year rising channel that continues to define the pair’s directional bias.
The pair is now challenging the key psychological and multi decade resistance zone at 160-163.
A sustained breakout above 160 could open the door toward 161.30 and 163.20, representing the channel midpoint and a major resistance zone that capped gains in 2024. A successful break above this region would expose the upper boundary of the long-term channel near 165.00 and 168.00.
Beyond that, the longer-term projection points toward 180.00. However, the probability of BOJ intervention is likely to increase significantly as price approaches these levels. Momentum indicators are already showing signs of bearish divergence against price action, suggesting that upside momentum is beginning to slow.
The lower boundary of the one-year ascending channel remains the key support level to monitor.
On the downside, a break below 158.00 and the lower boundary of the one-year rising channel would increase the risk of a deeper correction toward 155.00 and 152.00. A move below these levels would expose the long-term channel support near 147.00.
Gold Price Outlook: Daily Time Frame – Log Scale

Source: Trading view
Latest video on Gold: Dollar Strength Weighs on Gold and Silver
Gold's bearish bias remains visible on the daily chart as price action continues to struggle below the descending trendline connecting the lower highs formed since March 2026. This keeps the bearish outlook intact and aligns with the daily RSI's breakdown below its multi-month triangle pattern, increasing the risk of another decline toward yearly oversold conditions.
From a price action perspective, resistance remains concentrated below 4,360, while 4,270 serves as the key support level.
Bearish Scenario
A breakdown below 4,270 would increase the risk of a deeper decline toward 4,180 and 4,080. These levels will be important in determining whether gold can establish another bullish rebound or extend losses toward the 3,800 region, where longer-term dip-buying opportunities may emerge once again.
Bullish Scenario
A sustained breakout above the multi-month trendline resistance and the 4,360 level would expose gold to the next resistance zones at 4,400, 4,440, and 4,530.
A successful move through these levels would shift attention toward 4,600 and 4,780, where bullish momentum would face another major sustainability test. A sustained breakout above these areas would significantly improve bullish confidence and reopen the path toward the 4,900–5,000 zone.
Following two years of exceptional gains, gold appears to be entering a period of consolidation. Such phases are common after strong trends and may continue until momentum realigns with the potential for another significant upside move.
Written by Razan Hilal, CMT
Follow on X: @Rh_waves








Web Trader platform
Our sophisticated web-based platform is packed with features.
Open an account today
Experience award-winning platforms with fast and secure execution.
Economic calendar
Related articles

Euro Short-term Outlook: EUR/USD Pullback Nears Pivotal Uptrend Support 8 28 2026
Warsh's comments accelerated the EUR/USD selloff, raising the stakes as buyers look to stabilize the broader recovery.

AUD/CAD breakout puts the Bradman barrier in sight
A bullish breakout has pushed AUD/CAD to its highest level since early 2021. Whether it can clear 0.9994 may determine if the move extends well above parity.


Australian Dollar Forecast: AUD/USD Breakout Rally Nears Pivotal Resistance 8 27 2026
Aussie has advanced in eight of the past nine weeks, but the next technical hurdle could determine whether bulls can sustain the broader advance.