


ASX 200 Evening Wrap: CBA Drags Index Lower as Financials Buckle
ASX 200 slipped as CBA tumbled 6% after its earnings report, offsetting gains in Energy and Utilities. Financials weighed on the broader market.
Written by
Matt Simpson
Market Analyst
The ASX 200 closed modestly lower on Wednesday, dragged down by a sharp fall in Commonwealth Bank (CBA) after its quarterly earnings failed to satisfy investors. While Energy and Utilities extended their advance, the heavy losses across Financials kept the index under pressure. The reversal pattern on the daily chart reinforces the risk that the latest rebound is merely corrective within a broader downtrend.
View related analysis:
ASX 200 Market Snapshot
- The ASX 200 printed a shooting star candle below its 50-day EMA, with CBA weighing on the broader index after its earnings miss.
- The index closed down 0.2% despite 130 (65%) of its constituents advancing, while 7 of 11 sectors also finished higher.
- Trading volume rose to a four-day high, hinting at bearish initiation.
- The one-day reversal supports the view that any current rally is corrective within a larger downtrend.
- Utilities (XUJ) gained 1.7%, its best session in three months, and Energy (XEJ) climbed for a fourth day to a nine-week high.
- Financials (XFJ) fell 2% to a four-week low, dragged by CBA, even as the New Zealand dollar reached a record high.
- Woodside Energy (WDS) touched a 16-month high before closing on its September resistance at 26.53.
- ANZ Group (ANZ) notched another record high a day after announcing a cost-cutting plan.
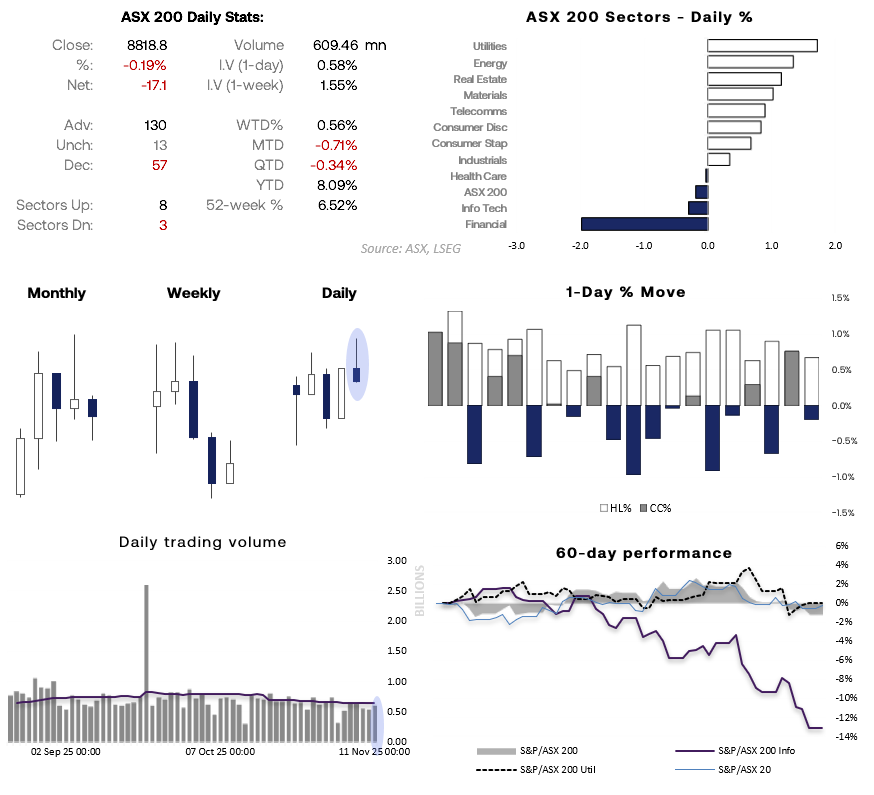
Chart analysis by Matt Simpson - source: ASX, LSEG
Commonwealth Bank (CBA) Plunges On Disappointing Earnings Beat
CBA reported a Q3 cash profit of A$2.6 billion, supported by growth in home loans, deposits, and credit quality, but the result failed to impress. Shares tumbled 6.3% by the close, with analysts warning FY26 profits may come under pressure from narrowing margins.

Commonwealth Bank (CBA) Technical Analysis
The daily chart shows a false break above the August high, followed by a 6.6% sell-off — CBA’s worst session in four years — signalling potential for a deeper retracement within its broader uptrend.
The weekly chart reveals a lower high and momentum accelerating toward the 50-week EMA, suggesting wave C of an ABC correction. A 100% projection of wave A–B from wave C aligns with the April VPOC near 152.20, marking it as a key bearish target.
If CBA — the ASX’s largest stock by market cap — continues to weaken, it could trigger further turbulence for the ASX 200. A broader breakdown across Financials remains a risk theme worth monitoring.
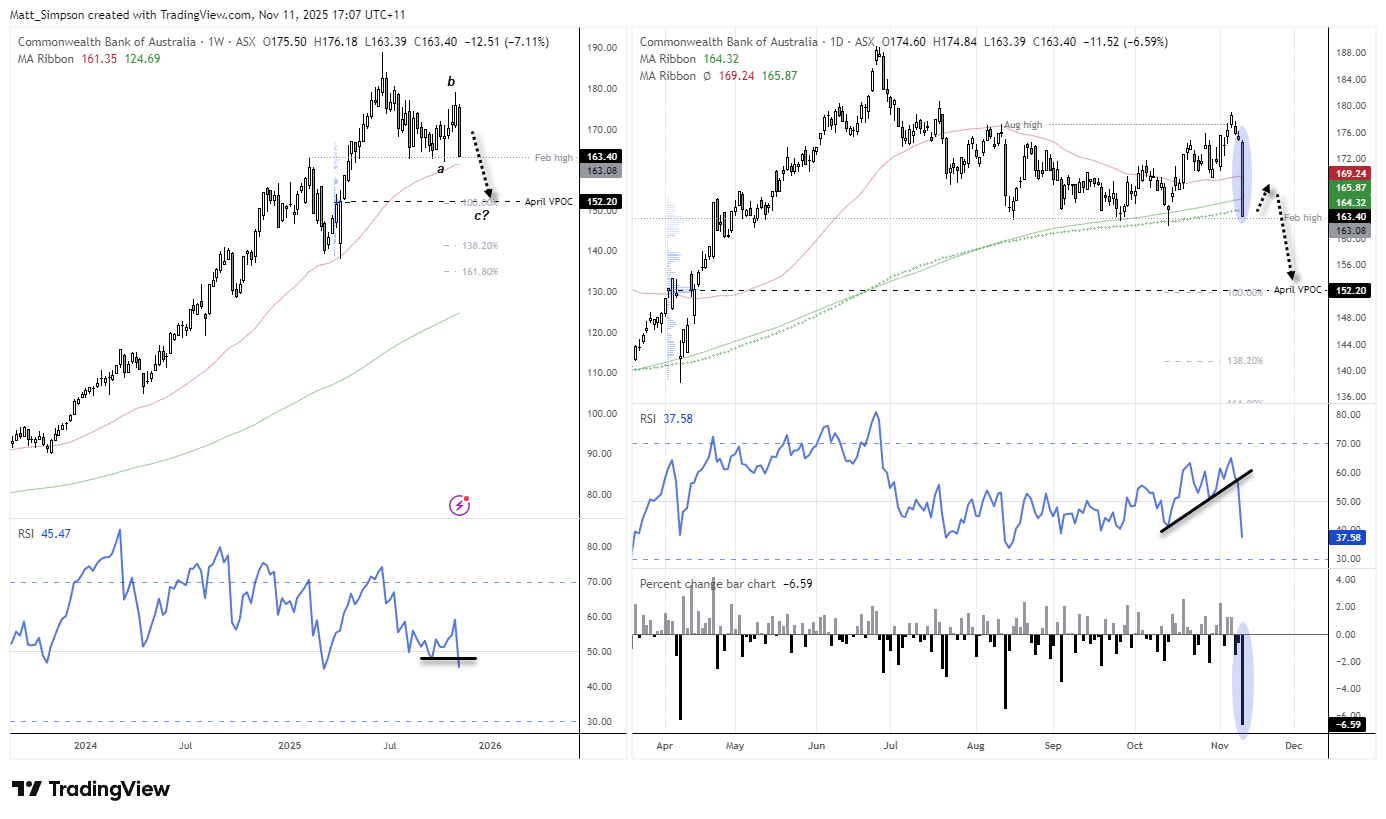
Chart analysis by Matt Simpson - Source: TradingView
View the full economic calendar
-- Written by Matt Simpson
Follow Matt on Twitter @cLeverEdge
How to trade with City Index
You can trade with City Index by following these four easy steps:
- Open an account, or log in if you’re already a customer
• Open an account in the UK
• Open an account in Australia
• Open an account in Singapore
- Search for the market you want to trade in our award-winning platform
- Choose your position and size, and your stop and limit levels
- Place the trade
Related tags:







Web Trader platform
Our sophisticated web-based platform is packed with features.
Open an account today
Experience award-winning platforms with fast and secure execution.
Economic calendar
Related articles

Gold and S&P 500 analysis: What now after Warsh’s hawkish speech?
The dollar surged across the board after the Fed Chair Kevin Warsh surprised with a hawkish-leaning speech at the Jackson Hole summit. All the bearish dollar bets that had been accumulated since last Friday on the back of data weakness and bond market troubles had to be squared and that triggered a short squeeze rally for the dollar. Gold and silver dropped, as a result, as too did bitcoin, while US indices were giving back earlier gains.


Jackson Hole Returns: Nikkei 225 and Nasdaq 100 Volatility in Focus
Historical Jackson Hole returns point to elevated Nikkei 225 volatility around Fed speech day, with Nasdaq 100 direction hinging on Kevin Warsh.

AUD/USD, ASX 200: Household Spending Bolsters RBA Hike Bets
Australian household spending strengthened again in July, adding to inflation and construction data supporting a September RBA hike.