


ASX 200 Market Outlook: Tech Rout Deepens, Financials Slide, ANZ Reverses
Tech and bank stocks drag the ASX 200 into its worst three-week stretch in eight months as ANZ signals a bearish reversal.
Written by
Matt Simpson
Market Analyst
The ASX 200 heads into the new week under heavy pressure after a Nasdaq-driven selloff and a hotter Australian jobs report wiped out hopes of an RBA rate cut before mid-2026. Tech and financials led the damage, while ANZ — one of the year’s strongest bank performers — has now reversed sharply from record highs. SPI 200 futures held the August low on Friday night, hinting at a short-term bounce, but the broader trend remains firmly bearish.
View related analysis:
ASX 200 Outlook: Tech Weakness Builds as Banks Extend Losses
ASX 200 Market Snapshot
A Nasdaq-led selloff on Wall Street and a hotter-than-expected Australian jobs report weighed heavily on sentiment, with traders now pushing out any realistic chance of an RBA cut until mid-2026.
- The ASX 200 cash market fell for a fourth straight session on Friday, delivering its most volatile and bearish day in 10 weeks.
- It also locked in a third consecutive weekly decline, with the past three weeks marking the worst run in eight months at -4.2%.
- Technology (XIJ) was the weakest sector last week, sliding -9.4%, with nearly half of that decline (-4.4%) happening on Friday alone. Financials (XFJ) dropped -4.9%, its worst weekly performance in 33 weeks.
- Real Estate stocks (XRE) fell -2.6% last week to mark its third weekly decline and near a 6-month low
- Mondays have produced an average high-to-low range of 77.9 points in the ASX cash session over the past year — or 79 points over the past three months.
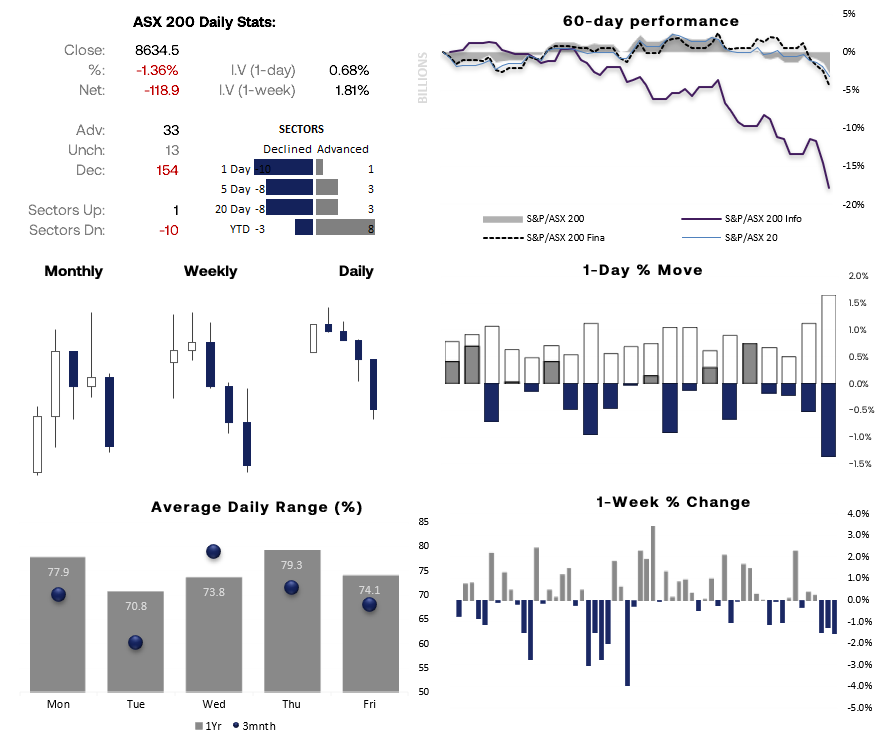
Chart analysis by Matt Simpson - source: ASX, LSEG
ASX 200 Correlations
- Technology weakness linked to the unwinding AI bubble and the Nasdaq’s decline is clearly weighing on the ASX 200, with the 10- and 20-day correlations now above 0.8.
- Financials are also moving almost in lockstep with the index, with both short-term correlations sitting at or above 0.8.
- Interestingly, the Materials sector (XMJ) holds a mildly inverse correlation with the ASX 200. As the second-largest sector, that slight counter-movement has provided some support for the broader index.
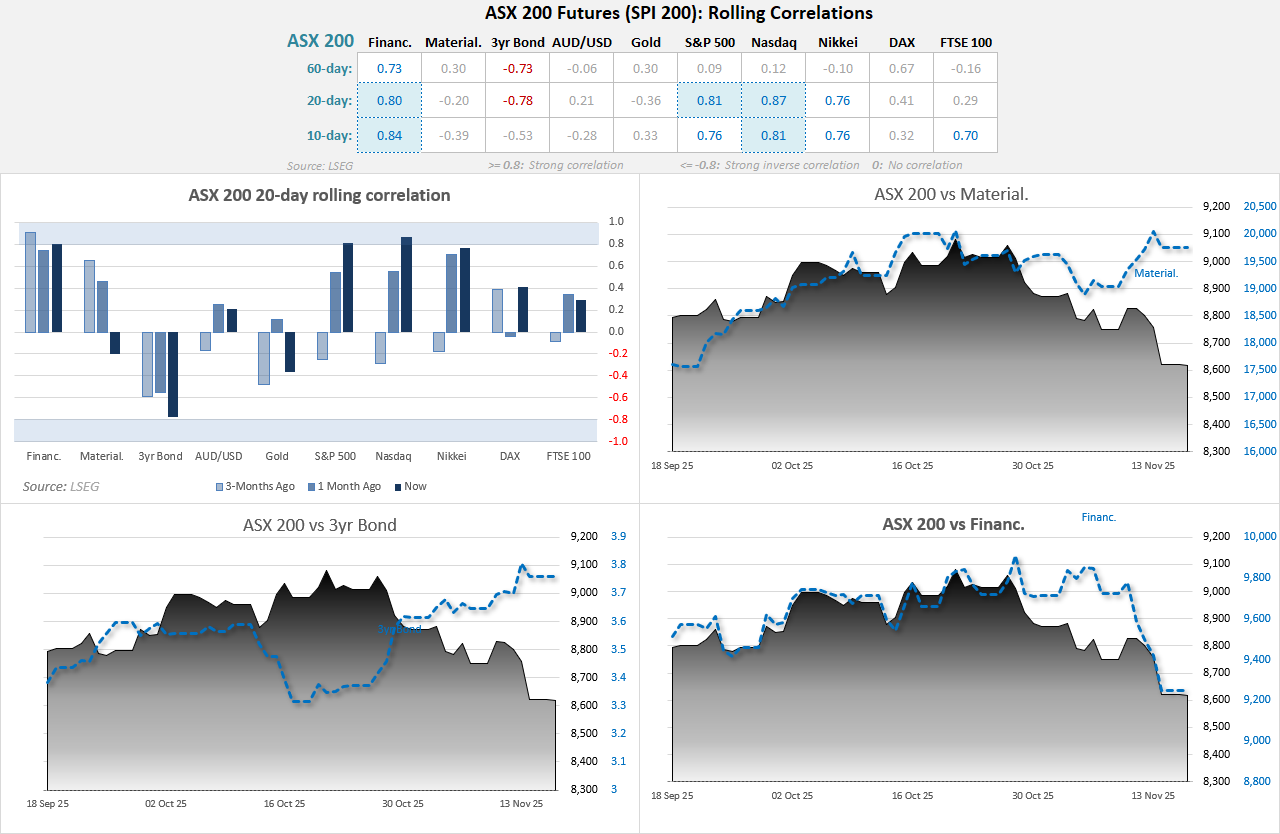
Chart analysis by Matt Simpson - source: ASX, LSEG

ANZ Group (ANZ) Technical Analysis
A prominent shooting-star candle formed at ANZ’s record high last week, flagging the risk of a pullback. Despite closing the week effectively flat at -0.07%, it was the bank’s most volatile week in 38. The weekly high also stalled at the monthly pivot point, and price action looks stretched from the 10- and 20-day EMAs — all pointing toward possible mean reversion.
ANZ fell -5.3% across Thursday and Friday, its sharpest two-day decline since April. Support emerged around $36 and a high-volume node from a previous consolidation. A bearish divergence has also appeared on the daily RSI(14).
Given ANZ has been one of the strongest performers among the big four banks this year, any meaningful pullback could weigh on the broader Financials sector and the ASX 200.
Bears may look to fade minor rallies into gap resistance at 36.94, anticipating a break below the 35.17 swing low or the monthly pivot at 34.96. A downside target sits near $33 — aligned with the 38.2% Fibonacci retracement and just beneath the 33.36 swing high.


Chart analysis by Matt Simpson - Source: TradingView
ASX 200 Futures (SPI 200) Technical Analysis
The ASX weakened further on Friday night during the US session, with SPI 200 futures retesting the August low. It held above that level into the close, and with Wall Street recovering part of its losses, the setup allows for a short-term bounce.
Bearish momentum also stalled just beneath the 200-day EMA, while the futures contract continues to hold above the 200-day SMA. That combination can support a brief retracement higher before the next leg lower. My broader bias remains bearish, so the preference is to fade into lower highs in anticipation of a move toward 8400.
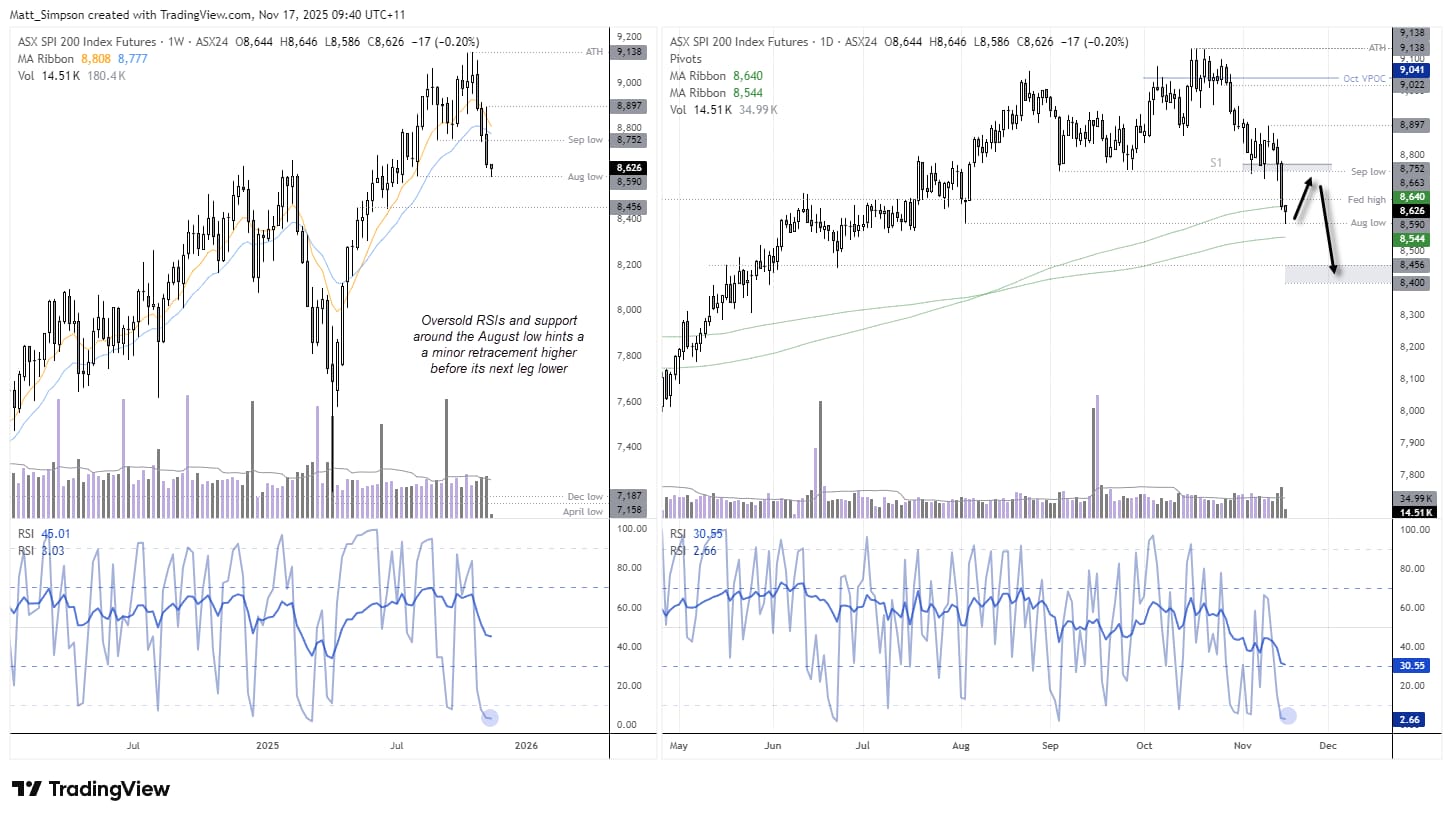
Chart analysis by Matt Simpson - Source: TradingView, ASX SPI 200 Index Futures

View the full economic calendar
-- Written by Matt Simpson
Follow Matt on Twitter @cLeverEdge
How to trade with City Index
You can trade with City Index by following these four easy steps:
- Open an account, or log in if you’re already a customer
• Open an account in the UK
• Open an account in Australia
• Open an account in Singapore
- Search for the market you want to trade in our award-winning platform
- Choose your position and size, and your stop and limit levels
- Place the trade







Web Trader platform
Our sophisticated web-based platform is packed with features.
Open an account today
Experience award-winning platforms with fast and secure execution.
Economic calendar
Related articles

Gold and S&P 500 analysis: What now after Warsh’s hawkish speech?
The dollar surged across the board after the Fed Chair Kevin Warsh surprised with a hawkish-leaning speech at the Jackson Hole summit. All the bearish dollar bets that had been accumulated since last Friday on the back of data weakness and bond market troubles had to be squared and that triggered a short squeeze rally for the dollar. Gold and silver dropped, as a result, as too did bitcoin, while US indices were giving back earlier gains.


Jackson Hole Returns: Nikkei 225 and Nasdaq 100 Volatility in Focus
Historical Jackson Hole returns point to elevated Nikkei 225 volatility around Fed speech day, with Nasdaq 100 direction hinging on Kevin Warsh.

AUD/USD, ASX 200: Household Spending Bolsters RBA Hike Bets
Australian household spending strengthened again in July, adding to inflation and construction data supporting a September RBA hike.