


ASX 200 Morning Market Outlook: Bearish Reversal Pattern For October
The ASX 200 posted its most bearish week in 30, with reversal signals on monthly and weekly charts hinting that a market top may be forming.
Written by
Matt Simpson
Market Analyst
The ASX 200 recorded its sharpest weekly fall in 30 weeks, led lower by Health Care, Technology and Consumer Discretionary stocks. October’s shooting star and last week’s bearish engulfing candle strengthen the case for a reversal, though oversold signals suggest a short-lived rebound may occur before further weakness unfolds.
View related analysis:
- Australian Dollar Outlook: RBA, US ISM and ADP In Focus
- ASX 200 Morning Market Outlook: Sectors Highlight Structural Weakness
- ASX 200 Morning Market Outlook: Woolworths (WOW) Set To Bounce?
- ASX 200 Morning Market Outlook: Westpac (WBC) Leads Big 4 Lower Post-CPI
- ASX 200 Morning Market Outlook: CSL Plunge Drags ASX lower
ASX 200 Signals Market Top As October Reversal Pattern Forms
ASX 200 Market Snapshot
- It was the most bearish week in 30 for the ASX 200 cash market, with Health Care (XHJ), Information Technology (XIJ) and Consumer Discretionary leading the way lower.
- Only the Energy (XEJ) and Consumer Staples (XSJ) sectors advanced last week.
- Bearish reversal candles formed on the ASX 200 monthly and weekly charts, with a shooting star in October and a bearish engulfing pattern last week.
- Bearish clues from ASX internals suggest the broader index has topped out, and the bias remains to fade into rallies.
- An inverted hammer on Friday suggests bearish momentum is waning over the near term, bringing the potential for a small countertrend bounce before anticipated losses resume.
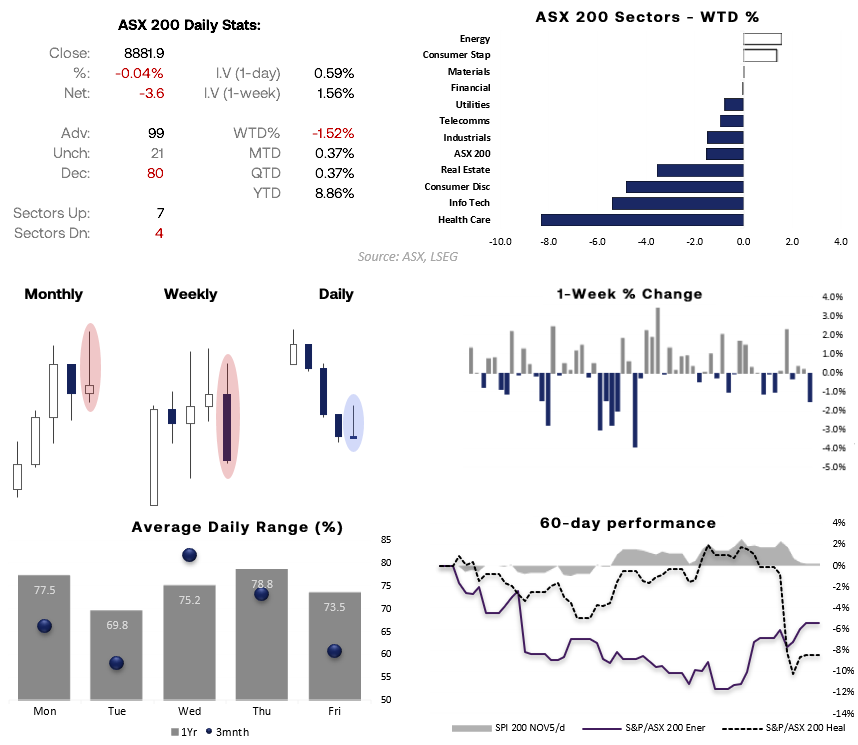
Chart analysis by Matt Simpson - source: ASX, LSEG

ASX 200 Futures (SPI 200) Technical Analysis
The monthly chart shows a bearish RSI (14) divergence alongside a shooting star candle, warning of a potential reversal lower. The ASX 200 futures market fell for a fifth consecutive day, though bearish momentum is clearly waning with an inverted pinbar and spinning top doji forming on Thursday and Friday.
The ASX has closed only 13 points lower over the past two days while the RSI (2) remains deeply oversold at 4.7. With last week finding support around the September VPOC (8,852) and 8,862 low, bulls may be on guard for a minor rebound towards the 50-day SMA (8,394) or 8,590 low. Should prices break above these levels, bears could look to fade rallies towards 9,000 in anticipation of a move down to the September low (8,752) — a break beneath which would assume a deeper correction.
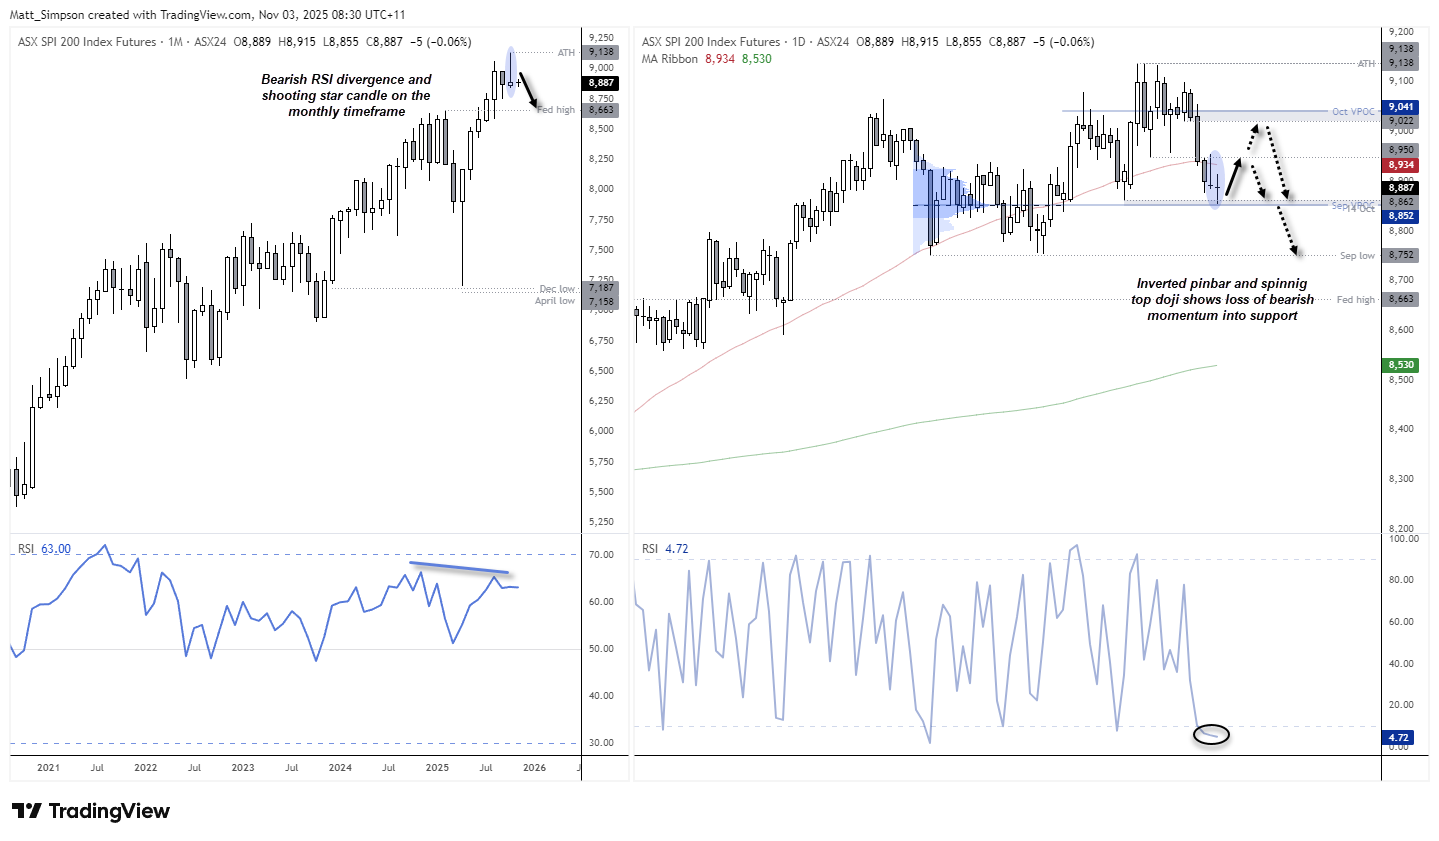
Chart analysis by Matt Simpson - Source: TradingView, ASX SPI 200 Index Futures
View the full economic calendar
-- Written by Matt Simpson
Follow Matt on Twitter @cLeverEdge
How to trade with City Index
You can trade with City Index by following these four easy steps:
- Open an account, or log in if you’re already a customer
• Open an account in the UK
• Open an account in Australia
• Open an account in Singapore
- Search for the market you want to trade in our award-winning platform
- Choose your position and size, and your stop and limit levels
- Place the trade
Related tags:







Web Trader platform
Our sophisticated web-based platform is packed with features.
Open an account today
Experience award-winning platforms with fast and secure execution.
Economic calendar
Related articles

Gold and S&P 500 analysis: What now after Warsh’s hawkish speech?
The dollar surged across the board after the Fed Chair Kevin Warsh surprised with a hawkish-leaning speech at the Jackson Hole summit. All the bearish dollar bets that had been accumulated since last Friday on the back of data weakness and bond market troubles had to be squared and that triggered a short squeeze rally for the dollar. Gold and silver dropped, as a result, as too did bitcoin, while US indices were giving back earlier gains.


Jackson Hole Returns: Nikkei 225 and Nasdaq 100 Volatility in Focus
Historical Jackson Hole returns point to elevated Nikkei 225 volatility around Fed speech day, with Nasdaq 100 direction hinging on Kevin Warsh.

AUD/USD, ASX 200: Household Spending Bolsters RBA Hike Bets
Australian household spending strengthened again in July, adding to inflation and construction data supporting a September RBA hike.