


ASX 200 Outlook: 9,000 Support Faces Rising Yield Pressure
The ASX 200 faces fresh pressure from rising bond yields, with 9,000 shaping up as a key support zone while options positioning points to 9,100 as the main near-term magnet.
Written by
Matt Simpson
Market Analyst
The ASX 200 enters Friday under pressure as rising US bond yields weigh on global risk sentiment. SPI futures have held up better than Wall Street so far, but the options profile offers little obvious downside protection beneath the market.
That puts 9,000 and nearby technical support firmly in focus, while 9,100 remains the main options magnet should sentiment stabilise. A sustained break lower could expose 8,900, while rebounds may struggle to gain traction unless bond yields retreat.
View related analysis:
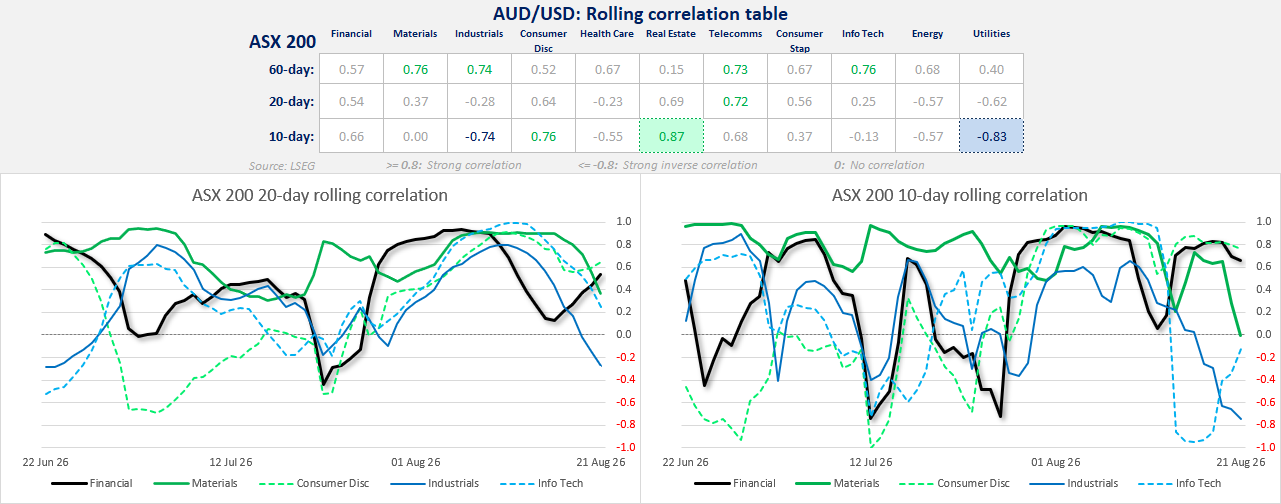
ASX 200 Correlations Point to Choppy Sector Rotation
- It is unusual to see so few ASX sectors with correlations above 0.8 or below -0.8, pointing to a more fragmented market backdrop.
- That suggests choppier index-level price action, which may favour range-trading over chasing large directional swings unless a fresh catalyst emerges.
- Real Estate (+0.87) and Consumer Discretionary (+0.76) are the strongest short-term positive relationships, while Utilities (-0.83) and Industrials (-0.74) are moving most clearly the other way.
- The sharp differences between the 10-day and 20-day readings also suggest sector leadership is rotating quickly rather than trending cleanly.
Source: ASX, LSEG
ASX 200 Technical Analysis
ASX 200 Options Point to 9,100 Magnet, 9,150 Ceiling
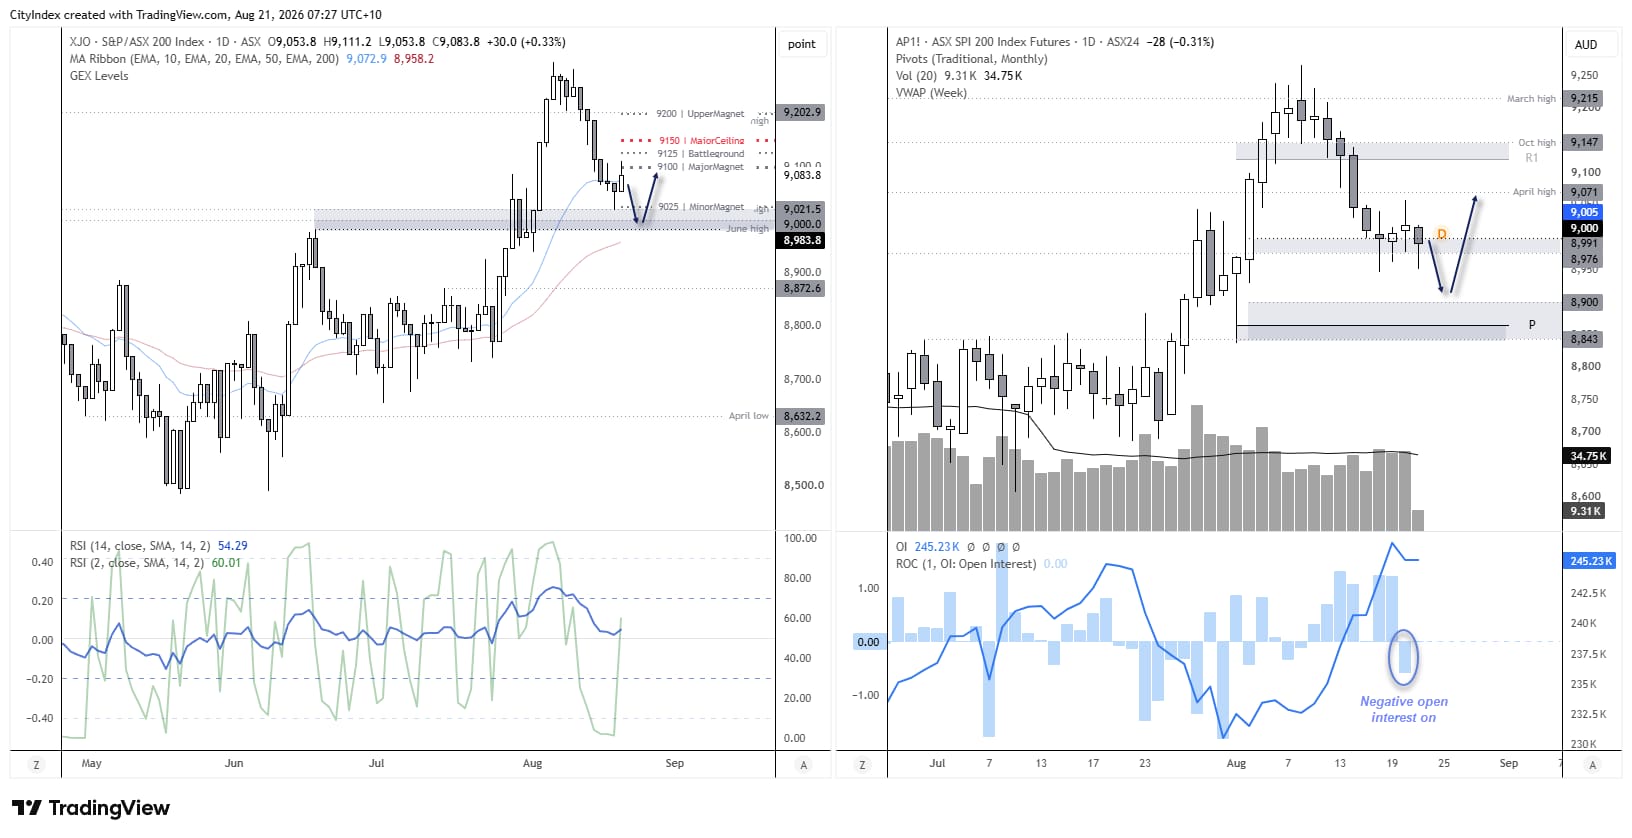
The options profile puts 9,100 at the centre of the near-term range, with relatively balanced call and put open interest making it the main magnet. 9,125 is another balanced area that could encourage choppy trade, while 9,150 stands out as the clearest gamma ceiling due to the heavier call positioning.
The notable feature is what sits below the market: there is no obvious put-heavy gamma floor nearby. That means options positioning offers less protection if the ASX breaks lower, even though technical support around the 50-day EMA and April high may still attract buyers. With SPI futures weaker after another risk-off session, a break below nearby technical support could therefore carry more weight than usual.

ASX 200 Support Levels in Focus as Yields Rise
Note potential technical support for the ASX 200 cash market around the April high (9,021), 9,000 handle, June high (8,938) and 50-day EMA (8,958.2) should sentiment truly sour. The fact SPI futures did not roll over alongside Wall Street provides some hope that any initial selloff today could fare better than the Dow Jones or S&P 500.
Still, the options profile offers little obvious downside protection, with no clear gamma floor beneath the market. Rising futures open interest during the recent decline also suggests traders have been adding exposure as prices fell. While 9,100 remains an important options magnet should sentiment stabilise, the prospects of a stronger rebound may depend on whether US Treasury intervention can prevent another leg higher in bond yields.
Source: ASX, TradingView
- 9,100 is the main options magnet, with 9,150 the clearest gamma ceiling.
- No obvious gamma floor sits below, leaving less options support if selling accelerates.
- Cash support sits around 9,021, 9,000 and 8,958–8,938.
- SPI resilience offers some hope, but higher US yields remain the key downside risk.
ASX 200 Bears Eye 9,000 as Downside Risks Build
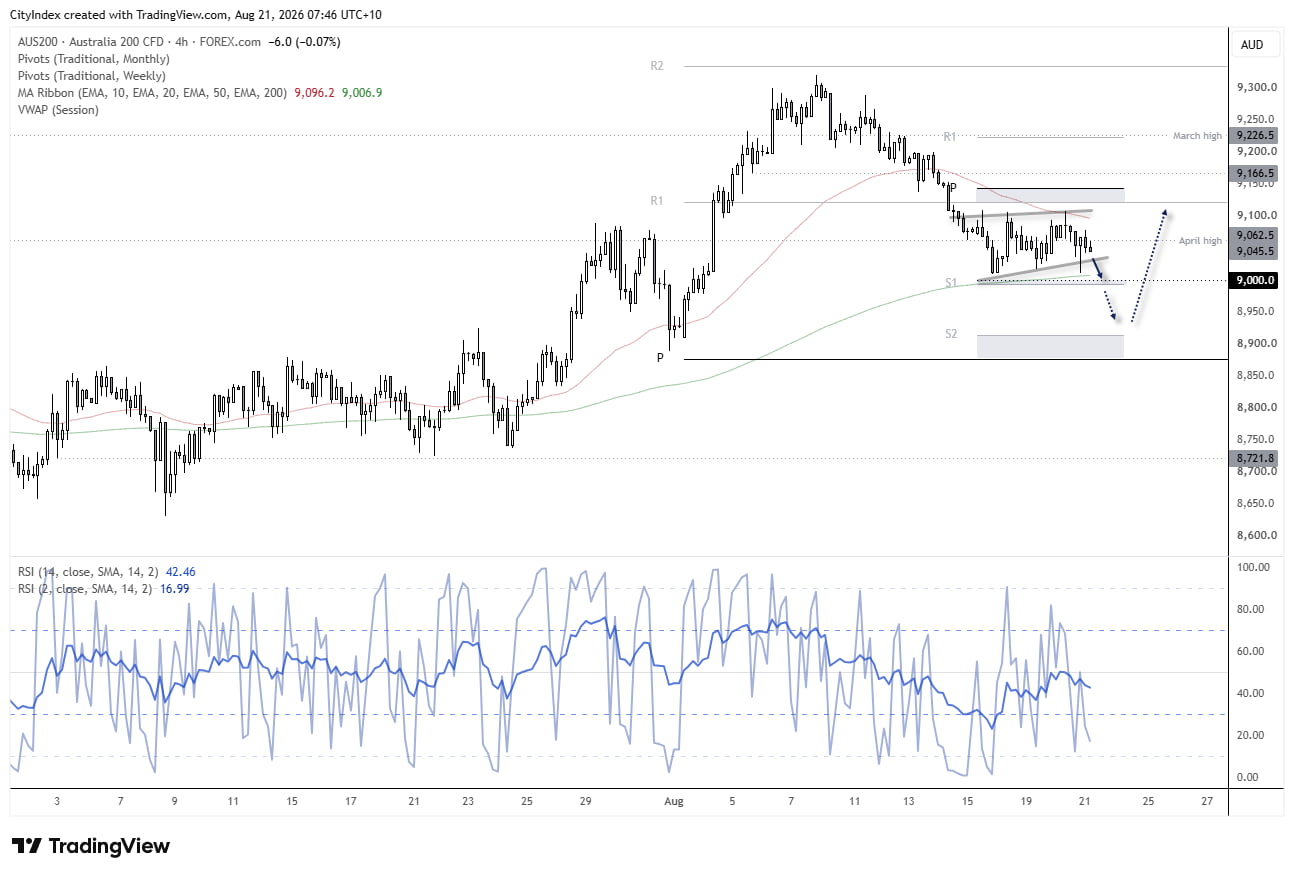
The 4-hour chart shows a gradual downtrend and potential bearish consolidation. The 200-bar EMA is providing support for now, with a bullish pin bar also signalling demand around these levels.
A break beneath the weekly pivot would also clear 9,000 and bring 8,900 into focus. Given the ASX 200’s ability to withstand the weak lead from Wall Street so far, I suspect the downside could remain relatively limited compared with the Dow Jones and S&P 500.
However, any bounce from support may also remain capped, with the 9,100 options cluster coming back into view if bulls regain control.
Source: ASX, TradingView
View the full economic calendar
-- Written by Matt Simpson
Follow Matt on Twitter @cLeverEdge
How to trade with City Index
You can trade with City Index by following these four easy steps:
- Open an account, or log in if you’re already a customer
• Open an account in the UK
• Open an account in Australia
• Open an account in Singapore
- Search for the market you want to trade in our award-winning platform
- Choose your position and size, and your stop and limit levels
- Place the trade
Related tags:
Latest market news










Web Trader platform
Our sophisticated web-based platform is packed with features.
Open an account today
Experience award-winning platforms with fast and secure execution.
Economic calendar
Related articles

Gold and S&P 500 analysis: What now after Warsh’s hawkish speech?
The dollar surged across the board after the Fed Chair Kevin Warsh surprised with a hawkish-leaning speech at the Jackson Hole summit. All the bearish dollar bets that had been accumulated since last Friday on the back of data weakness and bond market troubles had to be squared and that triggered a short squeeze rally for the dollar. Gold and silver dropped, as a result, as too did bitcoin, while US indices were giving back earlier gains.


EUR/USD forecast: All eyes on Warsh at Jackson Hole - Forex Friday
For much of this week, the EUR/USD has been edging lower with the US dollar regaining some ground after last week’s sell-off that was triggered, in part, by the bond market worries. Investors have been unwilling to bet further against the US dollar so far this week ahead of Kevin Warsh’s keynote speech at the Jackson Hole summit, due later today.

Nasdaq 100 forecast: Tech stocks shine as Nvidia results underpin AI trade
Much of this week’s attention has been on Nvidia’s earnings, and the chipmaker delivered the sort of numbers of investors had been hoping for. US index futures initially wobbled before moving higher overnight, with the results providing a fresh lift to the AI trade