


Australian Dollar Short-term Outlook: AUD/USD 3% Plunge Puts Multi-Month Range at Risk
A sharp equity-led selloff has driven AUD/USD toward critical June-low support, with strong NFP data adding pressure ahead of next week’s U.S. CPI.
Written by
Michael Boutros
Sr. Technical Strategist
Australian Dollar Technical Outlook: AUD/USD Short-term Trade Levels
- AUD/USD has surrendered its late-October recovery after stalling at the 200-day moving average, with renewed selling pressure driving Aussie toward major support.
- The October uptrend has broken, leaving bulls defending a critical support confluence near the June low and the lower boundary of the broader consolidation.
- A decisive daily close below this threshold would strengthen the bearish outlook and expose a deeper correction toward the next major downside objectives.
- A sustained recovery above the near-term downtrend resistance needed to suggest a more significant low is in place.
- Stronger-than-expected U.S. employment data has reinforced Fed tightening expectations despite the RBA's latest rate hike, shifting attention to next week's U.S. inflation releases.
- Resistance 6904, 6954 (key), 7000- Support 6855/65, 6800, 6757 (key)
The Australian Dollar has come under renewed pressure after last month's recovery stalled at the 200-day moving average, triggering a sharp reversal that has brought AUD/USD back toward a major technical inflection zone. The break of the October uptrend has weakened the near-term outlook, although the latest decline is approaching a key support confluence where selling pressure could begin to ease. Friday's stronger-than-expected U.S. Nonfarm Payrolls report has added to the pressure on Aussie despite this week's RBA rate hike, reinforcing expectations for further Fed tightening. Attention now turns to next week's U.S. CPI and PPI reports, with the reaction in Treasury yields and the dollar likely to influence whether AUD/USD can stabilize or comes under further pressure heading into mid-November. Battle lines drawn on the Aussie short-term technical charts.
Australian Dollar Price Chart – AUD/USD Daily
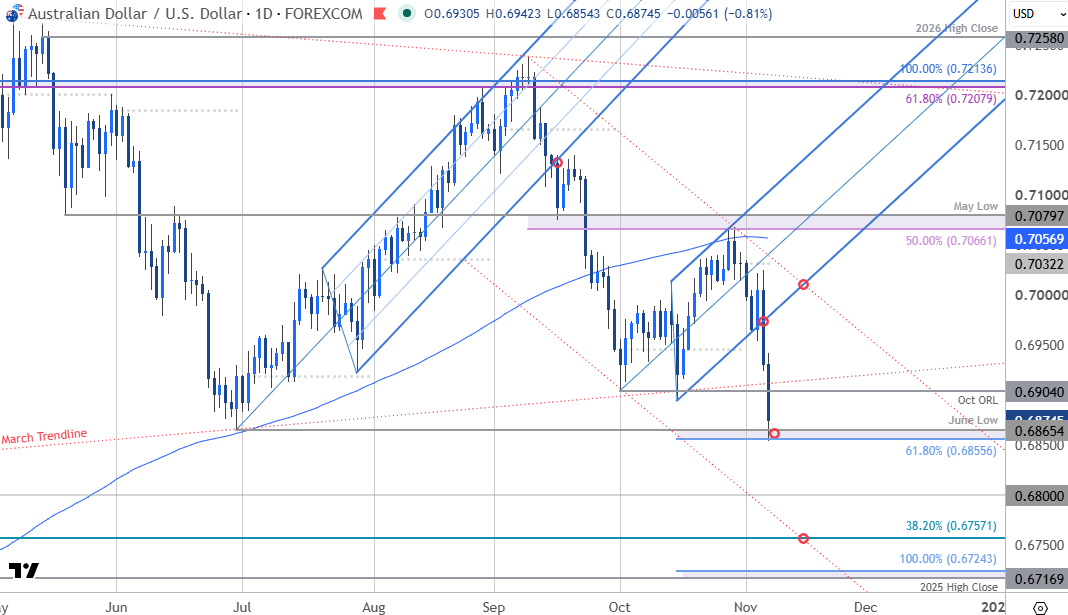
Chart Prepared by Michael Boutros, Sr. Technical Strategist; AUD/USD on TradingView
Technical Outlook: The Australian Dollar has been trading within a massive multi-month consolidation pattern since the yearly high was registered in May. The breakout of the October opening range fueled a rebound of more than 2.5% off then monthly low before exhausting into the 50% retracement of the September decline. The 200-day moving average capped the close high late in the month with Aussie plummeting more than 3% into the November open.
The decline has broken the October uptrend with today’s loss now threatening to break below the lower bounds of the consolidation pattern at the March trendline. Weekly RSI has now dropped to the lowest levels since March of 2025 and keeps the momentum profile in favor of the bears for now. The post-NFP selloff was halted at initial support today at the 61.8% extension of the September decline and the June low at 6855/65 and the focus is on possible inflection off this zone in the days ahead with the risk still weighted to the downside.
Australian Dollar Price Chart – AUD/USD 240min
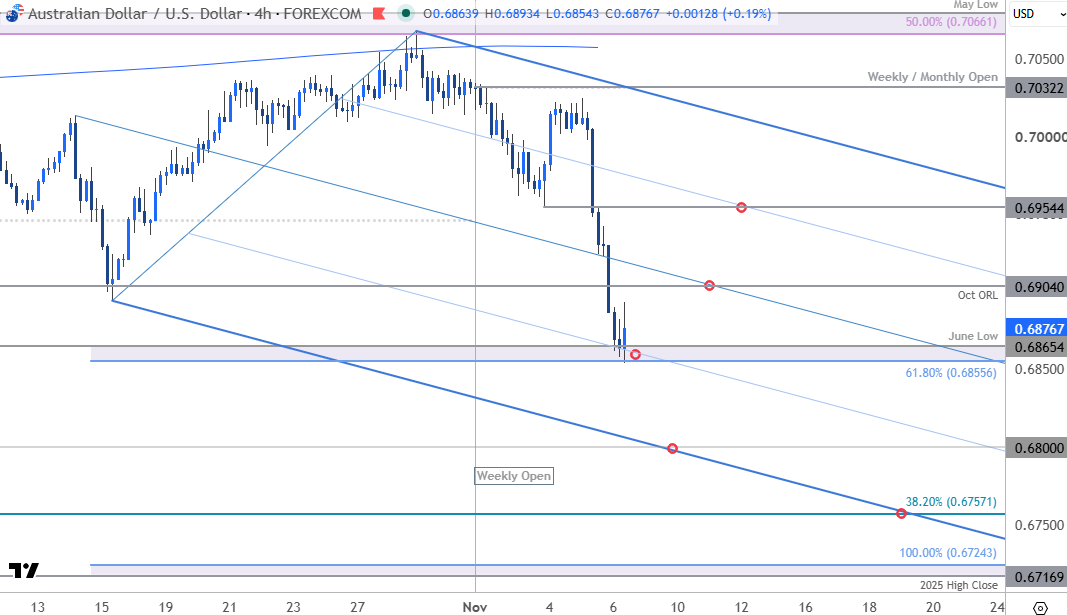
Chart Prepared by Michael Boutros, Sr. Technical Strategist; AUD/USD on TradingView
Notes: A closer look at Aussie price action shows AUD/USD trading within the confines of a descending pitchfork extending off the late-October high with the 25% parallel further highlighting near-term support at 6855/65. A break / daily close below this threshold is needed to fuel the next leg lower in price with subsequent support objectives eyed at the 6800 and the 38.2% retracement of the 2025 advance at 6757. Both levels of interest for possible downside exhaustion / price inflection IF reached. The next major technical consideration rests with the 2025 high-close and the 100% extension at 6717/24.
Initial resistance is now eyed at the October opening range low at 6904 which converges on the median line mid-week. Near-term bearish invalidation is now set to the election low at 6954 with a break above the upper parallel (currently near ~7000) needed to suggest a more significant low is in place, and a larger trend reversal is underway.
Bottom line: AUD/USD is attempting to break below a multi-month consolidation pattern with price now testing initial support near the June low. From a trading standpoint, rallies would need to be limited to 6954 IF price is heading lower on this stretch with a close below 6855 needed to fuel the next major leg of the decline.
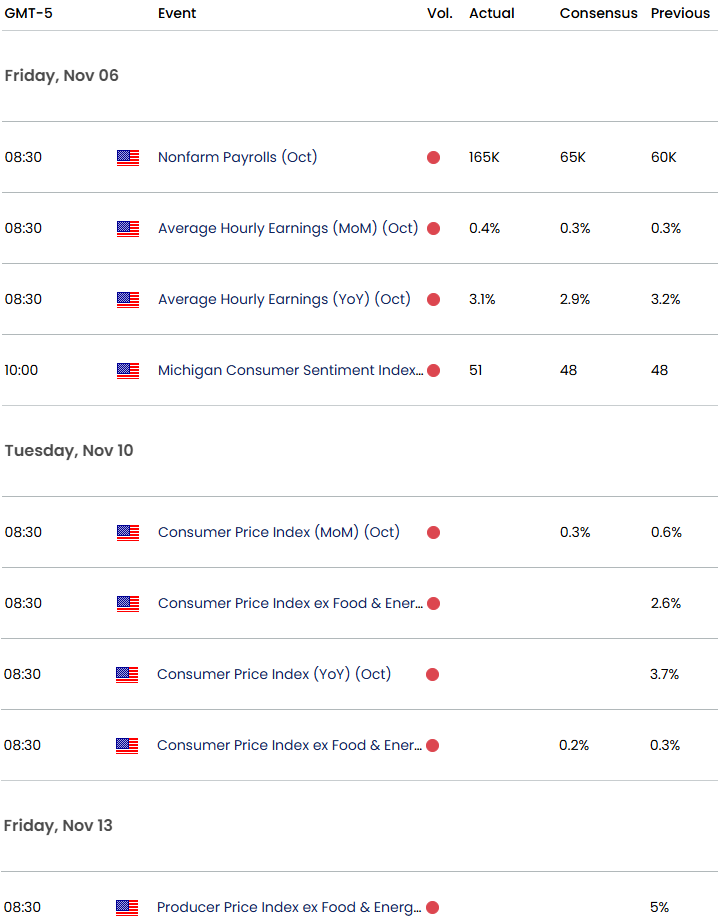
AUD/USD faces a pivotal week ahead, with U.S. inflation data taking center stage following the Reserve Bank of Australia's latest rate hike. The RBA raised rates by 25 basis points this week, reinforcing its commitment to containing inflation and keeping the prospect of further tightening alive. Meanwhile, today's stronger-than-expected U.S. Nonfarm Payrolls report has reinforced expectations for another Fed rate hike in December, adding to the pressure on the Aussie. Attention now shifts to Tuesday's U.S. Consumer Price Index (CPI) and Friday's Producer Price Index (PPI), with both releases likely to influence Fed rate expectations and the broader outlook for the U.S. dollar. Persistent price pressures could bolster Treasury yields and renew downside pressure on AUD/USD, while softer-than-expected inflation data could temper Fed rate-hike expectations and offer the Aussie an opportunity to stabilize. Stay nimble into the releases and watch the weekly close for guidance. Review my latest Australian Dollar Weekly Forecast for a closer look at the longer-term AUD/USD technical trade levels.
Key AUD/USD Economic Data Releases
Written by Michael Boutros, Senior Technical Strategist
Follow Michael on X @MBForex
Latest market news








Web Trader platform
Our sophisticated web-based platform is packed with features.
Open an account today
Experience award-winning platforms with fast and secure execution.
Economic calendar
Related articles

USD/JPY Weekly Outlook: AI earnings could overshadow the Fed and BoJ
AI sentiment has become a major driver of US Treasury yields and USD/JPY. With Microsoft, Alphabet and Amazon reporting this week, central bank decisions may have competition for traders' attention.


Gold and S&P 500 analysis: What now after Warsh’s hawkish speech?
The dollar surged across the board after the Fed Chair Kevin Warsh surprised with a hawkish-leaning speech at the Jackson Hole summit. All the bearish dollar bets that had been accumulated since last Friday on the back of data weakness and bond market troubles had to be squared and that triggered a short squeeze rally for the dollar. Gold and silver dropped, as a result, as too did bitcoin, while US indices were giving back earlier gains.


EUR/USD forecast: All eyes on Warsh at Jackson Hole - Forex Friday
For much of this week, the EUR/USD has been edging lower with the US dollar regaining some ground after last week’s sell-off that was triggered, in part, by the bond market worries. Investors have been unwilling to bet further against the US dollar so far this week ahead of Kevin Warsh’s keynote speech at the Jackson Hole summit, due later today.