

Bitcoin Forecast: BTC Loses Momentum and Approaches $60K After the Fed Minutes
As the trading week progresses, Bitcoin's recent weakness continues to stand out. The cryptocurrency remains under pressure and, over the last four trading sessions alone, has posted a decline of nearly 4.0%.
Written by
Julian Pineda
Market Analyst
As the trading week progresses, Bitcoin's recent weakness continues to stand out. The cryptocurrency remains under pressure and, over the last four trading sessions alone, has posted a decline of nearly 4.0%. For now, the bearish bias that has remained in place for several weeks is largely driven by Bitcoin's sensitivity as a risk asset to expectations of higher interest rates from the Federal Reserve, a theme that gained further traction following the release of the Fed minutes. A higher-rate environment and the growing appeal of alternative markets could continue to weigh on demand for Bitcoin in the near term, potentially keeping selling pressure relevant over the coming trading sessions.
Is the Fed Becoming Bitcoin's Main Headwind?
A key event for financial markets took place today with the release of the latest Federal Reserve meeting minutes, which provided additional details on the conclusions reached during the late-October policy meeting. While ten officials voted to leave the benchmark rate unchanged at 4.00%, two policymakers favored a rate hike, arguing that inflation remained too elevated. In addition, the statement highlighted that the U.S. economy continues to show solid activity, supported by resilient consumer spending and robust business investment. Taken together, these remarks have begun to be interpreted as a signal that there may still be more room than previously expected for a more restrictive monetary policy stance in the months ahead.
What has become increasingly relevant following the release of the minutes is the market's outlook for upcoming Fed meetings. While traders were already assigning more than a 94% probability to a 25-basis-point rate increase at the December 9 meeting, markets are now also pricing in nearly a 70% chance of another hike at the January 27 meeting. Even for the March 17 decision, probabilities above 45% suggest that rates could move even higher. This implies that the current 4.00% benchmark rate could eventually approach 4.75%, reflecting expectations not only for higher rates for longer but also for the possibility of an additional tightening cycle that could prove more aggressive than previously anticipated.
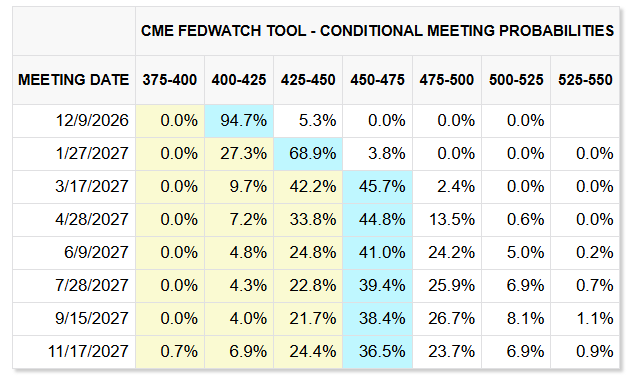
Source: CMEGROUP
What matters in this scenario is that Bitcoin, as a risk-sensitive asset, generally does not benefit from a rising interest rate environment. A more restrictive monetary policy tends to favor assets perceived as more stable while also increasing borrowing costs, potentially reducing liquidity available for risk-oriented investments such as BTC. At the same time, higher interest rates continue to support the U.S. dollar, increasing the appeal of dollar-denominated investments and strengthening markets that can act as more defensive alternatives to Bitcoin.
This dynamic remains evident in the behavior of the DXY Index, which measures the strength of the U.S. dollar against its major peers. The index continues to maintain a consistent upward trajectory and is once again approaching the 104-point area, close to the highs recorded during 2026. This reflects that demand for the U.S. dollar remains firm in the near term. In contrast, BTC continues to weaken and is already approaching the $60,000 area, highlighting a fairly clear inverse relationship in which strengthening safe-haven markets continue to limit appetite for risk assets.
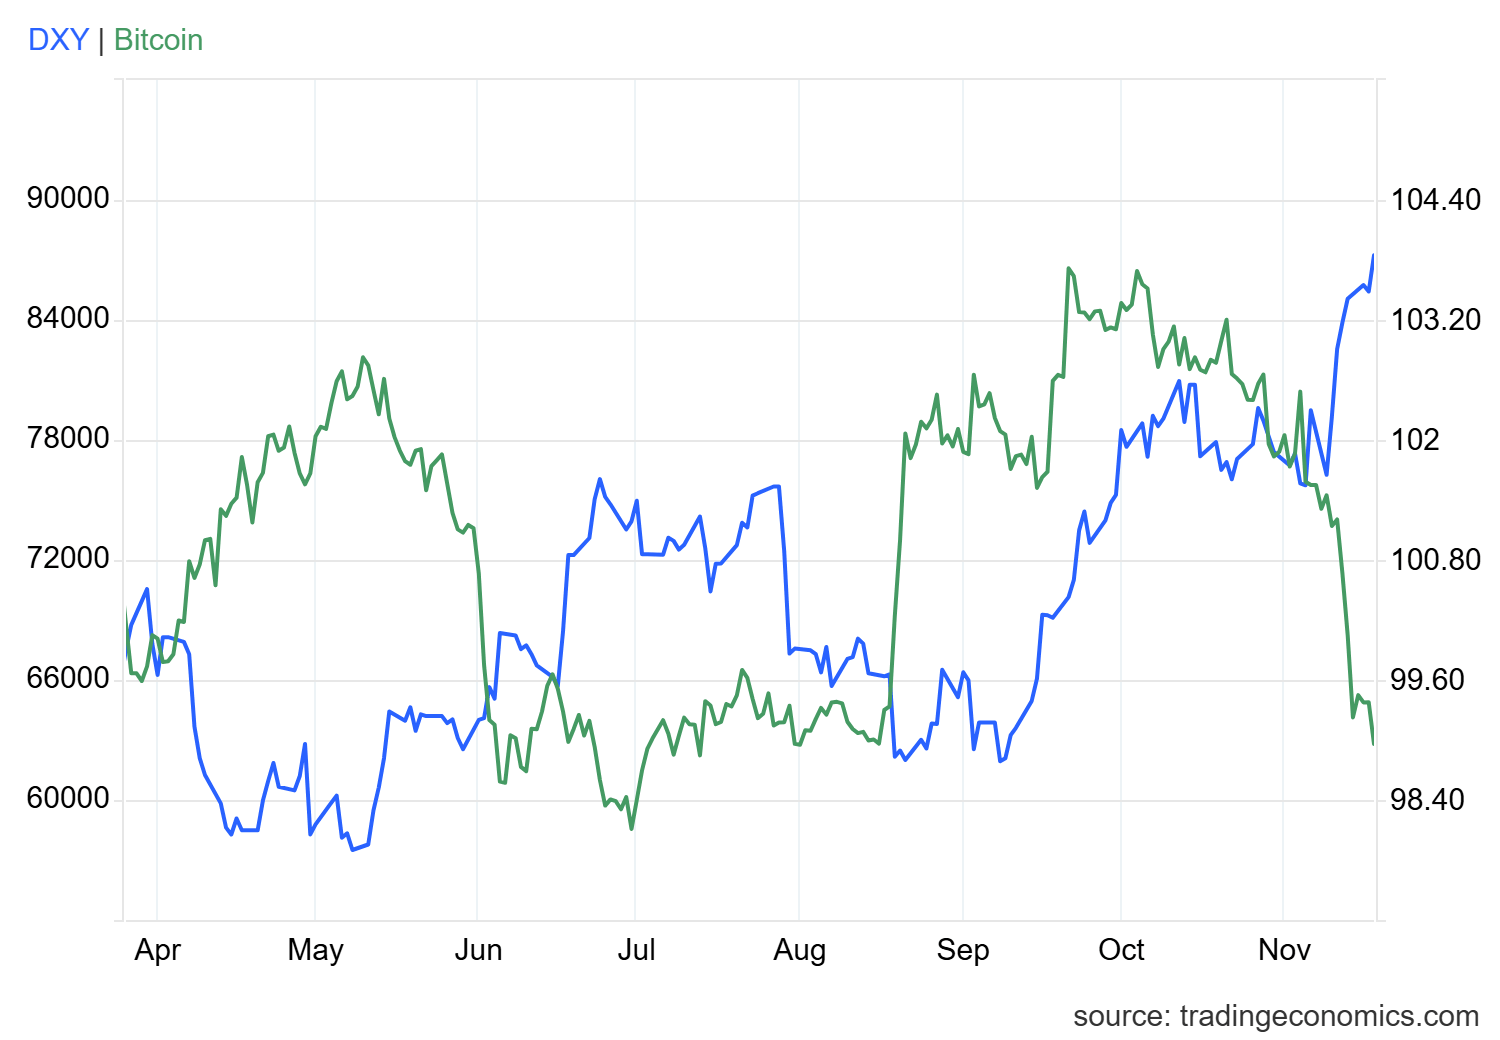
Source: TradingEconomics
It is also important to note that Bitcoin's weakness is not limited to today's session. Instead, it has been developing over several trading days. The cryptocurrency continues to struggle to maintain stable demand in an environment characterized by expectations of increasingly higher interest rates. Even after the release of the Fed minutes, buying activity has yet to stabilize.
Looking at the Open Interest indicator, which measures the total number of open positions in the futures market, the data continue to show a slowdown that has now extended over several consecutive sessions. The indicator currently stands near $21 billion, marking its lowest level of the month. This decline suggests that the market continues to experience a steady reduction in open positions and, when combined with the recent drop in BTC prices, may indicate that long positions have been reduced significantly. Overall, this points to weakening confidence in Bitcoin demand at a time when alternative markets continue to gain appeal and expectations for higher interest rates keep increasing.
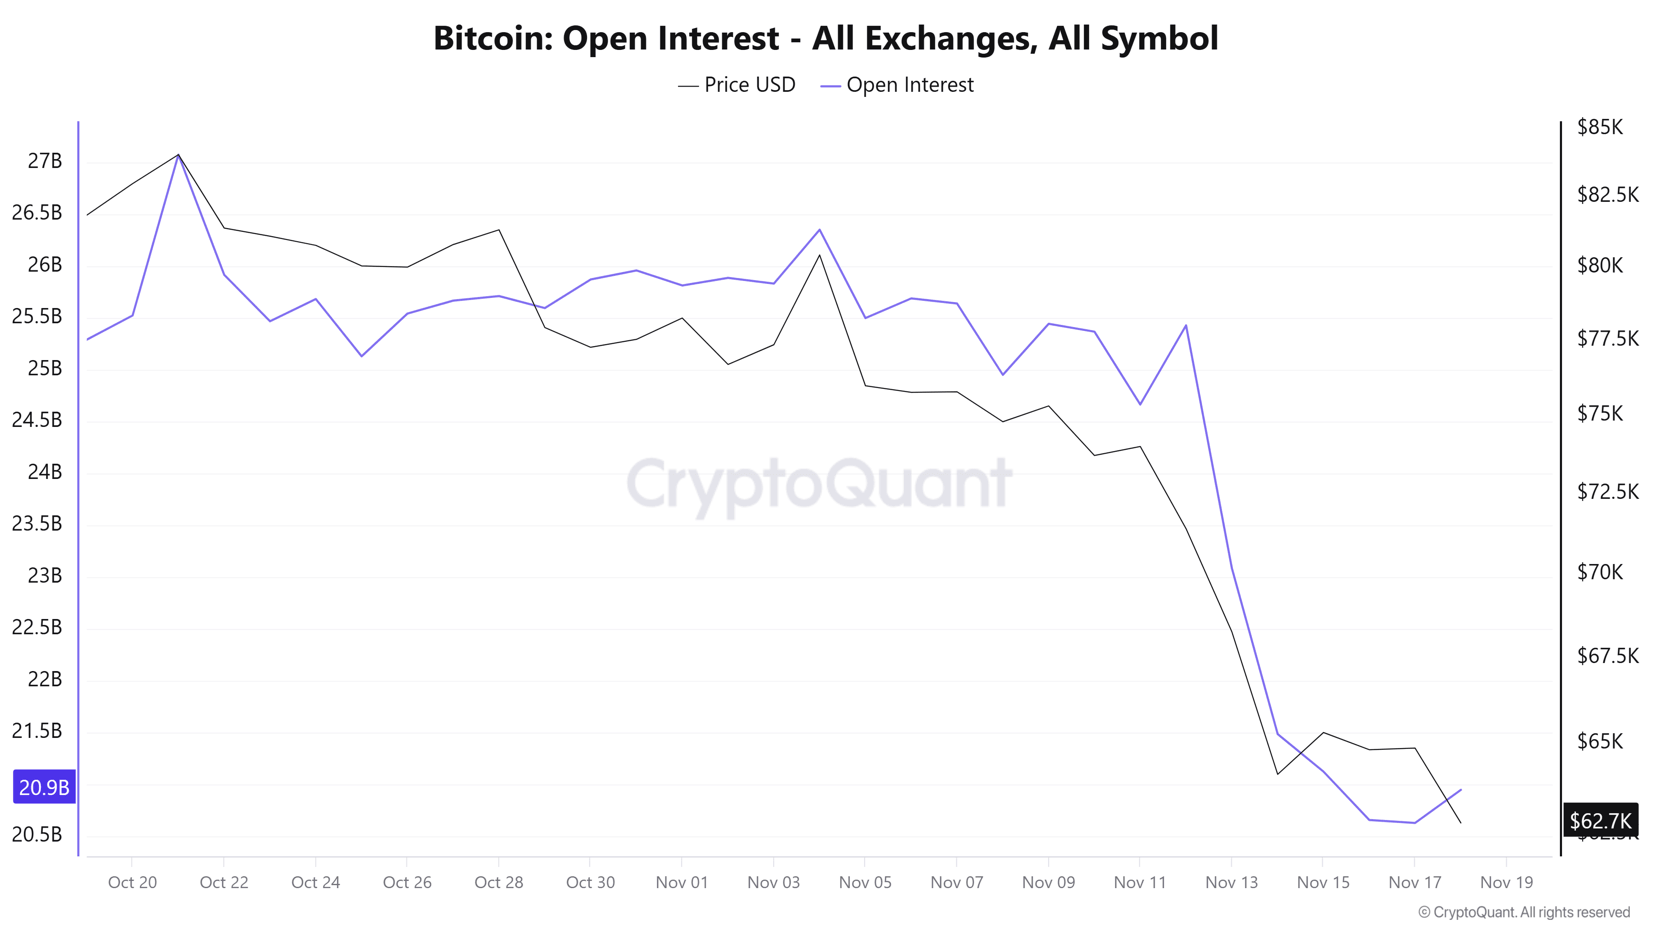
Source: Cryptoquant
Against this backdrop, the weakness and decline in demand activity around BTC are trends that had already been developing before today's session. However, the release of the Fed minutes has intensified this dynamic by reinforcing expectations of a more aggressive central bank over the coming months and by increasing the relative attractiveness of alternative markets such as the U.S. dollar. For now, Bitcoin has been unable to stabilize, and as long as expectations for a more restrictive monetary policy remain in place, selling pressure could continue to be a relevant theme in the weeks ahead.
Bitcoin Technical Forecast
Source: StoneX, Tradingview
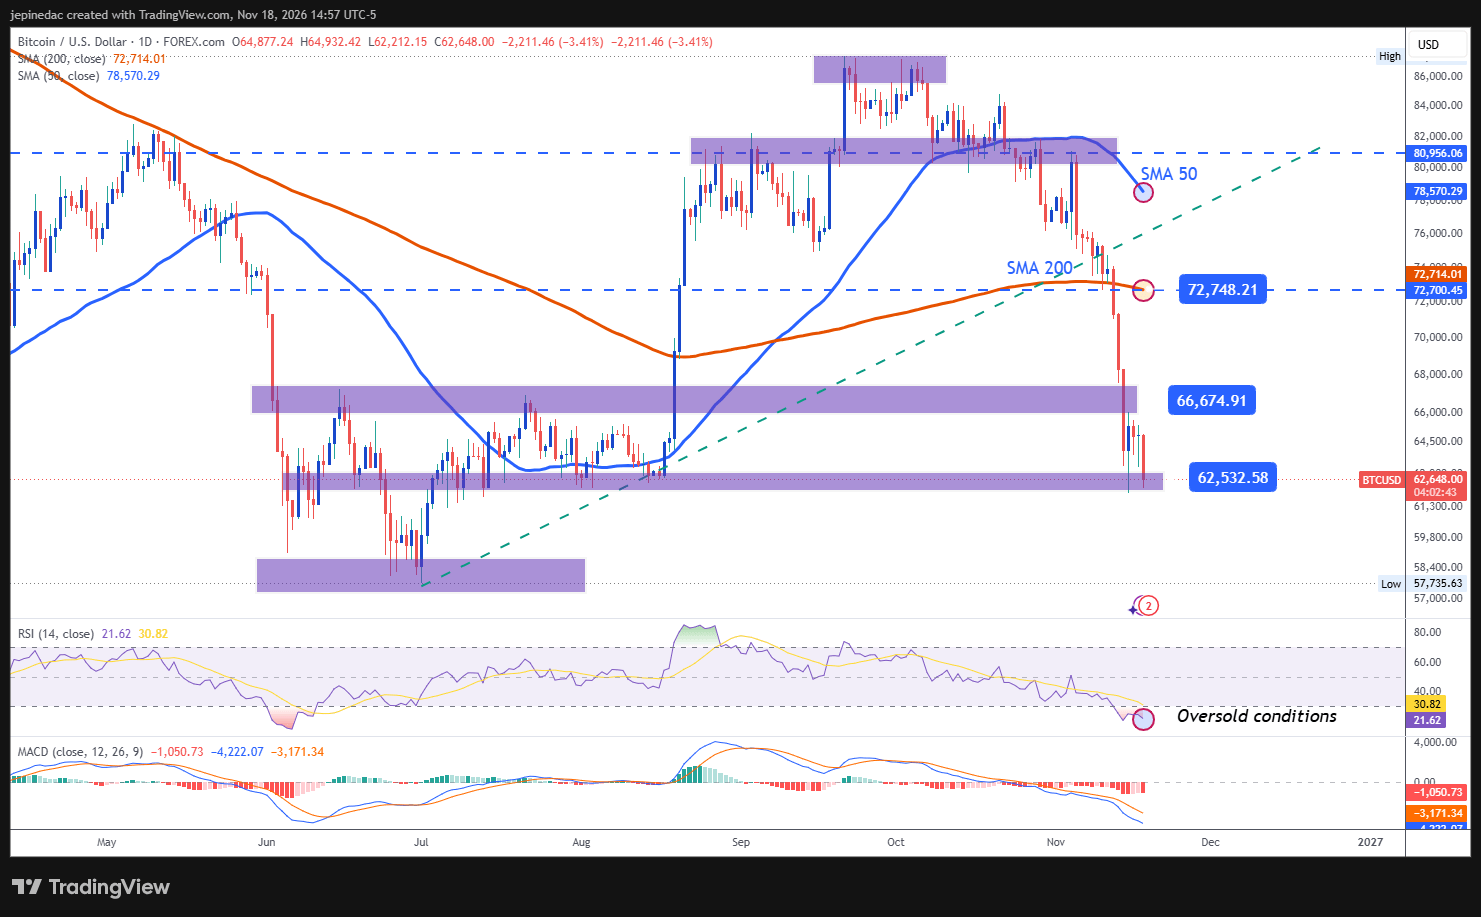
- Bearish momentum begins to dominate: Since the first days of November, Bitcoin's downward movements have become increasingly relevant and have even broken a potential bullish trendline that had remained intact for months. This has started to highlight a dominant bearish bias that, if it continues to push through key downside barriers, could give shape to a new bearish trendline that may become the most important technical structure to monitor in the weeks ahead.
- MACD: The MACD histogram continues to hold below the indicator's zero line. This suggests that selling pressure remains relevant across short-term moving averages, reflecting that the bearish bias continues to dominate the daily chart and could remain important over the coming sessions.
- RSI: A similar picture can be observed in the RSI, which remains below its neutral level. However, it is also important to note that the indicator is now trading below the 30 oversold threshold, suggesting that BTC may be showing signs of excessive recent selling pressure. This could open the door to potential bullish corrective moves in the near term.
Key Levels:
- 72,700 - Key Resistance: This level coincides with the barrier marked by the 200-period simple moving average. Price action returning to this area could begin to signal a loss of directional momentum, favoring a period of indecision or even the formation of a more defined trading range in the weeks ahead.
- 66,600 - Near-Term Barrier: This area coincides with significant retracement levels observed during the middle of 2026 and could act as the primary reference point for potential bullish corrections in the short term.
- 62,500 - Critical Support: One of the most important levels on the chart, corresponding to a low area not seen for several months. This level could act as a significant barrier against recent selling pressure, but if price manages to establish itself below it, a dominant bearish bias could gain further relevance and begin shaping an increasingly aggressive downward trendline over the coming weeks.
Written by Julian Pineda, CFA, CMT – Market Analyst
Follow him on: @julianpineda25
Related tags:
Latest market news











Web Trader platform
Our sophisticated web-based platform is packed with features.
Open an account today
Experience award-winning platforms with fast and secure execution.
Economic calendar
Related articles

Bitcoin Forecast: BTC/USD Back to $80K Ahead of Warsh’s Jackson Hole Speech
After surging over $15,000 in the past 10 days alone, there is risk of a near-term pullback if Warsh says anything remotely hawkish at Jackson Hole - what are the levels to watch from here?


Bitcoin, Gold Price Outlook: US CPI & Overbought Risks in Focus
Bitcoin, Gold Price Outlook Following a steep risk-on rally across US equity indices and precious metals, several major markets are approaching critical technical levels as momentum becomes increasingly stretched.


Bitcoin, Dow Jones Outlook: Dow Tests Major Resistance and Bitcoin Lags Below $67,000
Bitcoin, Dow Jones Outlook: Bitcoin remains below $67,000 while the Dow Jones tests major multi-year resistance. Key technical levels that could determine the next market move.