

Bitcoin Price Forecast: BTC/USD 12.5% Plunge Nears Critical Support
Bitcoin bears are closing in on critical trend support as a reported Binance security breach rattles sentiment, raising the stakes for November.
Written by
Michael Boutros
Sr. Technical Strategist
Bitcoin Technical Forecast: BTC/USD Weekly & Daily Trade Levels
- Bitcoin has fallen to six-week lows, with BTC/USD on course for a fourth consecutive weekly decline as selling pressure persists.
- The selloff is approaching a major support confluence near the lower boundary of a multi-week downtrend, raising the prospect of a potential exhaustion low.
- A sustained break below this critical pivot zone would expose the 200-day moving average and increase the risk of a deeper correction.
- Bulls need to reclaim near-term resistance to stabilize the outlook, with a daily close above the August high required to suggest a more significant reversal is underway.
- Treasury yields, U.S. Dollar strength, technology-sector performance and Bitcoin ETF flows remain key drivers heading into November.
Bitcoin has come under renewed selling pressure, falling below $80,000 as a hawkish Fed outlook, weakness in technology shares and a reported $6.3 billion security breach at Binance fueled risk aversion and forced liquidations. The selloff comes despite continued inflows into U.S. spot Bitcoin ETFs, highlighting the growing tension between underlying institutional demand and deteriorating market sentiment. With BTC/USD now approaching a major confluence of Fibonacci and trend support, the prospect of an exhaustion low is coming into focus as October draws to a close. The immediate risk remains tilted lower, however, and the next reaction could prove decisive in determining whether Bitcoin stabilizes heading into November or extends its broader correction. Battle lines are drawn on the BTC/USD technical charts.
Bitcoin Price Chart – BTC/USD Weekly
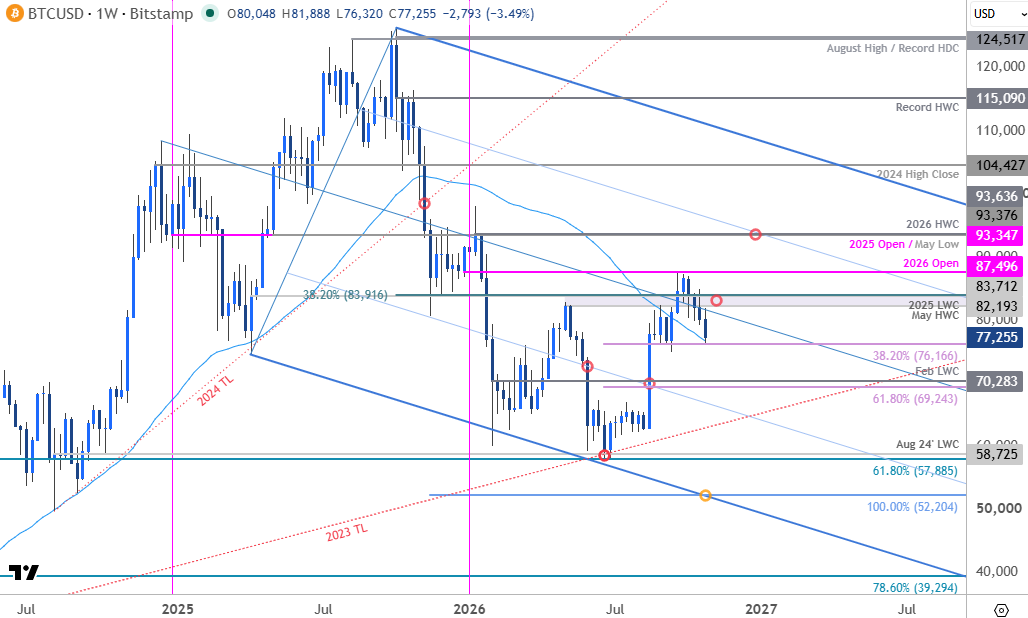
Chart Prepared by Michael Boutros, Sr. Technical Strategist; BTC/USD on TradingView
In last month’s Bitcoin Forecast we noted that BTC/USD had rebounded off key support and that, “From a trading standpoint, losses would need to be limited to 76,159 IF price is heading higher on this stretch with a close above 83,916 ultimately needed to mark resumption of the multi-month uptrend.” Bitcoin broke through resistance at the September highs three-days later with the advance extending more than 16.6% off the monthly low before exhausting just ahead of yearly open resistance at 87,496 (high registered at 87,374). Momentum deteriorated into the start of October with yesterday’s leg lower extending 12.5% off the monthly high.
A fourth-consecutive weekly decline takes price within striking distance of a key pivot zone near the 38.2% retracement and the 52-week moving average at 76,166/560. The focus is on possible inflection off this zone heading into the November open with a weekly close beyond this threshold needed to threaten another bout of losses for the cryptocurrency.
Bitcoin Price Chart – BTC/USD Daily
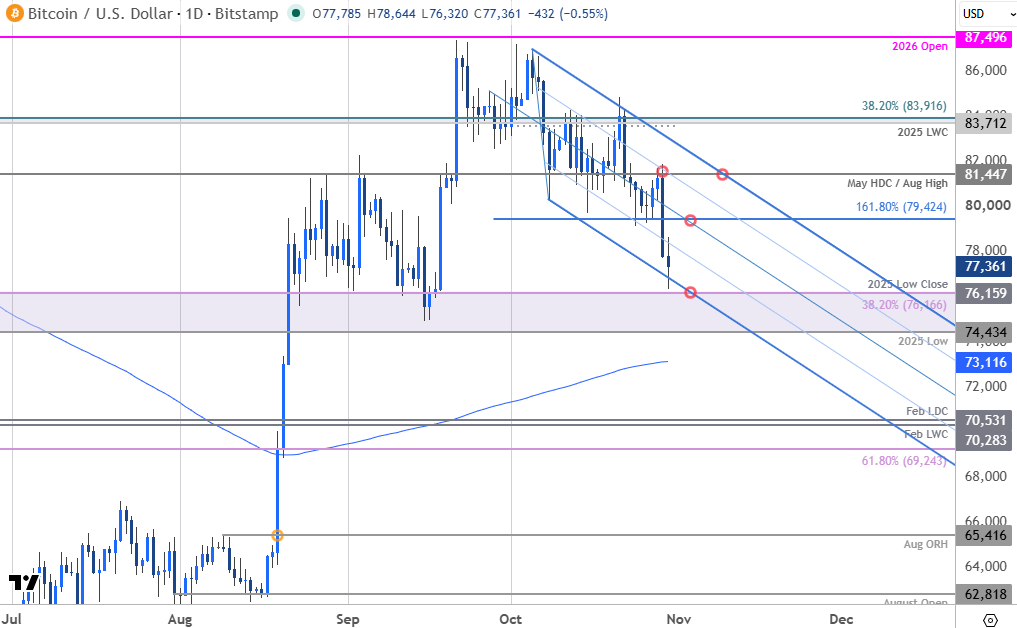
Chart Prepared by Michael Boutros, Sr. Technical Strategist; BTC/USD on TradingView
A closer look at the Bitcoin daily chart shows BTC/USD trading within the confines of a proposed descending pitchfork with price testing the lower parallel today. This slope converges on key support over the next few days at the 2025 low close and the 38.2% retracement at 76,159/66. The 2025 swing low rests just lower at 74,434- losses surpassing this level would threaten another bout of accelerated losses towards the 200-day moving average (currently ~73,116). The next major technical considerations rest at the February low-week / low-day closes (LWC/LDC) at 70,283/531 and the 61.8% retracement of the June rally at 69,243. Both levels represent area of interest for possible downside exhaustion / price inflection IF reached.
Initial resistance is now eyed back at the 1.618% extension of the late September decline at 79,424 with bearish invalidation now lowered to the May high-day close (HDC) and the August high at 81,447. A breach / daily close above this level is needed to suggest a more significant low is in place, and a larger trend reversal is underway. Subsequent resistance objectives are eyed at the 38.2% retracement of the decline off the record high and the 2025 LWC at 83,712/916.
Bottom line: Bitcoin has dropped to the lowest levels in six-weeks with daily momentum reaching the lowest levels since July. Be on the lookout for a possible exhaustion low in the weeks ahead. From a trading standpoint, a good zone to reduce short-positioning / lower protective stops- the focus is on a reaction off the 74,434-76,166 pivot zone heading into the November open. The risk remains weighted to the downside while below 79,424 with a close below this hurdle needed to mark resumption of the late September downtrend. Stay nimble here and watch the weekly closes for guidance.
--- Written by Michael Boutros, Senior Technical Strategist
Follow Michael on X @MBForex
Latest market news










Web Trader platform
Our sophisticated web-based platform is packed with features.
Open an account today
Experience award-winning platforms with fast and secure execution.
Economic calendar
Related articles

USD/JPY Weekly Outlook: AI earnings could overshadow the Fed and BoJ
AI sentiment has become a major driver of US Treasury yields and USD/JPY. With Microsoft, Alphabet and Amazon reporting this week, central bank decisions may have competition for traders' attention.


Bitcoin Forecast: BTC/USD Back to $80K Ahead of Warsh’s Jackson Hole Speech
After surging over $15,000 in the past 10 days alone, there is risk of a near-term pullback if Warsh says anything remotely hawkish at Jackson Hole - what are the levels to watch from here?


Euro Forecast: Will Core PCE Tip the Scales for the Fed?
The last Core PCE before the Fed's September meeting will mark 65 straight months above the central bank's 2% target - will it be enough to push the FOMC toward a rate hike?