

Crude Oil Prices Jump, Stocks Still Holding Up For Now
Fear has reappeared in oil prices but so far, stocks appear to have escaped unscathed. But matters can change quickly in global macro.
Written by
James Stanley
Sr. Strategist
Oil Talking Points:
- The Memorandum of Understanding seems further in the rear view as tensions continue at the Strait of Hormuz.
- WTI Crude Oil has jumped just under 30% from the July lows and a clear trend has taken over in contrast to the bearish trend that dominated last month.
- Perhaps most interesting has been the seeming disconnect of oil prices to stocks, which had appeared to move in lock-step when the conflict began back in March.
When panic and fear hit the headlines in March as the war with Iran began, crude oil prices jumped with aggression and stocks sold off. In stocks, the sell-off was quite similar to what happened a year earlier although it was the tariff-fueled fears in 2025 that drove the sell-off and a year later, it was the inflation fear produced by the prospect of higher oil prices.
That now seems like a lifetime ago, as there’s been too many twists and turns to count. President Trump has used his social media account and headlines to drive markets with stocks jumping to fresh all-time highs even as the war has been ongoing. The MOU in late June brought hope that perhaps an end was near, and this helped to provide some serenity as Americans went into the Fourth of July holiday. But that, too, has turned out to be a not-lasting sense of relief as tensions have simply re-stoked and crude oil prices are now up almost 30% from the early-July lows.
At this point, however, stocks appear to be showing less of that fear as both the S&P 500 and Nasdaq 100 are up on the week. Perhaps the bigger question is whether that remains if oil prices begin scaling higher, as there’s clearly been some larger trends at work over the past two months with the sell-off from May-late June leading into the past three weeks of aggressive gains.
WTI Crude Oil – Phased Trends, Buyers Back on Bid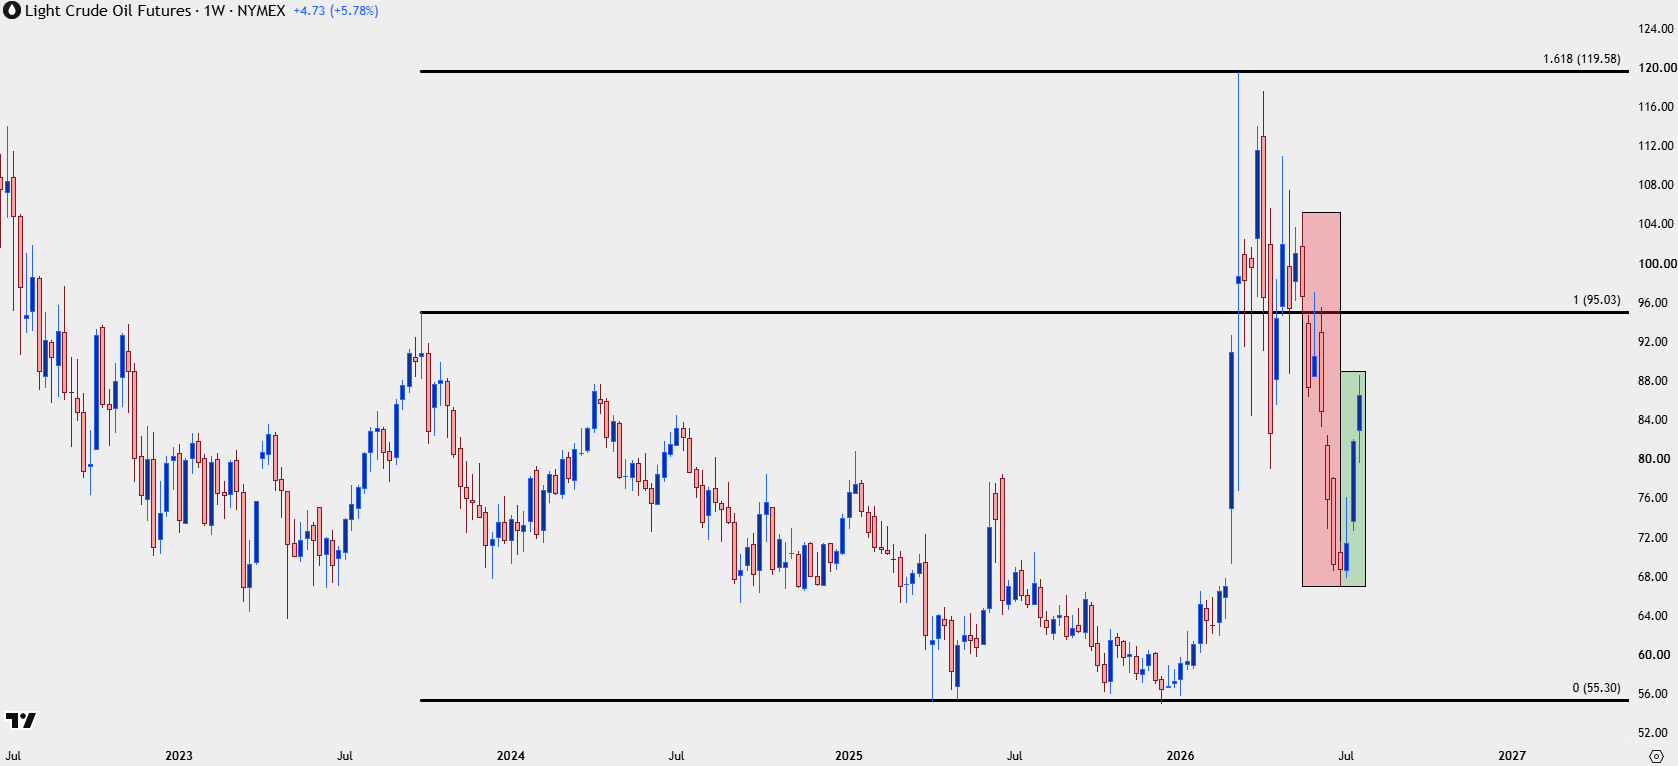
Chart prepared by James Stanley; data derived from Tradingview
WTI Levels
It was the 80 handle that came into play earlier this week before buyers pounced and pushed up to a fresh high, so that seems important for forward-looking strategy. With the SPR having supplemented supply since the onset of the conflict and with markets showing clear change over the past three weeks, the possibility here is that we’re seeing legitimate fear take over in oil markets as a drained SPR and a continued conflict with no end in sight raises the prospect of longer-term higher oil prices, and that’s not just relevant to WTI as Brent Crude is testing the 95-level this morning.
For WTI specifically, a break of the 93.26-95.00 zone would give this the appearance of a trip up to and a test of 100 – and if we get a closed body break of 100 it’s going to look like an entirely new theme is taking over.
For supports, 80 is huge, of course, but 82.07 is of note for shorter-term themes, as a pullback to and show of support there opens the door for near-term bullish continuation scenarios.
WTI Crude Oil Daily Chart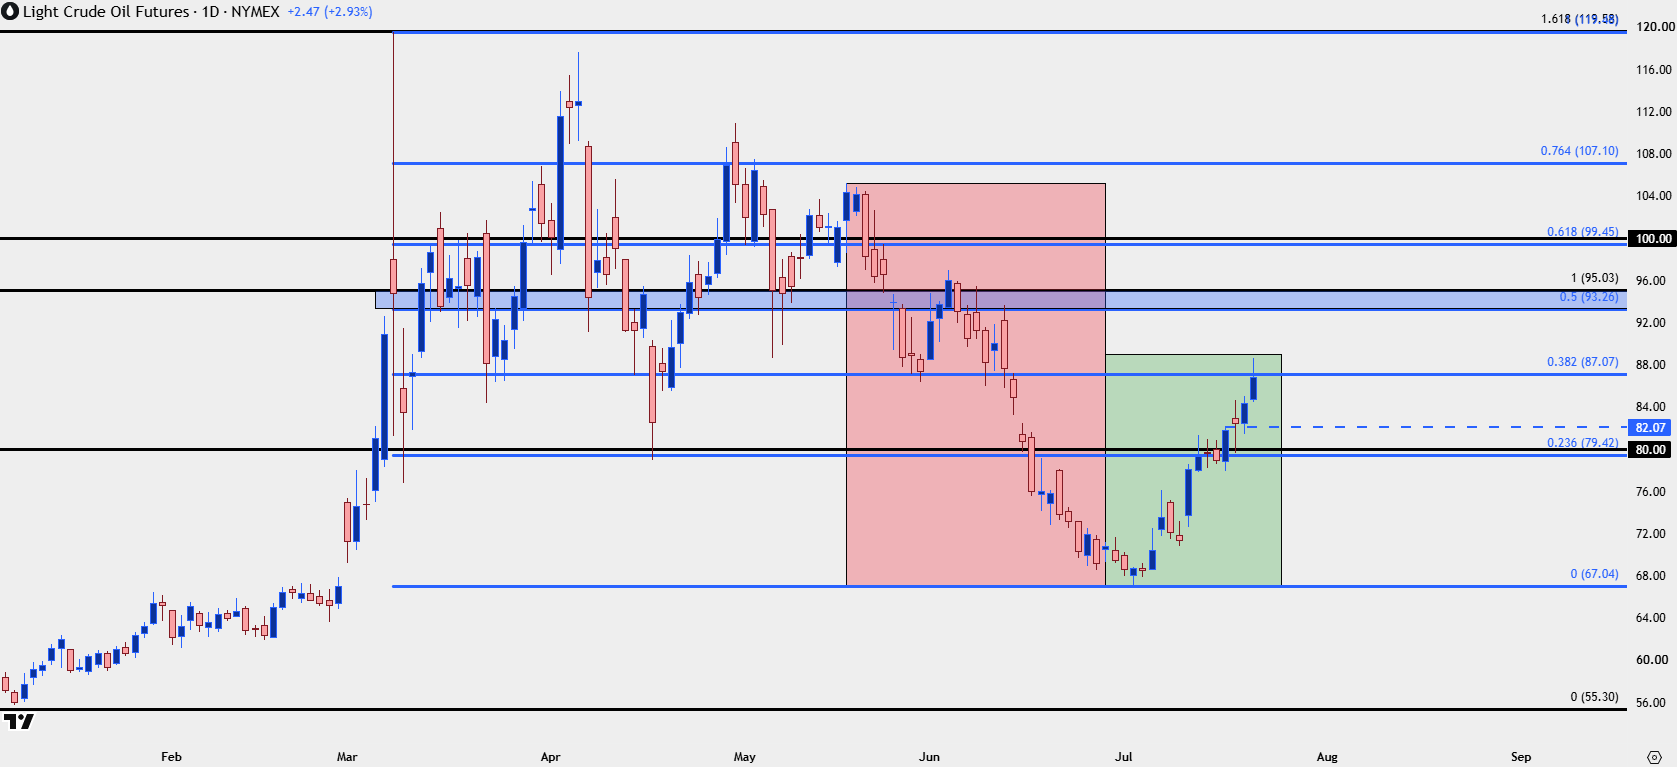
Chart prepared by James Stanley; data derived from Tradingview
WTI Shorter-Term Strategy
Going down to the four-hour gets us a bit more granularity, and this highlights how that 82.07 price syncs down to 81.25 to create a support zone. This was a spot that’s seen considerable traffic first as resistance, then as support, and if we do see buyers letting this go that would illustrate a degree of change that would be worth taking note of.
Shorter-term, there was a resistance swing just inside of the 85 handle, at 84.58, and this would present as higher-low support potential for more aggressive bullish strategies.
Given the pace of trend there’s no sign yet that the rally may be near top but that resistance area sitting overhead, from 93.26-95.00 is a major spot on the chart. The way the market reacts to that or near that could be telling.
WTI Crude Oil Four-Hour Chart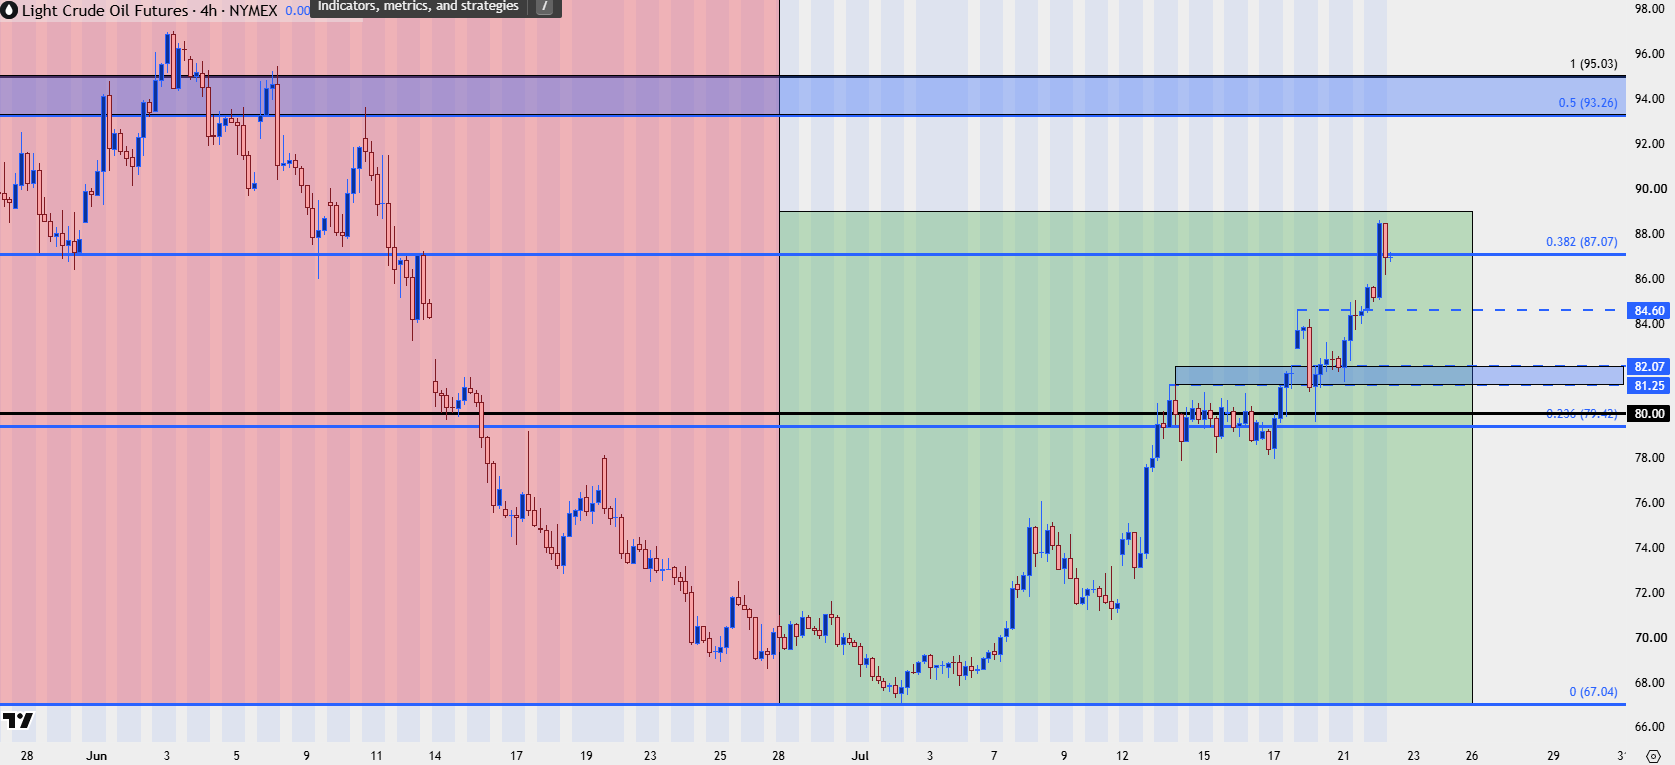
Chart prepared by James Stanley; data derived from Tradingview
Stocks
While oil prices have certainly been in the cross-hairs of President Trump, it is perhaps stock prices that he is more concerned about as mid-terms are now less than four months away. And while the initial panic back in March showed with higher oil prices and lower equity prices, that began to diverge at the Q2 open and has since shown a lacking correlation. And given that they’re different markets with different drivers, that makes sense, as correlations can wax and wane as there’s multiple factors at play.
When the fear initially hit back in March there was immense uncertainty. And market participants reacted to that as they often do react to the initial onset of uncertainty, by pricing in risk. But the dominating theme in stocks was the expectation that President Trump wouldn’t run the risk of a stock market collapse, like what had taken over last year after the initial onset of tariff worries. This led to the ‘TACO’ trade, and for equity investors, the sell-off on initial panic and fear presented an opportune backdrop to take on long exposure, both last year and this year, leading to those fresh all-time highs.
The S&P 500 retains a bullish posture at this point, with an ascending triangle formation still in-play. Yes, there’s been stalling at 7600, but so far bulls have been jumping in at higher-lows.
S&P 500 Daily Price Chart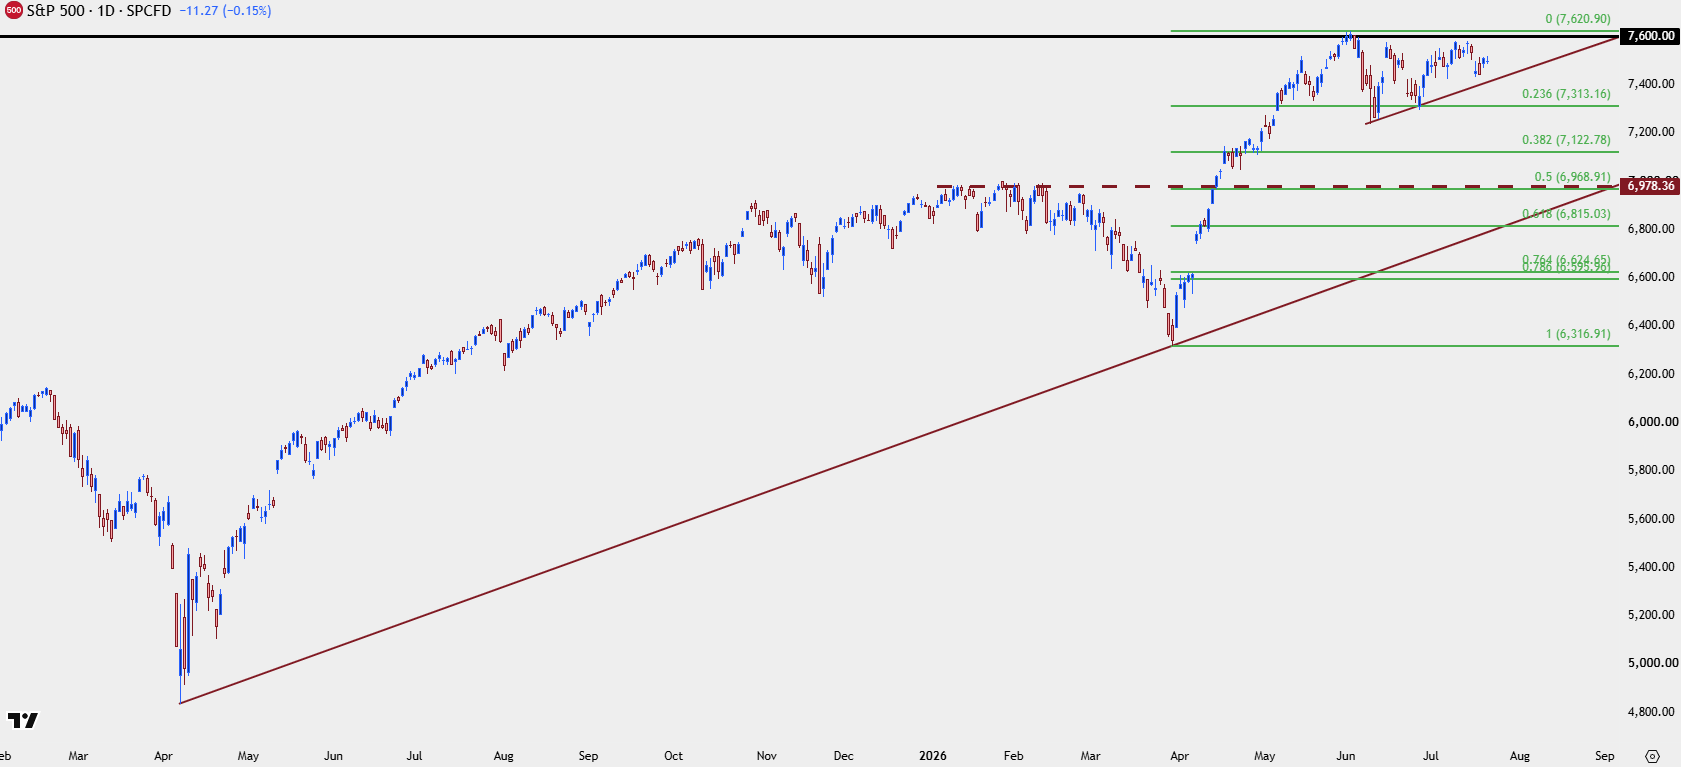
Chart prepared by James Stanley; data derived from Tradingview
So what could change here? It would probably have to come from interest rates. As long as investors have little opportunity cost for their capital there’s simply little reason to sell stocks and sit in cash unless there’s an overriding, foreboding sense of fear in the marketplace. If we do see a sell-off in equities, or a more sizable pullback, that cash on the sidelines could quickly return as oversold readings show, and this would be similar to what took place in April for each of the past two years.
If interest rates do move higher, however, that can begin to change, and this would be similar to the tech bust where higher long-term bond yields became an attractive alternative to chasing stretched equity valuations. The 30-year peaked around 6.7% at the time so we’re still a far way off of those levels. But, if we do see Treasury bonds continuing to be sold, like what showed back in 1998-2000 could happen again, where Treasury bond rates jumped from 4.7% to 6.7% in less than two years.
And from the monthly chart below a breakout in yields can certainly be argued given the current backdrop.
US Treasury 30-Year Yields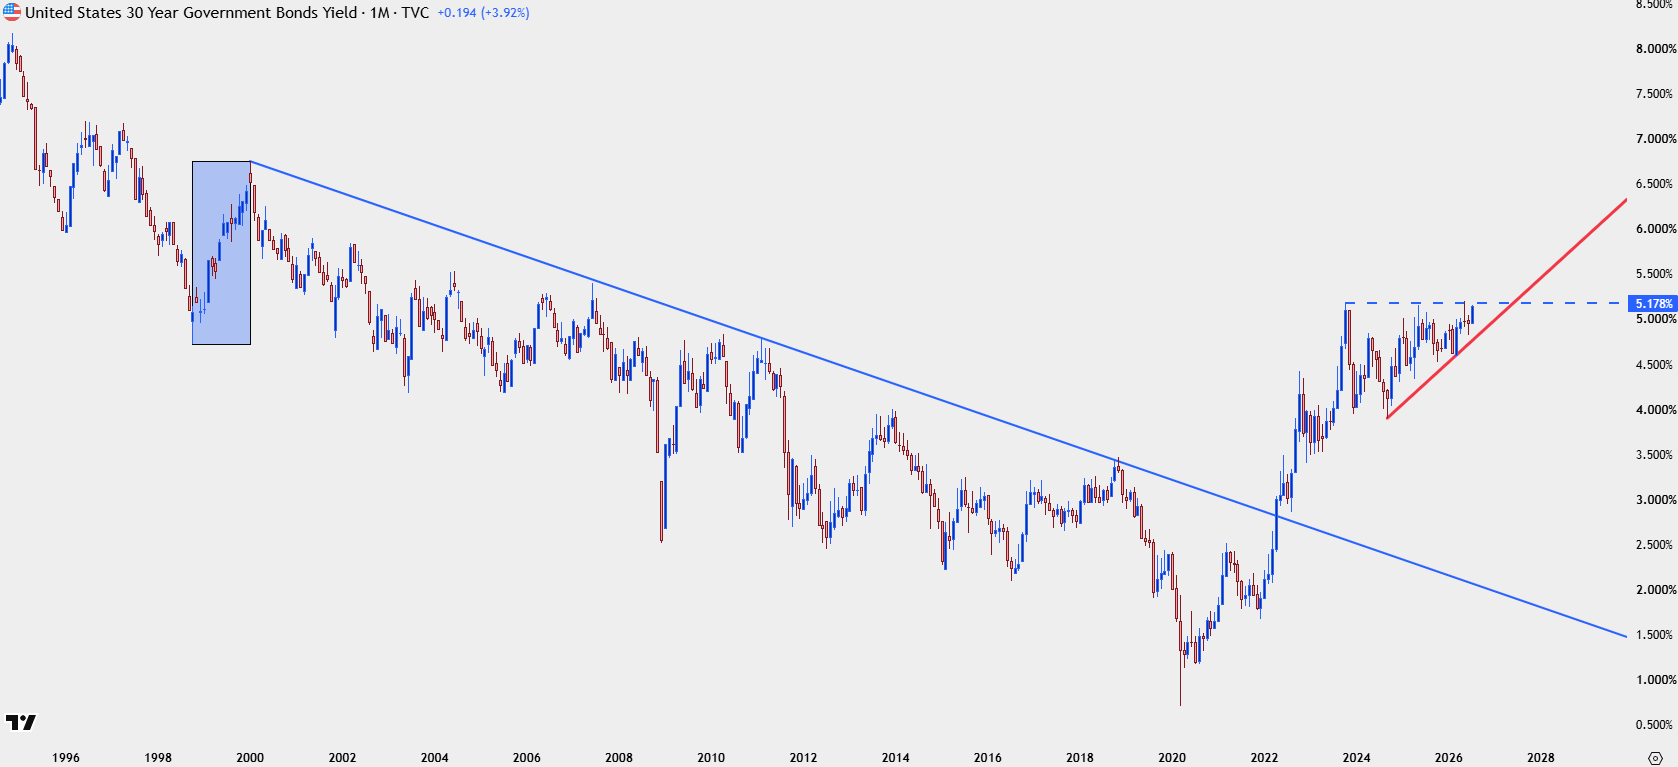
Chart prepared by James Stanley; data derived from Tradingview
Nasdaq
I covered this in the weekly equity forecast but there’s a bit of divergence between the S&P 500 and Nasdaq. At this point the divergence can be explained away by just how aggressively the rallies from the March/April pullback have priced-in, but like we saw back in 2000, if there is a topping event to take place in equities, the expectation would be that the Nasdaq would begin to underperform the S&P 500 before leading the way lower.
At this point there is a descending triangle in the Nasdaq 100, which is a bearish formation. Again, I would consider this as more of a short-term setup than a longer-term ordeal. But, if we do see that support at 28,391.50 give way, there’s not much for prior support reference until we get down to the prior resistance point around the 26k handle.
Now, if that price comes in quickly, perhaps paradoxically, it could set up for another long backdrop similar to what had shown for the past two years. Oil prices and fear around the Strait of Hormuz would likely have to play some role here. But when or if Treasury yields run higher and there’s then an attractive alternative venue to store capital, rather than chasing an oversold pullback, there could still be a bullish argument to be made here in bearish short-term scenarios.
Nasdaq 100 Daily Chart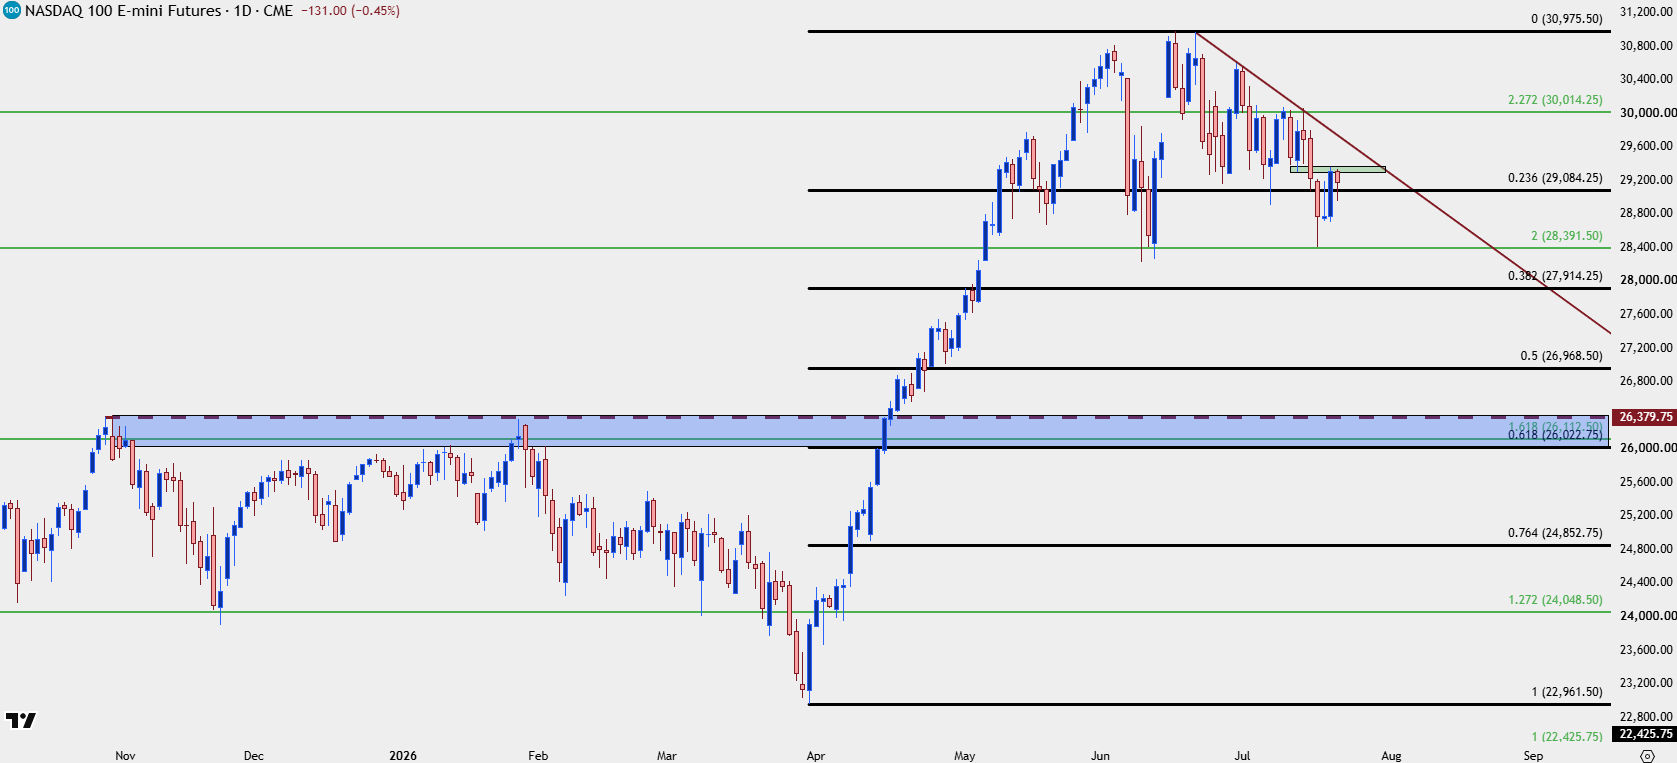
Chart prepared by James Stanley; data derived from Tradingview
--- written by James Stanley, Senior Market Analyst, Global Macro
Related tags:







Web Trader platform
Our sophisticated web-based platform is packed with features.
Open an account today
Experience award-winning platforms with fast and secure execution.
Economic calendar
Related articles

Gold and S&P 500 analysis: What now after Warsh’s hawkish speech?
The dollar surged across the board after the Fed Chair Kevin Warsh surprised with a hawkish-leaning speech at the Jackson Hole summit. All the bearish dollar bets that had been accumulated since last Friday on the back of data weakness and bond market troubles had to be squared and that triggered a short squeeze rally for the dollar. Gold and silver dropped, as a result, as too did bitcoin, while US indices were giving back earlier gains.


Nasdaq 100 Forecast: NDX slips ahead of Fed Chair Warsh’s speech
U.S. stocks are edging lower on Friday, giving back some of yesterday's gains after Nvidia's strong outlook revived the tech trade. The focus has now shifted firmly to Fed Chair Kevin Warsh's Jackson Hole speech, with investors looking for more clarity on the outlook for interest rates.


Jackson Hole Returns: Nikkei 225 and Nasdaq 100 Volatility in Focus
Historical Jackson Hole returns point to elevated Nikkei 225 volatility around Fed speech day, with Nasdaq 100 direction hinging on Kevin Warsh.
