


Crypto Technical Analysis: Bullish Momentum Pushes Cryptocurrencies to New Highs
September continues to advance and, with it, important changes have started to emerge across the cryptocurrency market in the short term. Although indecision and neutrality played an important role at the beginning of the week, the market managed to close with a renewed and accelerating bullish bias that pushed several cryptocurrencies above key resistance levels.
Written by
Julian Pineda
Market Analyst
September continues to advance and, with it, important changes have started to emerge across the cryptocurrency market in the short term. Although indecision and neutrality played an important role at the beginning of the week, the market managed to close with a renewed and accelerating bullish bias that pushed several cryptocurrencies above key resistance levels. This development has begun to change the indecisive outlook seen earlier in the week and could now be opening the door to more consistent demand activity. For now, the sustained advance in prices suggests that buying pressure may continue to play an important role over the coming trading sessions.
Performance of Major Cryptocurrencies
Source: Data - StoneX, Tradingview
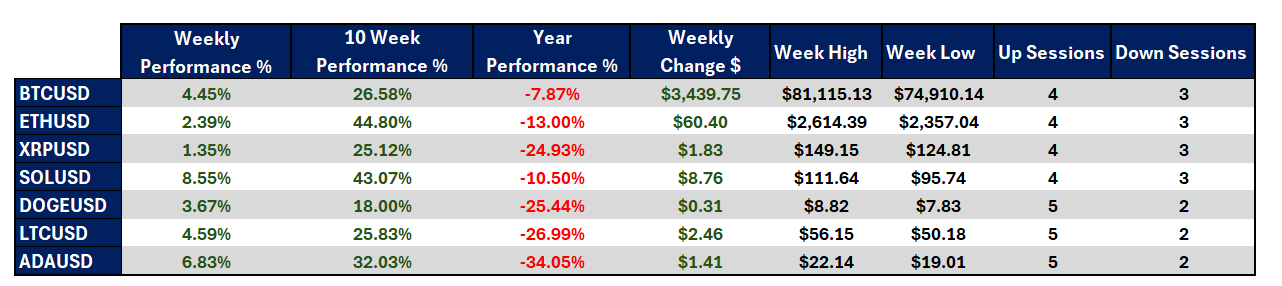
- The week remained positive for the cryptocurrency market, with virtually all major cryptocurrencies closing with meaningful gains. This reflects the return of a broader bullish bias throughout the sector. Solana stands out after posting gains of more than +8.00%, making it the strongest-performing cryptocurrency in the short term, while Ripple delivered the most modest performance with gains of nearly +1.00%, although it still remains in positive territory.
- Over the past 10 weeks, the market continues to display a constructive medium-term outlook. Comparing current prices with those seen ten weeks ago still reveals broad-based gains across the sector, highlighting that buying pressure has remained relevant among most major cryptocurrencies. In this regard, Ethereum and Solana stand out, both posting gains of more than 40% and positioning themselves as the assets that have managed to sustain market confidence most effectively during this period.
- The yearly picture remains less favorable and continues to suggest that there is still significant ground to recover before 2026 can close with a positive result for the sector. Despite the recovery observed in recent weeks, most major cryptocurrencies continue to trade below their opening levels for the year. Cardano remains the weakest asset, posting losses of approximately -34.00%, while Bitcoin is still down around -8.00%. This suggests that, despite the recent rebound, a degree of long-term weakness continues to persist across the market.
- Bitcoin, as the market's leading cryptocurrency benchmark, has managed to sustain meaningful buying momentum throughout the week. The asset has recovered more than $3,000 in value and has moved back above the $80,000 level, showing that buying activity has returned rapidly and may be acting as a catalyst for the broader cryptocurrency market.
- Broadly speaking, the market has once again begun to show growth supported by a bullish bias that appeared constrained only weeks ago. Bitcoin has helped restore confidence across the sector, and gains are starting to appear as a market-wide phenomenon rather than isolated cases. This could suggest that buying pressure has returned to the market as a whole and may continue to remain relevant in the sessions ahead.
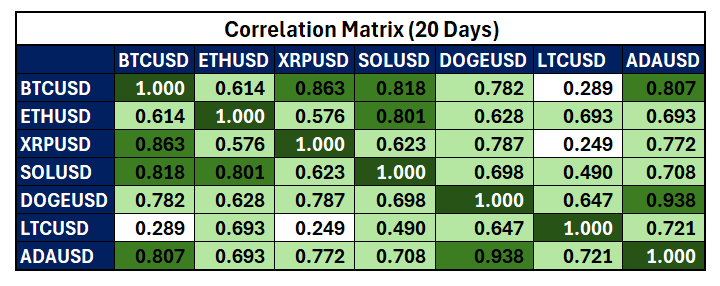
Colors range from red to green. Red represents negative correlations and green represents positive correlations.
Source: Data - StoneX, Tradingview
From a correlation perspective, another notable development has been the increasing similarity between broader market movements and Bitcoin's direction. In most cases, correlation coefficients remain above 0.7, while only Litecoin shows a meaningful loss of correlation, with a coefficient near 0.3. This indicates that much of the market has once again aligned itself with Bitcoin's direction, a dynamic that had weakened in recent weeks. For now, a positive relationship between the majority of cryptocurrencies and Bitcoin's average price movements has become evident once again. Correlation coefficients can change over time.
This development is important because it suggests that the market has become more synchronized and moved away from a period where only a handful of cryptocurrencies were able to recover. Confidence is now spreading more broadly across the sector, while Bitcoin is regaining its role as the market's primary benchmark. As BTC continues to strengthen its recovery, this renewed confidence may continue to extend to the rest of the cryptocurrency market and support more sustained buying pressure in the sessions ahead.
Is Bitcoin Back in the Game?
Source: StoneX, Tradingview
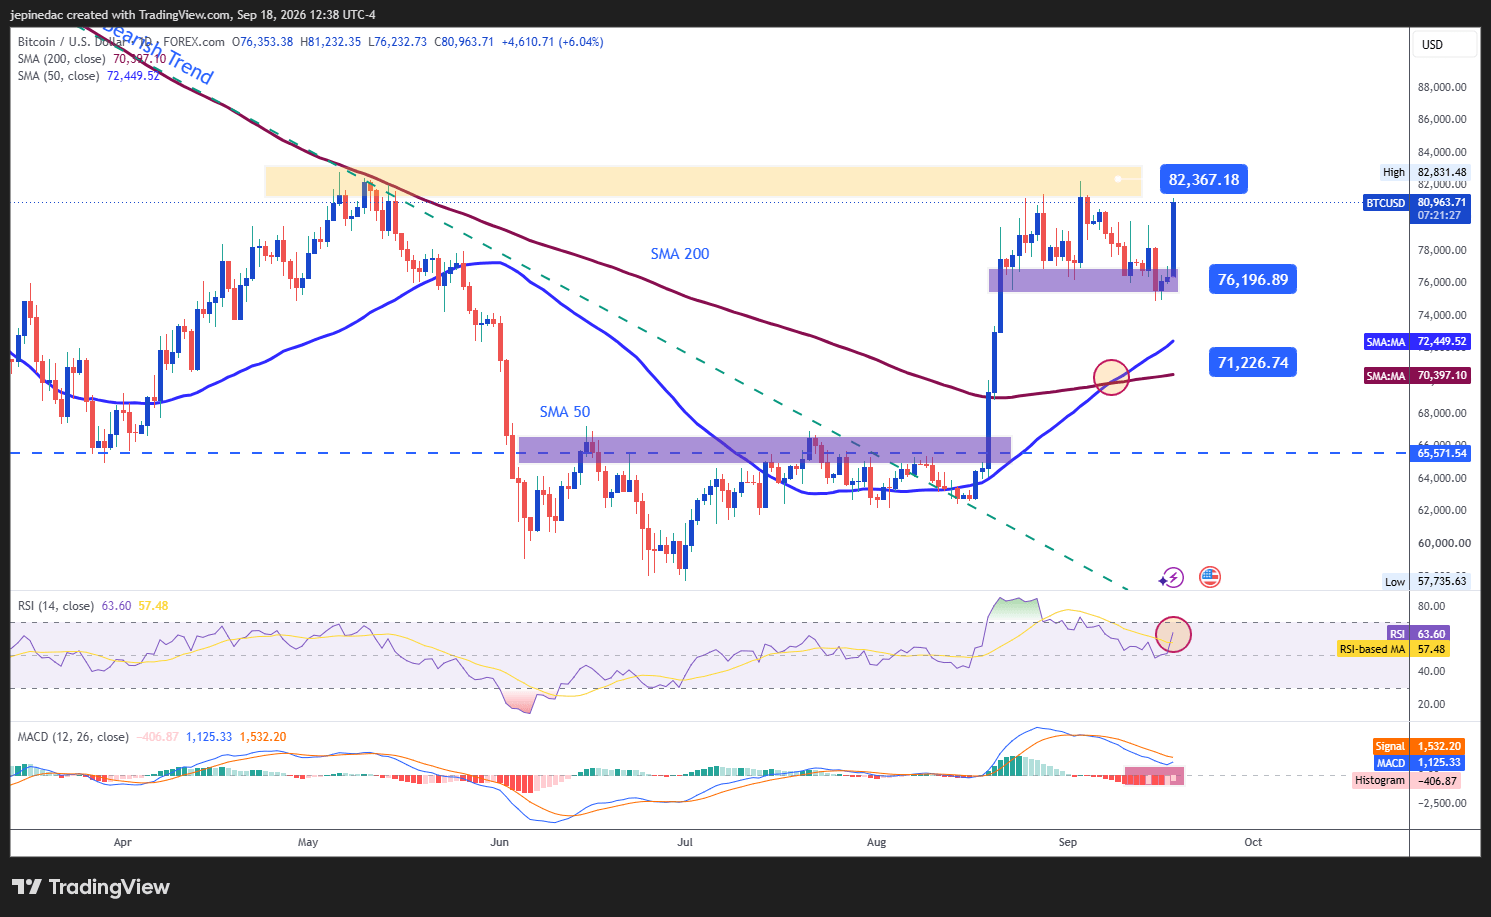
Bitcoin ended the week with solid bullish momentum and has started to move away from the neutral bias that dominated price action earlier in the week. For now, despite the recent advance, there is still no clear formation of a new trendline structure on the chart. However, if buying pressure continues to build and key nearby highs are successfully broken, a more dominant bullish bias could begin to emerge and eventually open the door to a more structured uptrend over the coming weeks.
Indicators:
- The RSI has already moved above its neutral zone, while the MACD histogram is approaching a crossover above its center line. This reading reflects strengthening short-term momentum and improving moving-average strength, highlighting the potential early stages of a meaningful bullish bias. However, it is also important to note that the RSI is gradually moving closer to the 70 overbought threshold, a situation that could leave room for short-term corrective pullbacks.
Key Levels:
- $82,300 – Key Resistance: A high not seen in several months and the most important bullish barrier on the chart. Sustained moves above this level could reinforce the relevance of the current bullish bias and signal a structural shift capable of supporting a more developed uptrend over the coming weeks.
- $76,000 – Near-Term Barrier: A level that coincides with important retracement zones observed weeks ago and represents the nearest support reference within the market. This area could become the main level to monitor if short-term pullbacks begin to develop.
- $71,220 – Critical Support: This area coincides with both the 50-period and 200-period simple moving averages and remains one of the most important support levels within the current structure. A move back toward this area could weaken the credibility of the recent recovery and reopen the door to a period of greater indecision or even a broader consolidation range.
Solana Emerges as the Strongest Cryptocurrency in the Short Term
Source: StoneX, Tradingview
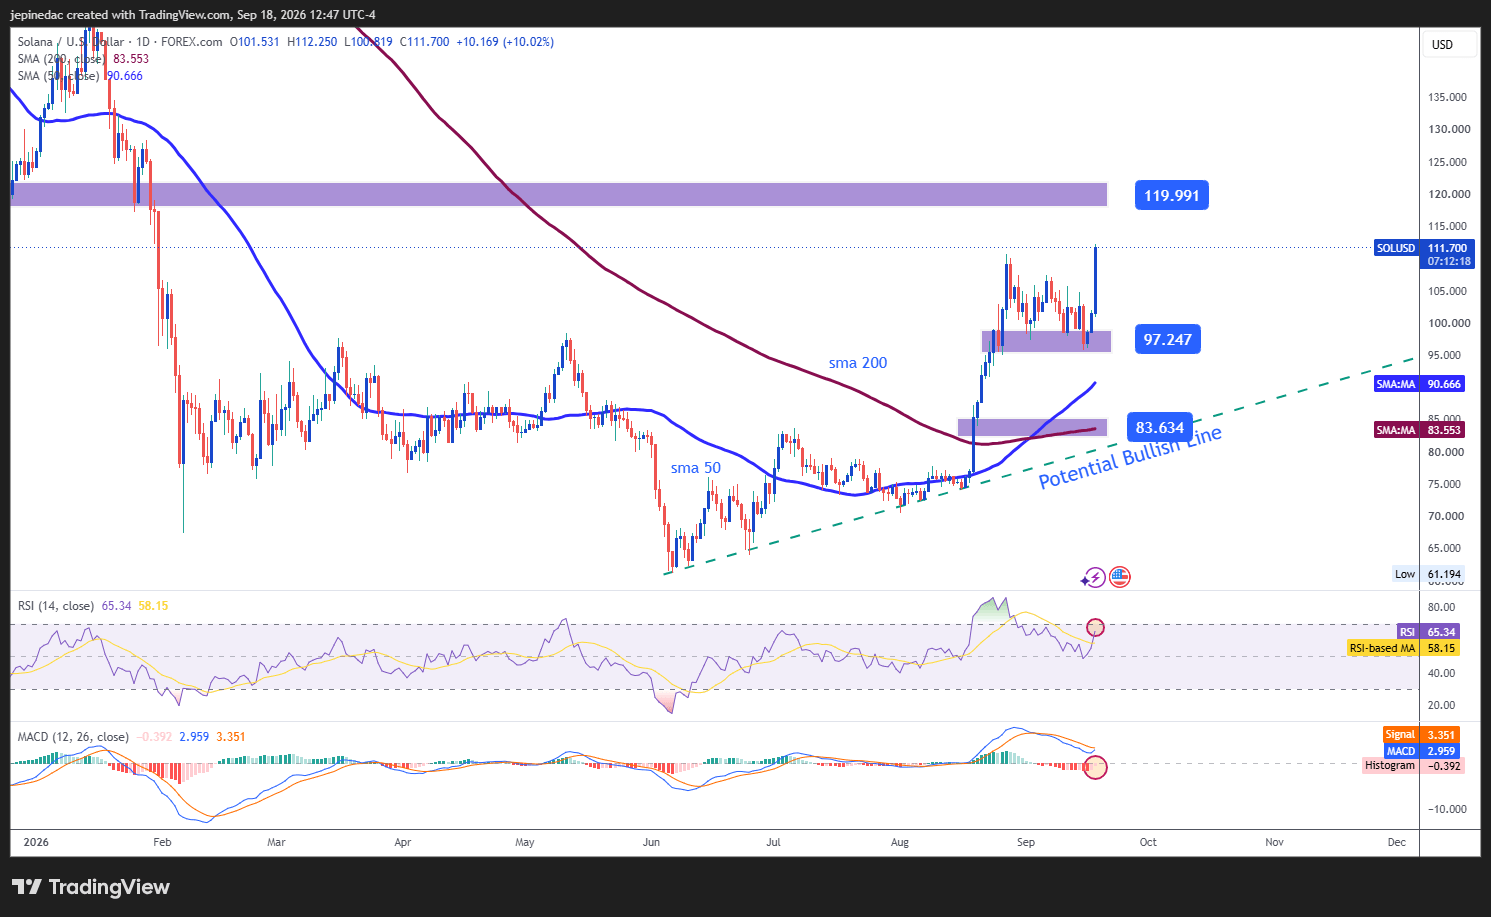
Solana finished the week as one of the strongest-performing cryptocurrencies in the market. Recent bullish price action has begun to shape a potential uptrend on the daily chart, a structure that continues to gain relevance as prices post increasingly higher highs. If buying pressure remains in place over the coming sessions, this trend could continue to strengthen and establish itself as the dominant structure to watch in the weeks ahead. However, it is also important to recognize that prices have advanced rapidly, which could create room for short-term selling corrections.
Indicators:
- Both the RSI and MACD currently display a similar pattern to the one seen in Bitcoin. Both indicators are attempting to remain above their neutral levels, highlighting the growing importance of a renewed bullish bias across the market. However, the RSI continues to move steadily toward the 70 overbought zone, suggesting that the recent buying momentum may be becoming extended and could leave room for short-term corrective moves.
Key Levels:
- $120.00 – Key Resistance: A major psychological level that coincides with an important barrier seen several months ago. Price action above this reference would not only reaffirm the dominance of the current bullish bias but could also strengthen the emerging uptrend and establish it as the market's dominant structure in the weeks ahead.
- $97.24 – Near-Term Barrier: A level that coincides with the nearest retracement zone on the chart. It could become the most relevant reference point for monitoring potential short-term corrections.
- $83.63 – Key Support: A level aligned with the 200-period simple moving average and the base of the potential uptrend. It represents the most important bearish barrier within the current structure, and any move back toward this area could begin to threaten the continuity of the bullish trend and open the door to a more significant period of indecision.
Written by Julian Pineda, CFA, CMT – Market Analyst
Follow him on: @julianpineda25
Latest market news










Web Trader platform
Our sophisticated web-based platform is packed with features.
Open an account today
Experience award-winning platforms with fast and secure execution.
Economic calendar
Related articles

Bitcoin Forecast: BTC/USD Back to $80K Ahead of Warsh’s Jackson Hole Speech
After surging over $15,000 in the past 10 days alone, there is risk of a near-term pullback if Warsh says anything remotely hawkish at Jackson Hole - what are the levels to watch from here?


Bitcoin, Gold Price Outlook: US CPI & Overbought Risks in Focus
Bitcoin, Gold Price Outlook Following a steep risk-on rally across US equity indices and precious metals, several major markets are approaching critical technical levels as momentum becomes increasingly stretched.


Bitcoin, Dow Jones Outlook: Dow Tests Major Resistance and Bitcoin Lags Below $67,000
Bitcoin, Dow Jones Outlook: Bitcoin remains below $67,000 while the Dow Jones tests major multi-year resistance. Key technical levels that could determine the next market move.