


Crypto Technical Analysis Is new weakness starting to emerge?
During the last week of July, weakness has once again become evident across the cryptocurrency market. Over the last few sessions, several assets have started to mark new short-term lows, reinforcing the possibility of more consistent selling pressure.
Written by
Julian Pineda
Market Analyst
During the last week of July, weakness has once again become evident across the cryptocurrency market. Over the last few sessions, several assets have started to mark new short-term lows, reinforcing the possibility of more consistent selling pressure. Bitcoin, as the market’s reference cryptocurrency, has fallen back below the 64k area and, for now, has not shown enough demand strength to stabilize the broader market. If key level breaks continue to stand out, cryptocurrencies could keep facing a phase of indecision or weakness over the next few trading sessions.

Performance of the main cryptocurrencies
Source: Data - StoneX, Tradingview
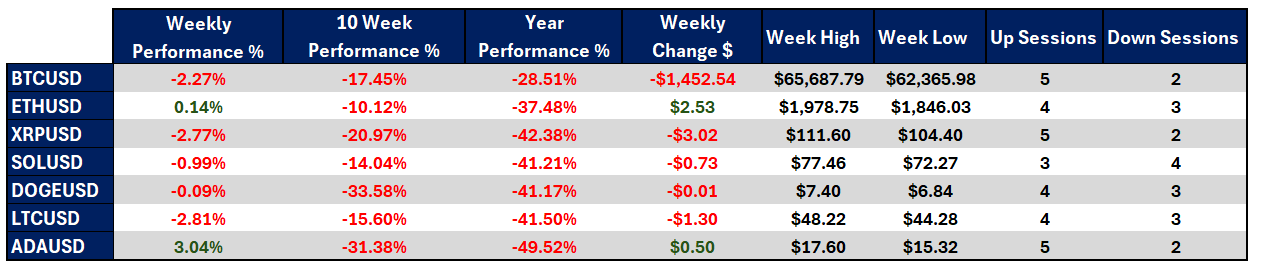
- During the week, mixed behavior once again stood out across the cryptocurrency market, although broader weakness became more evident. Litecoin, which had been one of the most stable cryptocurrencies in previous weeks, now shows a short-term decline of -2.81%, positioning itself as one of the weakest assets at the moment. In contrast, Cardano has been the only cryptocurrency with relevant gains during the week, rising more than 3.00%. However, this isolated move has not been enough to change the broader market perception, as most assets are once again showing signs of selling pressure.
- Over the last 10 weeks, weakness remains important across the main cryptocurrencies. All of them continue to show relevant declines, which indicates that medium-term selling pressure has not fully disappeared. In this area, ETH stands out with a decline of -10.12%, positioning itself as one of the most stable cryptocurrencies compared with others in the market, although it still reflects a significant price reduction. In contrast, Dogecoin remains one of the most affected assets, with a decline of -33.58%, showing that its accumulated weakness remains considerable. In general terms, the weakness bias remains relevant for the crypto market in the medium term.
- Year to date, the dynamic remains quite similar. None of the main cryptocurrencies has managed to move above its 2026 opening price, and the recent recovery still does not seem strong enough to drastically change the annual bearish trend. Cardano remains the weakest asset in this period, with a decline of -49.52%, despite its recent weekly recovery. Meanwhile, Bitcoin has tried to maintain greater relative stability, with a decline of -28.51%, although it has still failed to deliver a positive performance for the year. So far, the crypto market remains on track to close 2026 with significant losses.
- Bitcoin, which had tried to maintain strength in previous weeks, is once again showing short-term weakness. During the week, price lost around 1,400 dollars, failed to hold the 64k reference area and moved back toward the 60k bearish barrier. This dynamic shows that the reference cryptocurrency is still marking relevant lows, which could be affecting demand in the short term.
- In general terms, the market has failed to maintain the confidence seen in previous weeks and continues to show weakness and indecision. In addition, Bitcoin has not managed to lift the rest of the market, maintaining a sense of broad pressure that could continue to affect the recent recovery over the next few trading sessions.
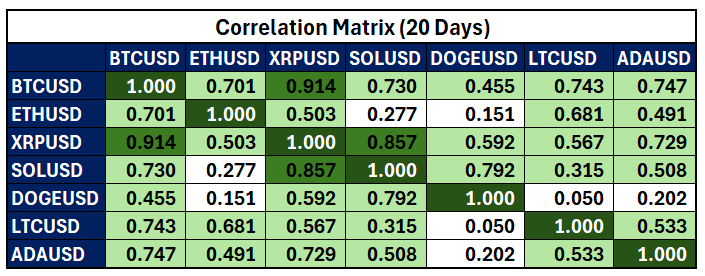
Colors from red to green – Red for negative correlations and green for positive correlations
Source: Data - StoneX, Tradingview
From a correlation perspective, the positive relationship between Bitcoin and the broader crypto market has started to recover. In previous weeks, coefficients near 0 suggested a weaker relationship between asset movements. However, by the end of this week, most coefficients have remained above 0.7, reflecting a relevant positive correlation with Bitcoin’s movements. It is important to remember that the correlation coefficient can change over time.
This relationship has returned to positive territory, showing that the dynamic affecting Bitcoin is also being reflected across the rest of the market. However, this is not necessarily a positive signal, as the reference cryptocurrency continues to show weakness and the broader market appears to be following the same trend. In this context, Bitcoin has not managed to stabilize a strength bias capable of lifting the sector as a whole, and the current dynamic appears to be concentrated in specific assets rather than in broad market confidence.
As a result, the broader outlook remains marked by weakness and indecision across the main cryptocurrencies. So far, not even the largest assets have managed to stand out with relevant strength, meaning this phase could remain important over the next few sessions, especially if confidence does not recover in reference cryptocurrencies such as BTC.
Bitcoin continues to respect the long-term tren
Source: StoneX, Tradingview
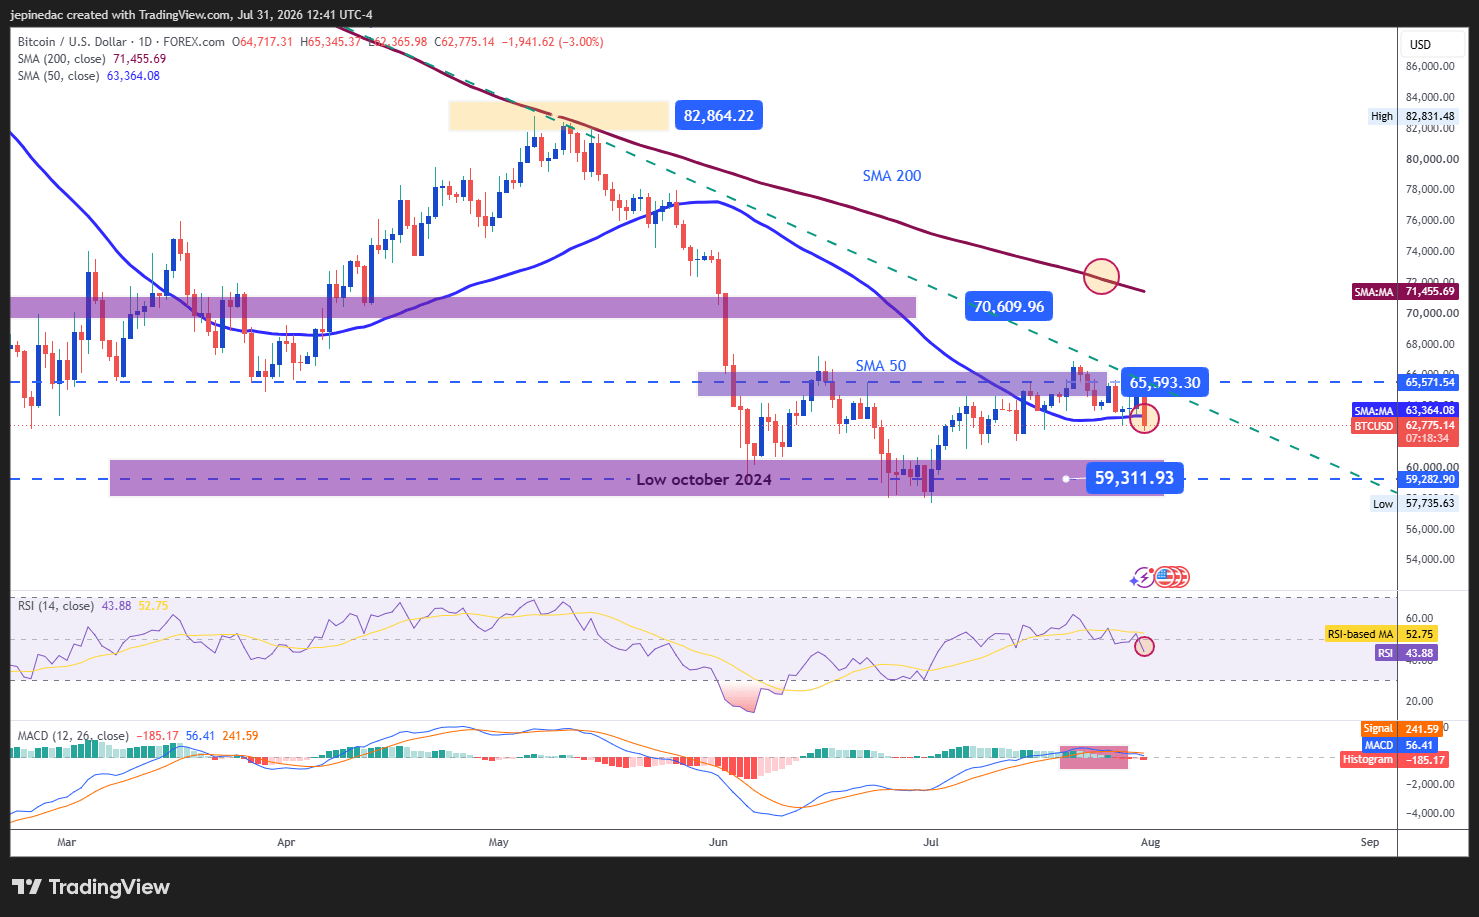
Although Bitcoin attempted to sustain a recovery in previous sessions and test the most relevant technical structure on the chart, the decline into the weekly close once again reflected selling pressure in line with the major bearish trend. If this behavior continues over the next few sessions, the bearish trend line could remain the most important technical pattern to watch and continue to act as the dominant structure on the chart over the coming weeks.
Indicators:
- At the moment, the MACD histogram remains close to the neutral 0 line, suggesting that the average strength of the moving averages still reflects a phase of indecision. However, the RSI shows a weaker picture, as it has fallen below the 50 level. This reading highlights a possible dominant selling impulse, which could remain relevant over the next few sessions.
Key levels:
- 70,600 USD – Important resistance: This recent high zone is positioned as the most relevant bullish barrier. This level coincides with the base marked by the long bearish trend line and also with the 200-period simple moving average. Moves toward this area could reactivate the buying bias and start putting the bearish structure at risk over the coming weeks.
- 65,600 USD – Near-term barrier: This level is starting to align with the 50-period simple moving average. This area has acted as a neutral reference for price. If Bitcoin fails to move clearly away from this level, a more important sideways phase could begin to stand out over the next few trading sessions.
- 59,300 USD – Definitive support: This area represents the October 2024 low and is close to important psychological levels. For now, it remains the most relevant bearish barrier. Consistent moves below this point could reactivate the selling bias seen in previous weeks, mark new yearly lows and extend the major bearish trend line on the daily chart as the dominant structure.
Ripple starts to approach yearly lows
Source: StoneX, Tradingview
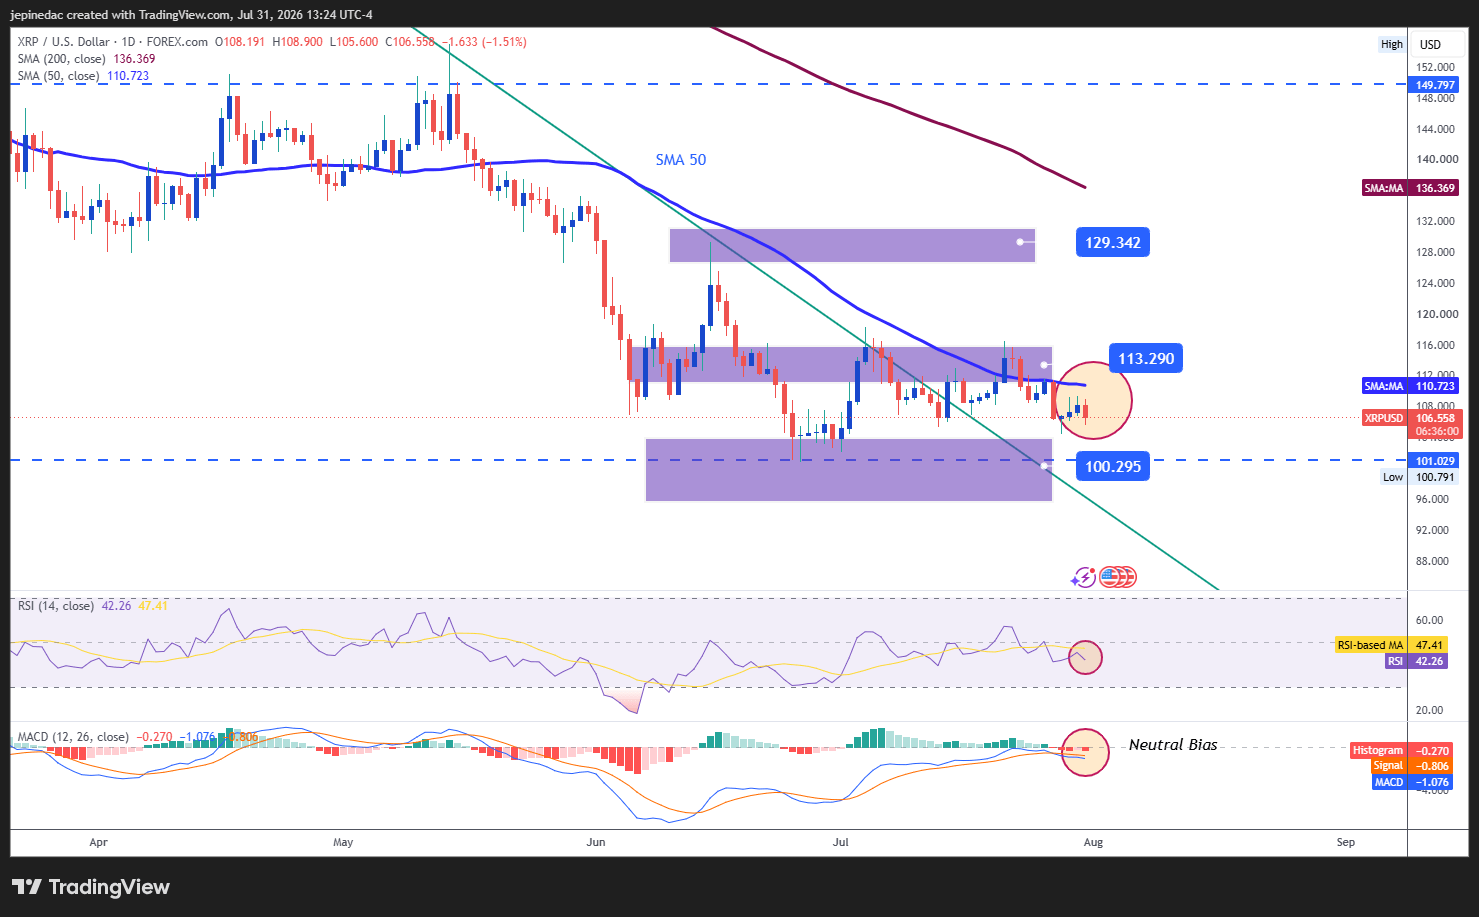
Ripple has not managed to maintain a clear sense of confidence and continues to show weakness, with a weekly decline near -2.7%. This behavior has once again highlighted a relevant selling bias on the chart, while price approaches important support areas. If weakness persists and price breaks key levels, selling pressure could gain more relevance and bring back the long bearish trend line that dominated the chart in previous weeks.
Indicators:
- The indicator dynamic is similar to what can be seen in Bitcoin. The MACD keeps its histogram near the neutral 0 area, reflecting a possible phase of indecision. However, the RSI has started to move below the 50 level, showing that the selling impulse could be gaining importance over the next few sessions.
Key levels:
- 129.342 – Important resistance: This level marks highs from previous weeks and remains the most important bullish barrier to watch outside the long bearish trend line. Price movements toward this area could put an end to the bearish trend as the dominant structure and open room for a more relevant buying bias over the coming trading weeks.
- 113.290 – Near-term barrier: This level coincides with the 50-period simple moving average and could act as a tentative reference in the event of possible short-term bullish corrections.
- 100.295 – Main support: This level corresponds to the relevant 2026 lows and is positioned as the main bearish barrier on the chart. Sustained moves below this point could bring the selling bias back into focus and reactivate the long bearish trend line as the dominant pattern over the next few sessions.
Written by Julian Pineda, CFA, CMT – Market Analyst
Follow him on: @julianpineda25
Latest market news











Web Trader platform
Our sophisticated web-based platform is packed with features.
Open an account today
Experience award-winning platforms with fast and secure execution.
Economic calendar
Related articles

Bitcoin Forecast: BTC/USD Back to $80K Ahead of Warsh’s Jackson Hole Speech
After surging over $15,000 in the past 10 days alone, there is risk of a near-term pullback if Warsh says anything remotely hawkish at Jackson Hole - what are the levels to watch from here?


Bitcoin, Gold Price Outlook: US CPI & Overbought Risks in Focus
Bitcoin, Gold Price Outlook Following a steep risk-on rally across US equity indices and precious metals, several major markets are approaching critical technical levels as momentum becomes increasingly stretched.


Bitcoin, Dow Jones Outlook: Dow Tests Major Resistance and Bitcoin Lags Below $67,000
Bitcoin, Dow Jones Outlook: Bitcoin remains below $67,000 while the Dow Jones tests major multi-year resistance. Key technical levels that could determine the next market move.