

Dollar Tests a Cliff’s Edge as Gold Challenges $3,870 Support
Dollar, Gold Outlook: The dollar is testing a critical 10-month trendline, while gold is challenging its 2026 low and support near $3,870. The U.S. elections, nonfarm payrolls and bond yields are key volatility catalysts to watch this week.
Written by
Razan Hilal
Market Analyst
U.S.–Iran negotiations and escalating conflict have been ongoing for more than eight months now, weighing on inflation and economic conditions around the world. This week, the negotiations coincide with the U.S. midterm elections, a notable pullback in crude oil from resistance near its 2026 highs, and oversold conditions across risk assets. Together, these factors raise the possibility of near-term developments in the Middle East conflict.
On the other hand, Friday’s U.S. nonfarm payrolls report could reinforce the bullish outlook on the US Dollar Index chart and the expectations for a December rate hike, currently above 70% according to CME FedWatch, if the data exceeds forecasts. A weaker-than-expected reading could complicate the outlook, weighing on the dollar and easing immediate pressure on markets from rate-hike expectations.
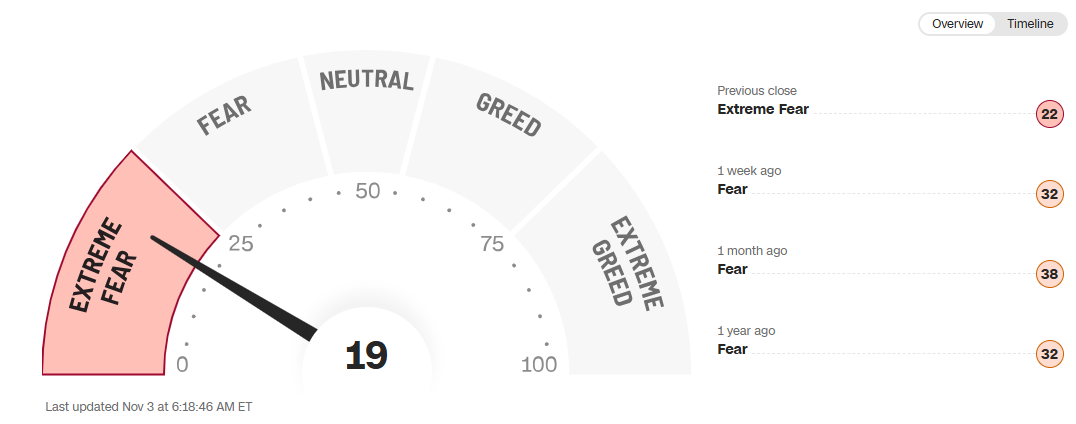
CNN Fear & Greed Index
Source: CNN
Overall market risk sentiment remains tilted toward fear, but the CNN Fear & Greed Index should not be viewed as a leading market indicator. Instead, its current reading draws attention to bearish setups that may be approaching key reversal points, particularly alongside oversold momentum conditions.
I recently covered a weekly chart overview in the following video
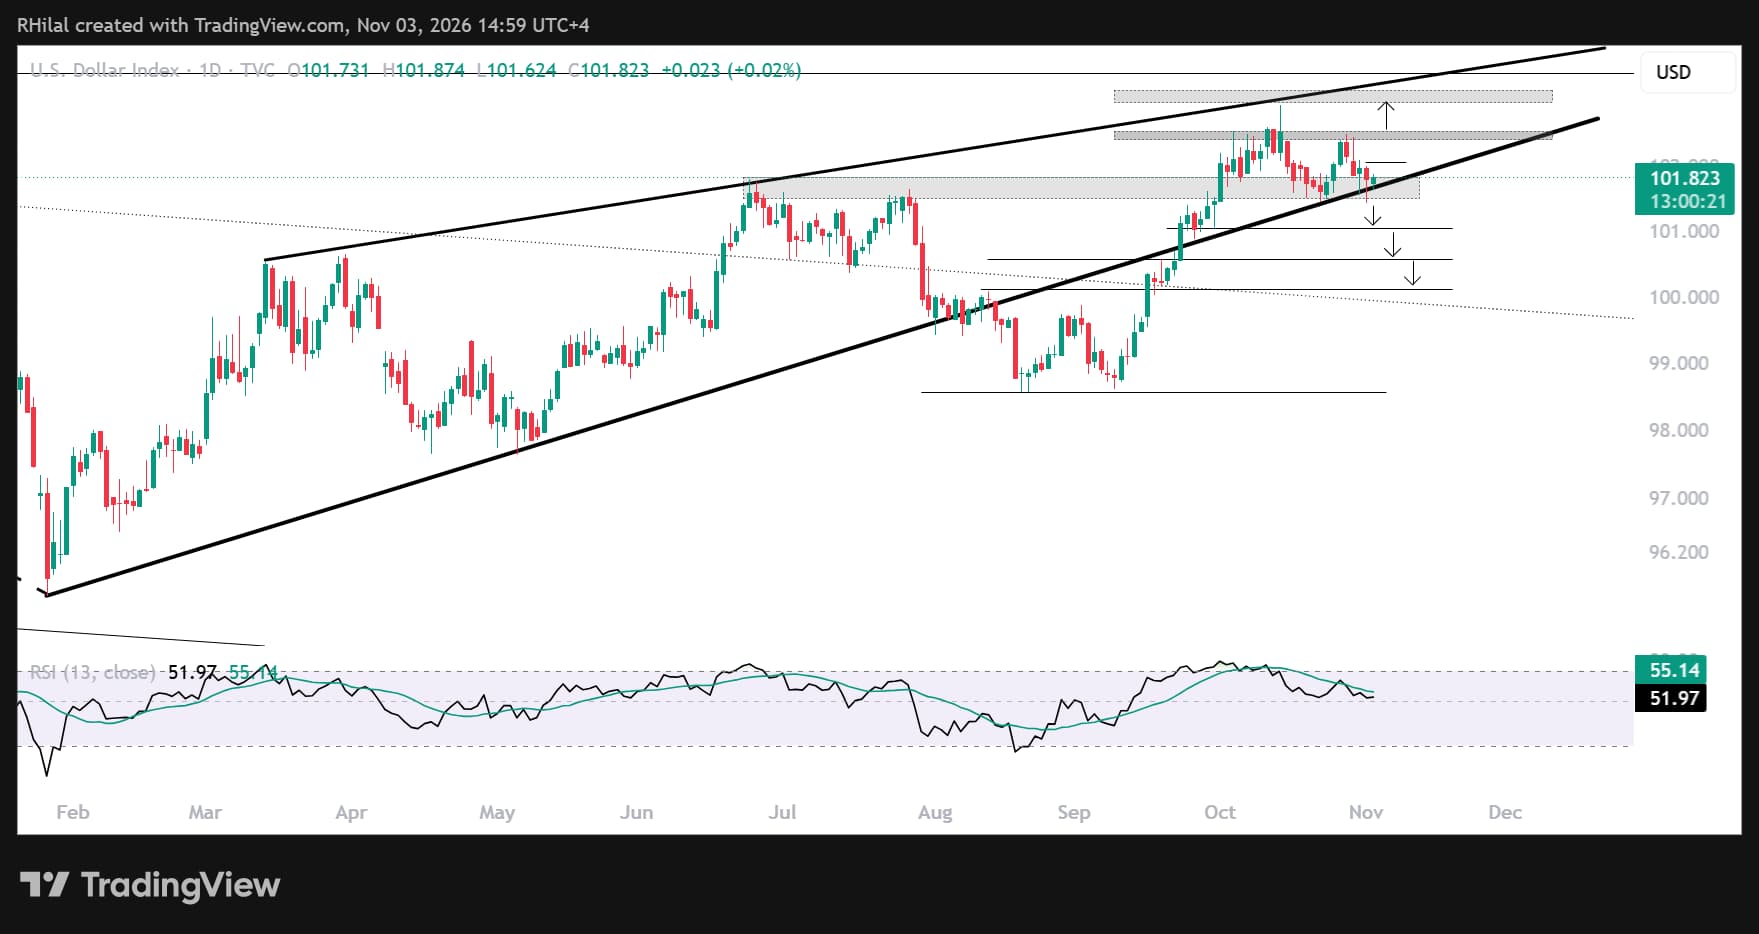
DXY Outlook: Daily Time Frame – Log Scale
Source: TradingView
The DXY is testing a critical support area defined by:
- A 10-month uptrend that has acted as both support and resistance during the 2026 advance
- The June–July resistance zone, now acting as support
- Daily RSI retesting the neutral 50 level from above
- The 27.2% Fibonacci retracement of the September–October advance, near 101.40
A breakdown below this confluence could shift the outlook toward bearish, bringing 101, 100.50 and the psychological 100 level into focus as key supports. A sustained move lower would confirm a longer-term bearish shift and could support a recovery in major currencies and precious metals.
On the upside, holding above 101.40 and reclaiming 102 and 102.60 would bring the eight-month rising resistance near 103.40 into focus. This trendline connects higher highs since March 2026 and represents a key barrier before a longer-term bullish continuation could be confirmed, potentially putting further pressure on markets.
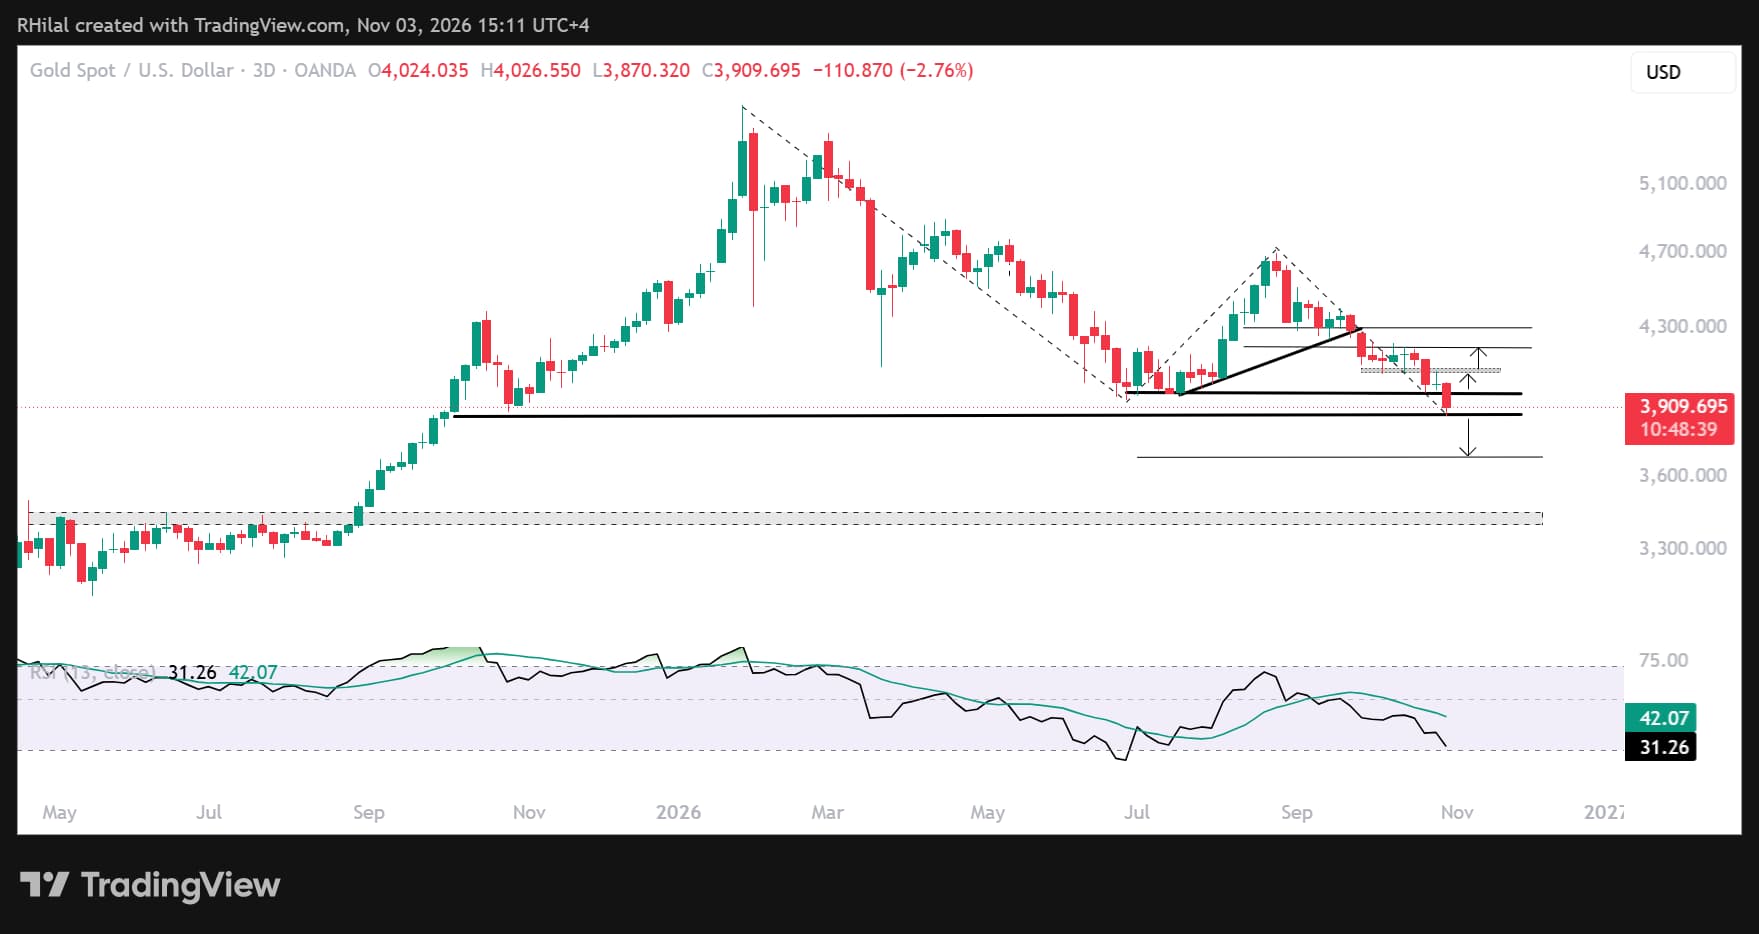
Gold Outlook: Daily Time Frame – Log Scale
Source: TradingView
On the daily chart, gold is trading near a critical support zone defined by:
- Support from October 2025
- Daily oversold conditions last seen in 2023
- Silver’s oversold conditions last seen in 2022
- The 50% Fibonacci extension of the January–June–August cycle, near 3,870
A breakdown below 3,870 would expose the next key Fibonacci extensions near 3,680 and 3,400. This steep decline could bring gold back toward the multi-month resistance zone from 2025.
On the upside, 3,970 is a key resistance. A move above this level could signal a bullish reversal. Further closes above 4,100, 4,200 and 4,300 would strengthen the case for longer-term bullish continuation.
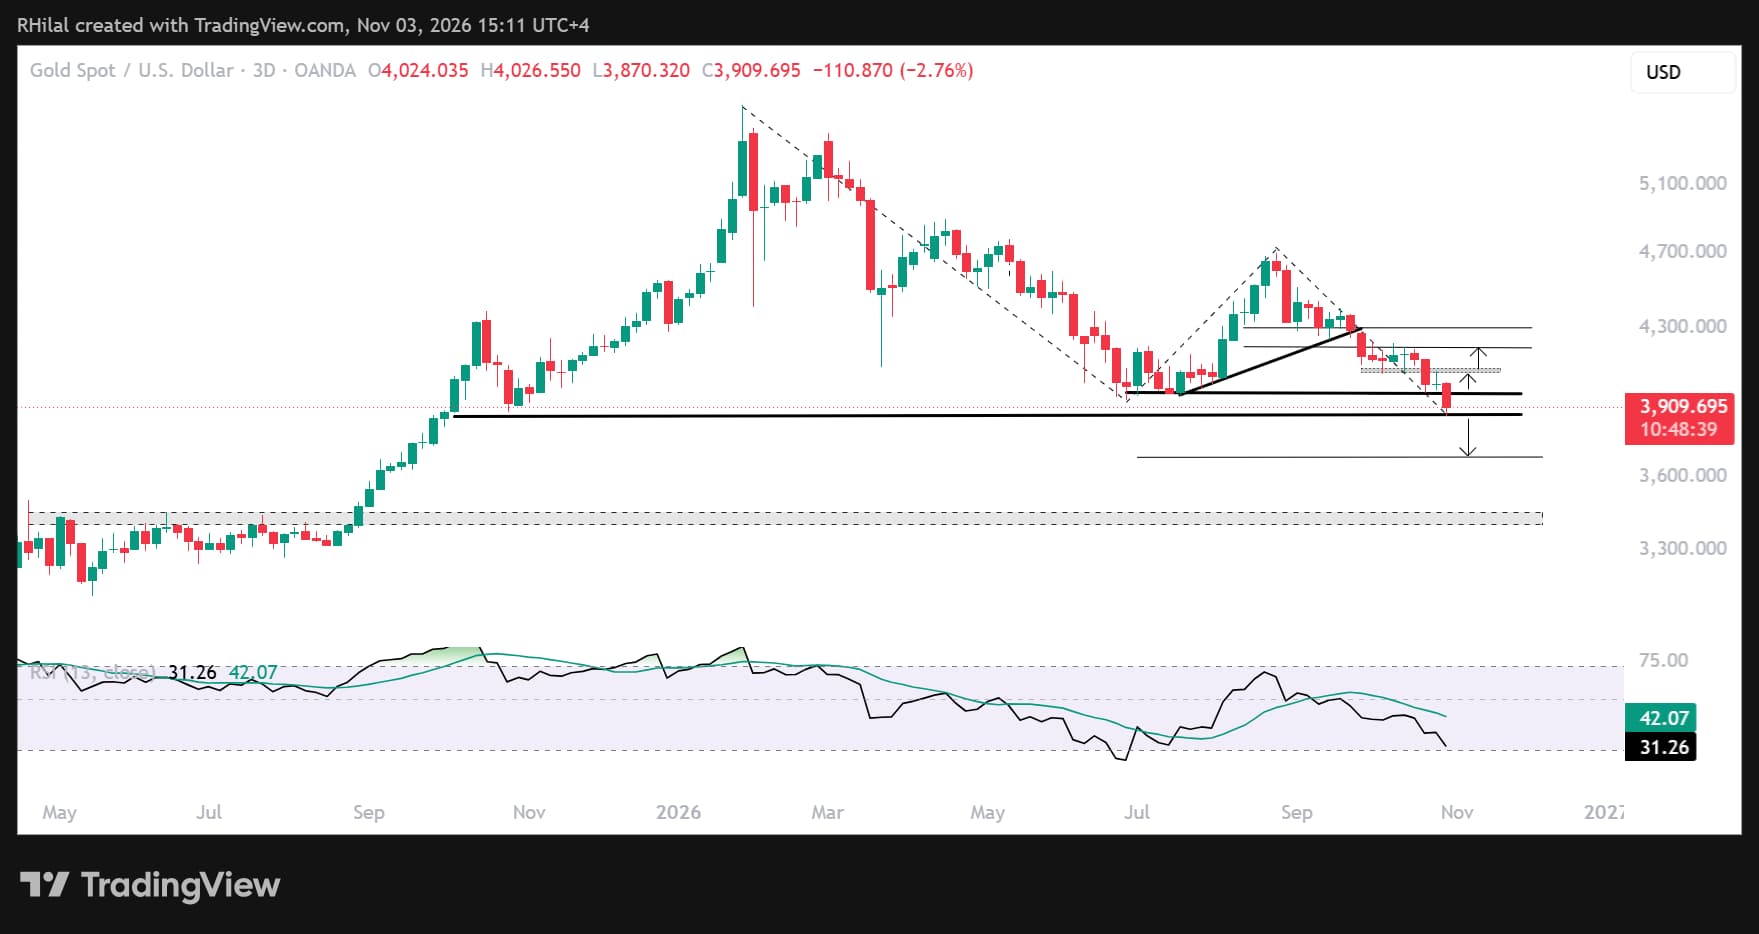
Gold Outlook: Six-Month Time Frame – Log Scale
Source: TradingView
On the six-month chart, gold found support this year near the psychological 4,000 level and the 27.2% retracement of the 1920–2026 advance. With this barrier now broken, the next key Fibonacci retracement near 38.2% is in focus, increasing the risk of a decline toward 3,400. That level aligns with the previously mentioned multi-month resistance, which could act as support if approached from above.
A recovery above the 4,000–4,100 zone would increase confidence in longer-term bullish continuation toward record highs.
Written by Razan Hilal, CMT
Follow on X: @Rh_waves
Related tags:
Latest market news







Web Trader platform
Our sophisticated web-based platform is packed with features.
Open an account today
Experience award-winning platforms with fast and secure execution.
Economic calendar
Related articles

USD/JPY Weekly Outlook: AI earnings could overshadow the Fed and BoJ
AI sentiment has become a major driver of US Treasury yields and USD/JPY. With Microsoft, Alphabet and Amazon reporting this week, central bank decisions may have competition for traders' attention.


Gold and S&P 500 analysis: What now after Warsh’s hawkish speech?
The dollar surged across the board after the Fed Chair Kevin Warsh surprised with a hawkish-leaning speech at the Jackson Hole summit. All the bearish dollar bets that had been accumulated since last Friday on the back of data weakness and bond market troubles had to be squared and that triggered a short squeeze rally for the dollar. Gold and silver dropped, as a result, as too did bitcoin, while US indices were giving back earlier gains.


Bitcoin Forecast: BTC/USD Back to $80K Ahead of Warsh’s Jackson Hole Speech
After surging over $15,000 in the past 10 days alone, there is risk of a near-term pullback if Warsh says anything remotely hawkish at Jackson Hole - what are the levels to watch from here?
