

DXY GBP/USD, USD/CAD Weekly Technical Outlook
DXY, USD/CAD and GBP/USD face key inflection levels as central-bank decisions and inflation data drive breakout risk.
Written by
Michael Boutros
Sr. Technical Strategist
Weekly Technical Trade Levels on DXY, GBP/USD & USD/CAD
US Dollar Price Chart – USD 240min (DXY)
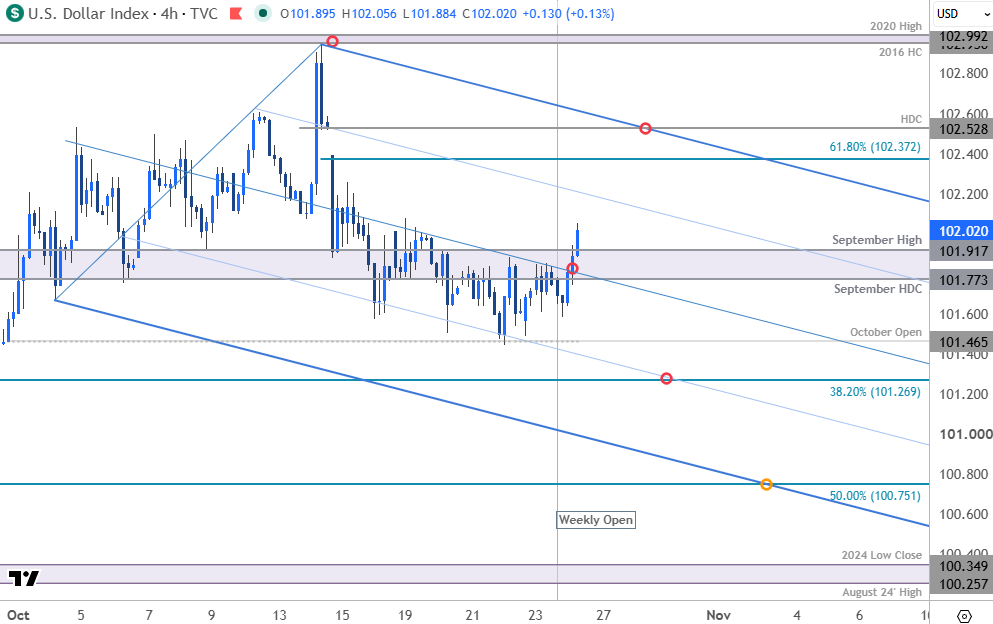
Chart Prepared by Michael Boutros, Sr. Technical Strategist; DXY on TradingView
Note: The US Dollar Index has declined more than 1.4% off the yearly highs after a strong 4.4% rally from the September low. The pullback rebounded off monthly open support last week at 101.46 with the recovery now attempting to break above the median-line of the monthly pitchfork. Resistance is eyed at the 61.8% retracement of the October range at 102.37 with a breach / close above the year high-day close at 102.53 needed to fuel another run at the highs. Key resistance remains unchanged at the 2016 high-close (HC) and the 2020 swing high at 102.95/99.
A break below the October lows would threaten a larger correction within the yearly uptrend with subsequent support objectives seen at the 38.2% retracement of the August advance at 101.27 and the 50% retracement at 100.75.
Bottom line: The focus is on this recovery off the monthly low and whether the bulls can reassert control. From a trading standpoint, rallies would need to be limited to 102.52 IF price is heading for a deeper correction here with a close below 101.47 needed to fuel he next leg of the correction.
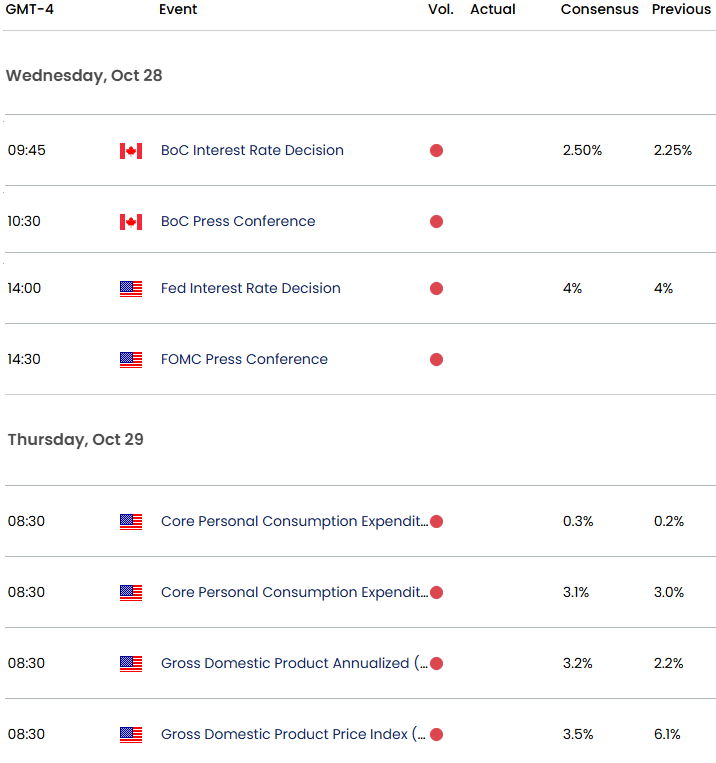
The U.S. dollar enters a pivotal week with the Federal Reserve decision on Wednesday at the center of the calendar. Markets are heavily positioned for a hold, with current pricing implying roughly a 90% probability that the Fed leaves rates at 3.75%–4.00%. The focus will be on Chair Kevin Warsh’s guidance and whether policymakers keep the door open to another hike in December, with third-quarter GDP and September PCE inflation due Thursday to shape that outlook further. A hawkish Fed message or firm inflation data would reinforce the dollar’s near-term support, while a softer policy signal could leave the recent advance vulnerable to a deeper pullback.
British Pound Price Chart – GBP/USD 240min
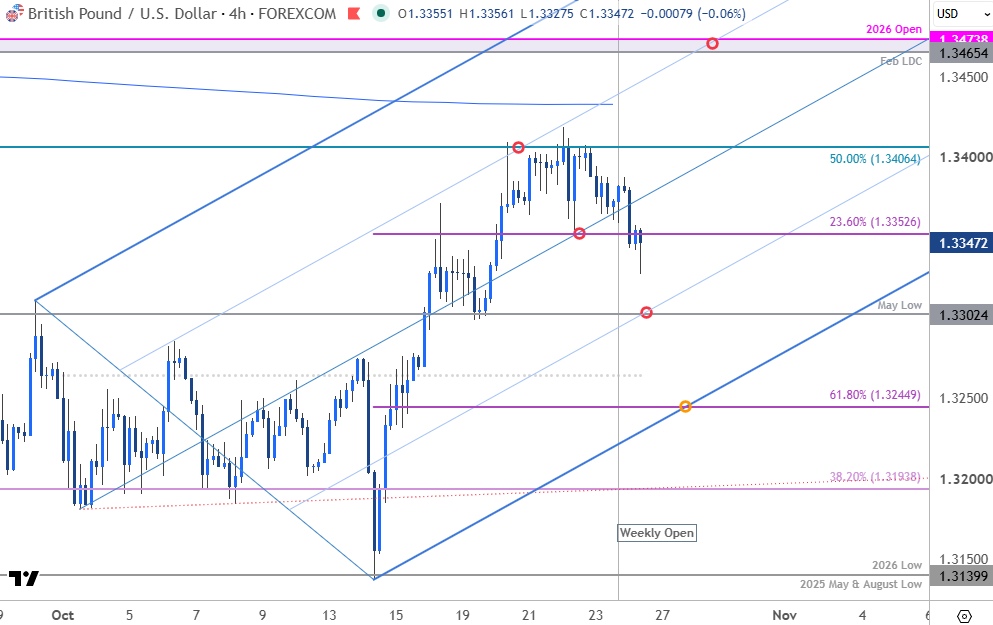
Chart Prepared by Michael Boutros, Sr. Technical Strategist; GBP/USD on TradingView
Notes: Sterling has rallied more than 2.1% off the monthly lows with the rally exhausting into resistance last week at the 50% retracement of the August decline at 1.3406. Price slipped below the median-line into the Sunday open with the bears attempting to break the 23.6% retracement of the monthly range today at 1.3353- watch the daily close with respect to this level.
Support rests at the May low which converges on the 25% parallel near 1.33 over the next few days. Broader bullish invalidation now rests at the 61.8% retracement at 1.3245 and a break / daily close below this zone would be needed to fuel another run at the lows with critical support unchanged at 1.3194.
A topside breach above 1.3406 is needed to mark uptrend resumption with subsequent resistance objectives eyed at the 200-day moving average (currently near ~1.3433) and the February low-day close (LDC) / 2026 yearly open at 1.3465/74- look for a larger rection there IF reached for guidance. The next major technical considerations are eyed at the July high at 1.3558 and the 61.8% retracement at 1.3590.
Bottom line: Sterling is at risk for a deeper setback within the monthly uptrend heading into the start of the week. From a trading standpoint, losses should be limited to 1.33 IF price is heading higher on this stretch with a breach / daily close above 1.3406 needed to fuel the next leg of the advance. The U.K. Budget is due on Wednesday, but the Fed / PCE report will likely remain the primary catalysts this week.
Canadian Dollar Price Chart – USD/CAD 240min
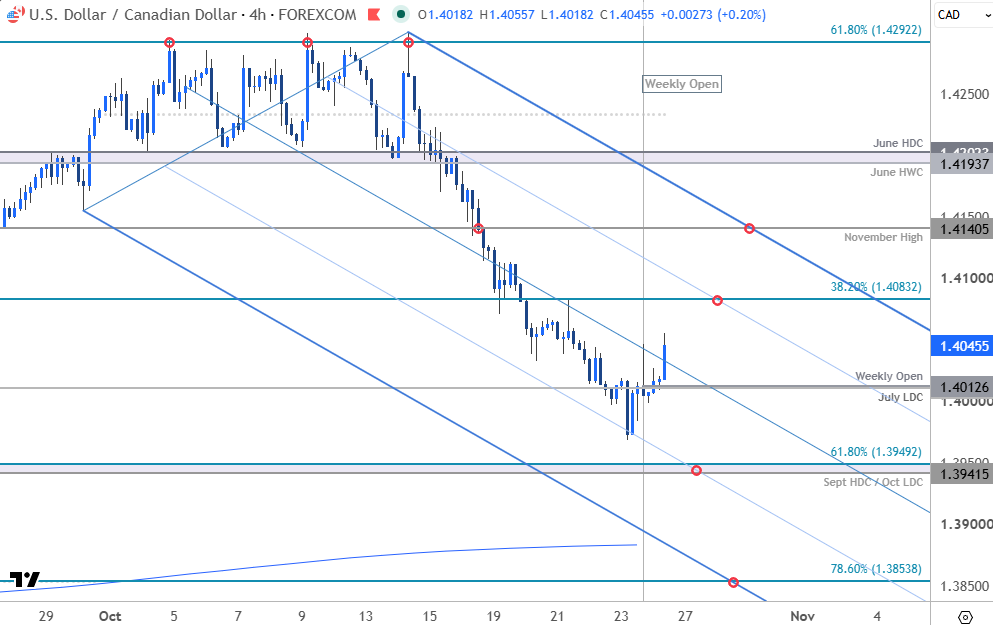
Chart Prepared by Michael Boutros, Sr. Technical Strategist; USD/CAD on TradingView
Technical Outlook: USD/CAD plunged more than 2.3% off the monthly highs with price unable to mark a daily close below the July low-day close last week. I adjusted this slope after today’s webinar, but the lateral levels remain unchanged. Initial resistance is eyed at the 38.2% retracement of the August advance at 1.4083 with near-term bearish invalidation at the November highs at 1.4141. This level converges on the upper parallel later this week and strength surpassing this slope would be needed to suggest a more significant low is in place, and a larger reversal is underway.
Weekly open support converges on the July low-day close (LDC) at 1.4011/12 with key support steady at 1.3942/49- a region defined by the 2025 September high-day close (HDC) / October low-day close (LDC) and the 61.8% retracement. Note that the 25% parallel converges on this level over the next few days and a break / close below would be needed to fuel the next major leg of the decline. Subsequent support rests with the 200-day moving average and the 78.6% retracement at 1.3854.
Bottom line: USD/CAD is rebounding ahead of major event risk this week with the Bank of Canada & Federal Reserve rate decisions on tap Wednesday and the US inflation report on Thursday. From a trading standpoint, rallies would need to be limited to 1.4083 IF price is heading lower on this stretch – look for a larger reaction on a test of 1.3942/49 IF reached with a close below this pivot zone needed to mark resumption of the October downtrend.
Economic Calendar – Key Data Releases
--- Written by Michael Boutros, Senior Technical Strategist
Follow Michael on X @MBForex
Latest market news











Web Trader platform
Our sophisticated web-based platform is packed with features.
Open an account today
Experience award-winning platforms with fast and secure execution.
Economic calendar
Related articles

USD/JPY Weekly Outlook: AI earnings could overshadow the Fed and BoJ
AI sentiment has become a major driver of US Treasury yields and USD/JPY. With Microsoft, Alphabet and Amazon reporting this week, central bank decisions may have competition for traders' attention.


Nasdaq 100 Forecast: NDX slips ahead of Fed Chair Warsh’s speech
U.S. stocks are edging lower on Friday, giving back some of yesterday's gains after Nvidia's strong outlook revived the tech trade. The focus has now shifted firmly to Fed Chair Kevin Warsh's Jackson Hole speech, with investors looking for more clarity on the outlook for interest rates.


EUR/USD forecast: All eyes on Warsh at Jackson Hole - Forex Friday
For much of this week, the EUR/USD has been edging lower with the US dollar regaining some ground after last week’s sell-off that was triggered, in part, by the bond market worries. Investors have been unwilling to bet further against the US dollar so far this week ahead of Kevin Warsh’s keynote speech at the Jackson Hole summit, due later today.
