


Gold and Silver Price Forecast: US Dollar Rally Threatens Fresh 2026 Lows
Gold and Silver Price Forecast: Gold and Silver face mounting downside risks as the US Dollar Index tests a breakout above 101.20 and Fed rate hike expectations climb above 50%. Explore key scenarios
Written by
Razan Hilal
Market Analyst
Gold and Silver are facing increasing downside risks as the US Dollar Index and Federal Reserve rate hike expectations continue to gain bullish traction.
Key Events
- The US Dollar Index (DXY) is testing a potential bullish breakout above the 101.20 level. Full insight here:USDJPY, GBPUSD Price Outlook: Breakout Risks Rise as DXY Tests 101.20
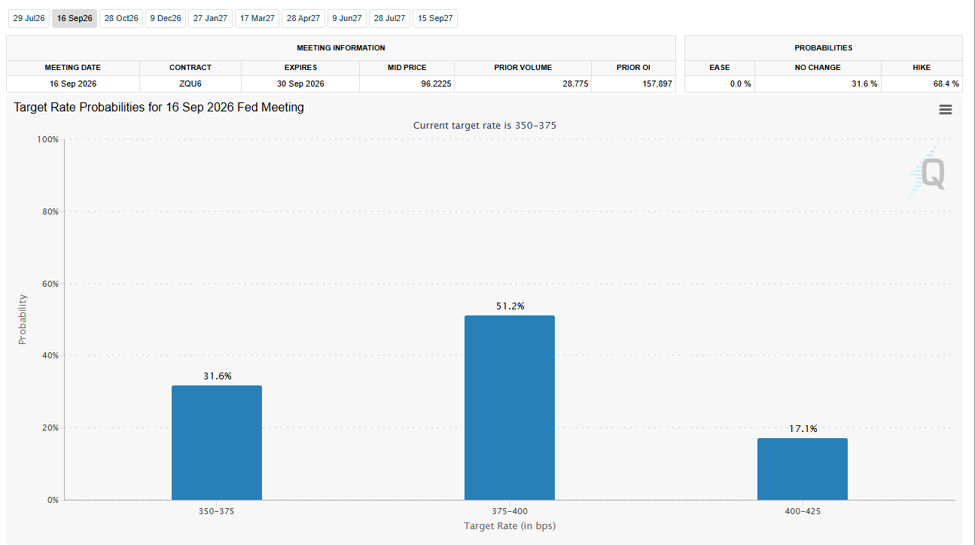
- CME FedWatch Tool expectations for a September rate hike have risen above 50%.
- Gold and Silver are approaching their 2026 lows at 4,020 and 61, respectively. A break below these levels could open the path toward major historical support zones. You can follow this analysis live in the Daily MENA webinar: Register here
- USD/JPY, often a leading indicator among major US Dollar pairs, is testing a multi-decade resistance level that could confirm further dollar strength and potentially drive Gold and Silver to fresh lows before longer-term bullish opportunities re-emerge. Full insight here: USDJPY Price Forecast: Could a Hawkish Fed Trigger a Breakout Toward 180?
- Geopolitical and macroeconomic developments continue to influence precious metals. Inflation and liquidity concerns have encouraged profit-taking and slowed physical gold demand. In May 2026, Indian Prime Minister Narendra Modi publicly urged citizens to postpone non-essential gold purchases for approximately one year amid concerns over rising oil prices, pressure on foreign exchange reserves, and rupee weakness. This may have contributed to the bearish narrative dominating Gold and Silver since March 2026.
CME FedWatch Tool
Source: CME
Following Warsh's meeting, expectations have increasingly shifted toward a 25-basis-point Federal Reserve rate hike, which would raise the benchmark rate from 3.75% to 4.00%.
As a result, 2-year US Treasury yields are testing new 2026 highs, while 10-year and 30-year yields continue to lag. This divergence suggests strengthening short-term bullish momentum for the US Dollar, although it does not necessarily indicate a long-term trend shift.
Key Levels to Watch
Gold
- Support: 4,090 – 4,020 – 3,930
- Resistance: 4,220 – 4,370
Silver
- Support: 61.00
- Resistance: 64.50 – 67.00
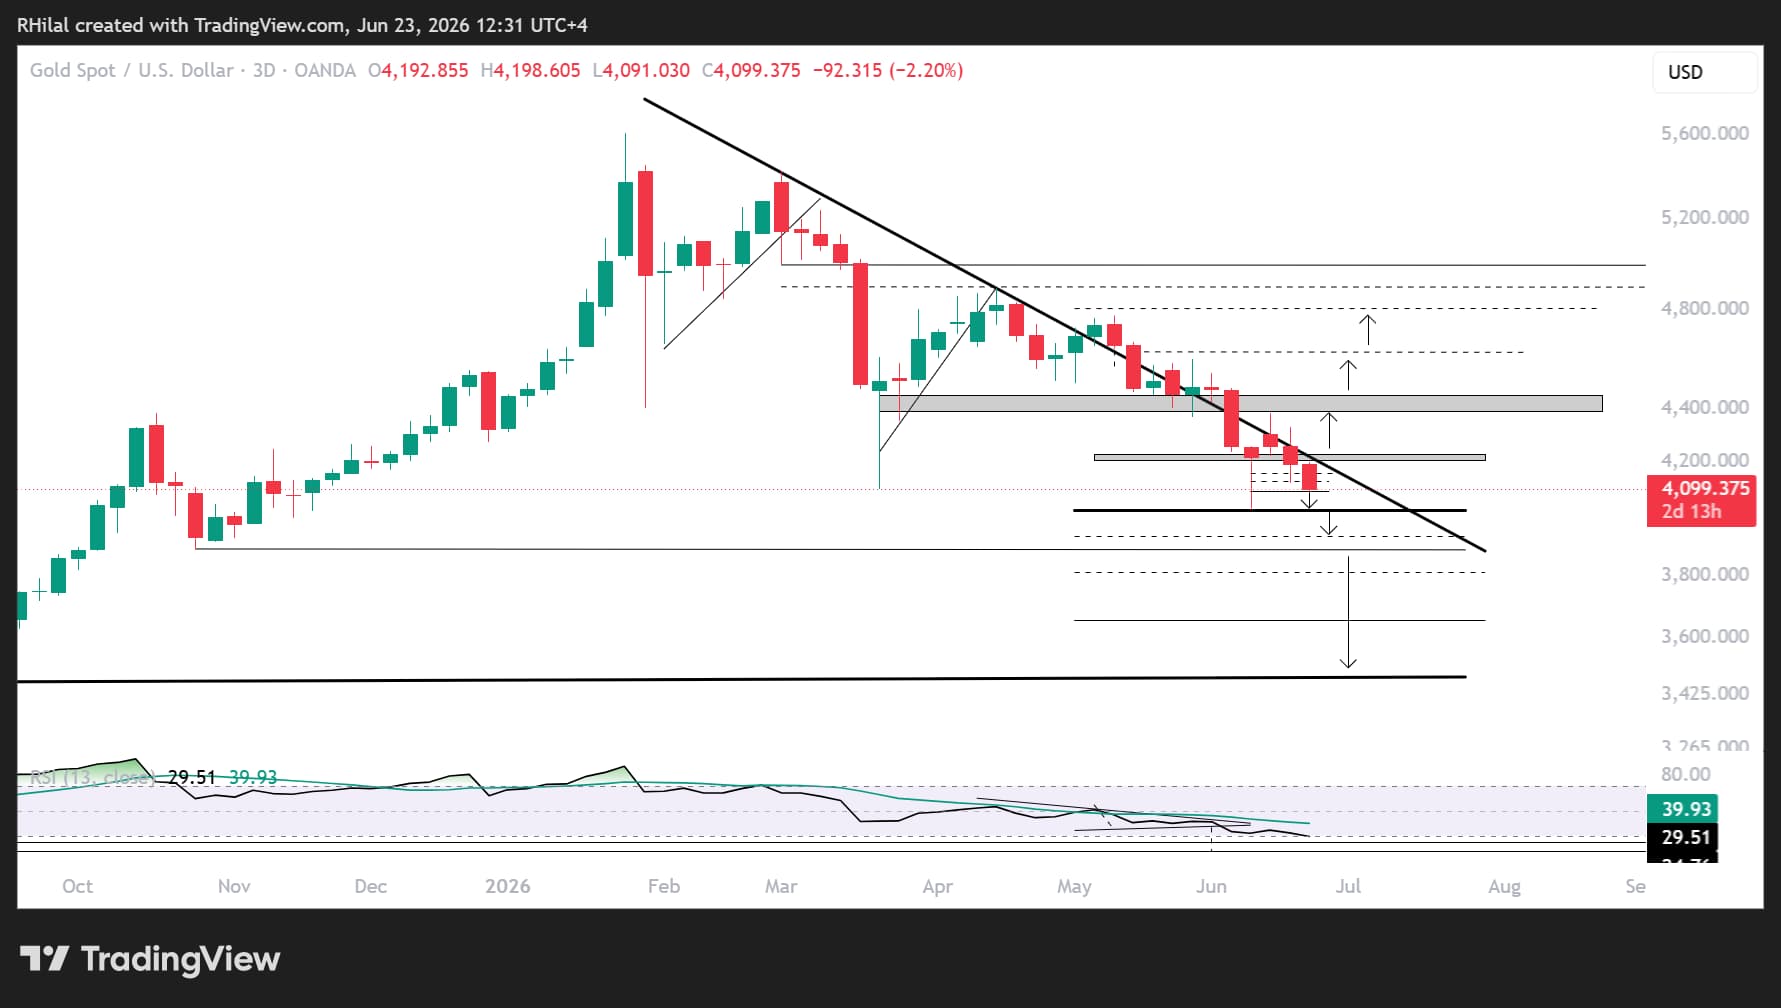
Gold Price Forecast: 3-Day Time Frame (Log Scale)
Source: TradingView
Gold is currently trading near support at 4,090, derived from the 50% Fibonacci extension of the move between the May 29 high (4,595), June 11 low (4,020), and June 17 rebound high (4,382).
Should bearish momentum accelerate, the next major support level is the 2026 low at 4,020, which aligns with the 61.8% Fibonacci extension. While this level could trigger another rebound, a sustained breakdown may expose deeper downside targets at:
- 78.6% extension: 3,930
- 100% extension: 3,810
- 127.2% extension: 3,650
- 161.8% extension: 3,460 (potential target)
The latter also coincides with a major multi-month resistance zone from 2025, potentially turning into a key support for long term bullish positioning.
On the upside, Gold must break above the descending trendline that has capped prices since March 2026 to confirm a bullish reversal. Key resistance levels remain at 4,220 and 4,370.
Silver Price Forecast: Daily Time Frame (Log Scale)


Source: TradingView
Silver remains under pressure near its yearly low at 61.00, a level that aligns closely with the 61.8% Fibonacci extension of the swing between the May 25 high, June 11 low, and June 17 rebound.
Should selling pressure intensify, the following downside targets come into focus:
- 78.6% extension: 57.80–58.00
- 100% extension: 54.00
- 127.2% extension: 49.00–50.00 (previous resistance since 1980)
The latter zone corresponds with a major multi-decade resistance area dating back to the 1980 peak, making it a technically significant target, potential long term accumulation zone.
From a momentum perspective, Silver appears to be breaking below a potential head-and-shoulders formation. If confirmed, the pattern's measured move could align with deeply oversold conditions last seen in 2020, creating another potential long-term accumulation opportunity for investors.
On the upside, Silver would need to reclaim resistance levels at 64.50, 67.00, and ultimately 71.30 to shift the outlook back toward a more constructive bullish bias.
Written by Razan Hilal, CMT
Follow on X: @Rh_waves







Web Trader platform
Our sophisticated web-based platform is packed with features.
Open an account today
Experience award-winning platforms with fast and secure execution.
Economic calendar
Related articles

Gold and S&P 500 analysis: What now after Warsh’s hawkish speech?
The dollar surged across the board after the Fed Chair Kevin Warsh surprised with a hawkish-leaning speech at the Jackson Hole summit. All the bearish dollar bets that had been accumulated since last Friday on the back of data weakness and bond market troubles had to be squared and that triggered a short squeeze rally for the dollar. Gold and silver dropped, as a result, as too did bitcoin, while US indices were giving back earlier gains.


Gold Pullback Risk Builds as AUD/USD and USD/CAD Set Up
Gold has stalled near major resistance after a powerful rally, while AUD/USD looks stretched and USD/CAD attempts to extend its rebound.


Gold Falters at Resistance, Grappling With PCE, Month-End Flows and Jackson Hole
Gold has pulled back from resistance after sticky PCE data, with month-end flows and Jackson Hole now shaping the near-term outlook.