


Gold Flies, USD Smashed on Increased Treasury Buybacks
It was a singular shock that drove a large move across a wide swath of markets this morning as the US Treasury took a step towards averting a debt spiral that had started to gain speed.
Written by
James Stanley
Sr. Strategist
USD Talking Points:
- The USD is dropping fast to fresh lows following the morning announcement of increased Treasury buybacks of long-term US debt.
- Risk had begun to build and stocks were somewhat weak over the past couple days as worries mounted around sliding bond prices and surging yields, and with a significant amount of Treasury debt maturing in the next twelve months the prospect of greater supply hitting the market was a very real fear.
- As illustrated by this surprise announcement, fighting against US Treasury Secretary Scott Bessent can be like swimming upstream.
- Gold was a large beneficiary of the announcement, and the metal is vying for a push back-above the $4500 level.
Scott Bessent has a wide and storied career in financial markets, and his experience with macro and currency is top-notch. He was, after all, part of the Quantum team along with George Soros that broke the Bank of England now more than 30 years ago. His role today, however, is on the part of the government and while he inherited a seemingly untenable situation, he made a big move today to avert what seemed to be an oncoming disaster.
The facts: After years of low rates and ballooning government debt a simple move higher in Treasury yields meant the cost of re-funding that debt, of paying off incoming principal, was going to be significantly higher. This would require more debt, which would add even more supply and, in-turn, higher yields. This becomes a circular situation as more supply and lower prices means even higher yields and, eventually, debt service grows to the degree that the government is impaired. And while we’re not quite at that stage yet, a US government that’s only continued to increase borrowing since the Financial Collapse and, to a greater degree since Covid, the risk is on the horizon.
It is perhaps simplest to think of this from the perspective of the investor. If you have capital to invest and one of the options is a 30-year bond yielding 5% (or thereabouts) and inflation is running at 3.4%, while the central bank has shown little willingness in hiking rates to stem that inflation – what’s the point of sitting in that bond? A meager 1.6% real rate of return could be enough, arguably for some situations, but we have to add in the more important component and that’s one of expectation for supply.
If there’s the wide expectation that more supply will come online down the road, which would spell even lower prices, all factors held equal, well, now your 5% bond is also at risk of principal losses. Not a great scenario to be caught in. So – what will you do? Accept the 1.6% real rate of return with a very realistic prospect of losing 10 or 20% of your principal as debt issuance expands to longer-term debt? Or, will you sell and re-invest the capital elsewhere, such as that booming AI trade that’s continued to run?
This is like the relationship that shows across financial markets but for many players such as global governments the option of buying NVDA v/s T-bonds isn’t a real choice. And, instead, they’ll simply take on less maturity risk by buying 30 or 90-day T-bills. And considering how flat the yield curve is right now with 3-month T-bills yielding around 3.7%, it’s not like they’re missing out on much as any additional yield for longer duration would be offset by the risk of lower prices in a higher rate backdrop.
This is, inevitably, the kick the can down the road approach but it’s what’s worked so far, as former US Treasury Secretary Janet Yellen made a similar move in October and November of 2023 by paying off maturing long-term debt with larger issuances of short-term debt.
This eases investors’ nerves about holding long-term US debt, at least for now, when the Treasury will invariably be in a position where it will need to sell some of that debt, albeit probably in smaller quantities than initially thought.
USD
As looked at in yesterday’s webinar there was a build of bearish structure in the currency, and since that session DXY went up for a re-test of ‘r1’ resistance, and that’s been followed by a significant sell-off to fresh two-month lows.
The move has shown visibly across FX majors but perhaps cleaner in EUR/USD, despite a sizable break in USD/JPY.
US Dollar Four-Hour Chart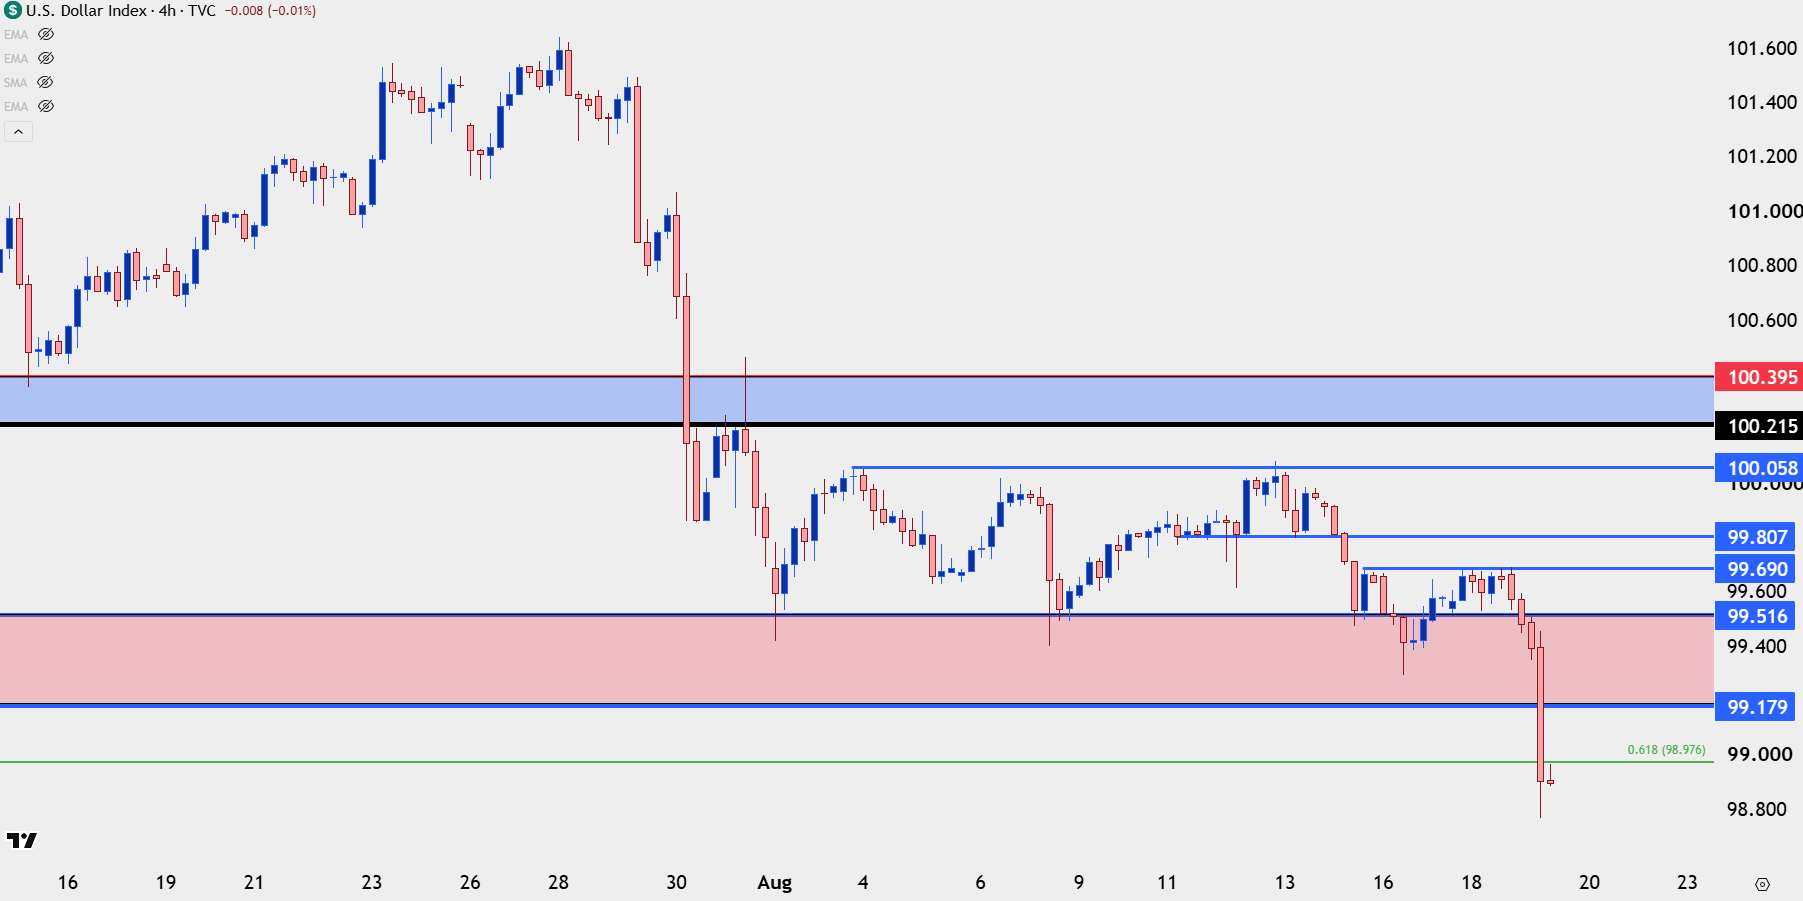
Chart prepared by James Stanley; data derived from Tradingview
EUR/USD
EUR/USD is already up to that next zone of resistance of 1.1669 and the bullish continuation theme has been clean, following the test at the top of prior resistance of 1.1613, followed by higher-low support around prior resistance of 1.1575.
At this point that 1.1613 resistance level now becomes support potential for pullbacks.
EUR/USD Four-Hour Chart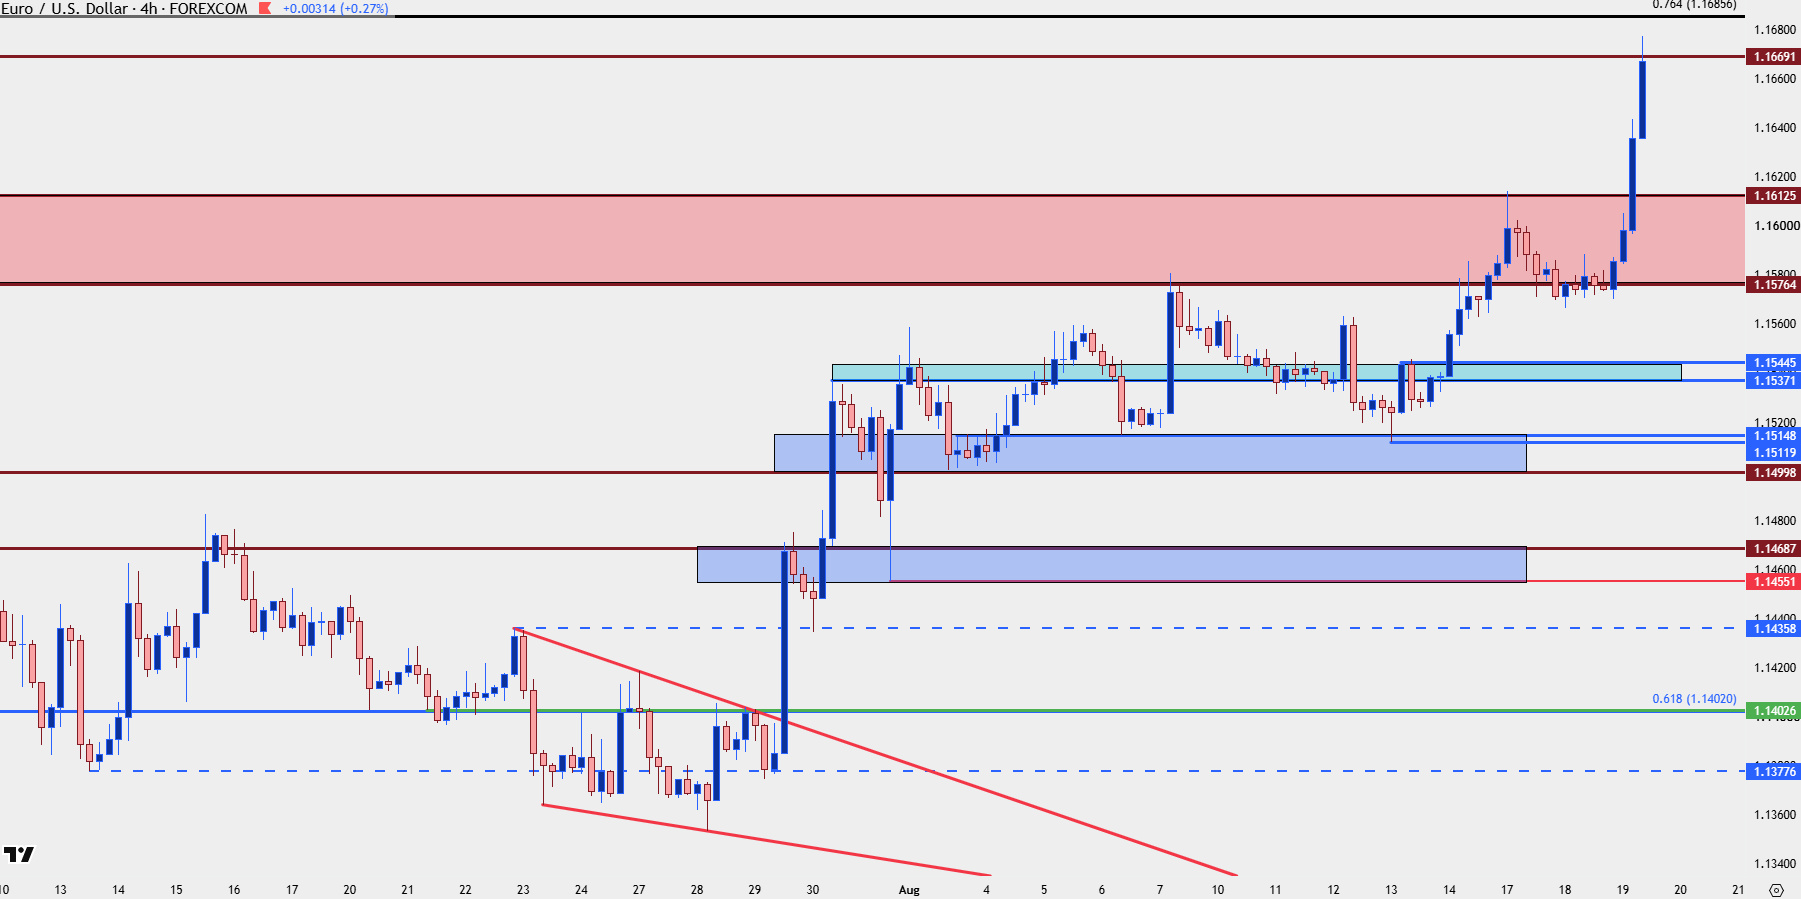
Chart prepared by James Stanley; data derived from Tradingview
USD/JPY
This is still the big one, in my opinion, and we’re in the early innings here. The initial reaction after the announcement was bearish and there was even a follow-through bounce that was faded with the pair setting another fresh low.
But at this point the larger fear of carry unwind hasn’t seemed to take hold, and that can certainly change given how crowded the long-term bullish trade remains to be but, likely, there will need to be another driver of some sort. Japanese inflation is set to be released tomorrow evening and that could certainly prod the move but, at this stage, there can still be an argument for buying dips as the carry is still tilted to the long side of the pair, and intervention seems less likely at lower levels.
That said, there’s theoretically capped upside given that we had such an aggressive move with a dual intervention. So as price re-approaches highs then logically that bullish case dims, and, eventually, it can play through for reversals. But that really just depends on when longs get shaken out to the point where selling begets more selling, and while we’ve seen this on a short-term basis so far there hasn’t been that long-term shock factor such as we saw in November of 2022 or 2023 or July of 2024.
USD/JPY Four-Hour Chart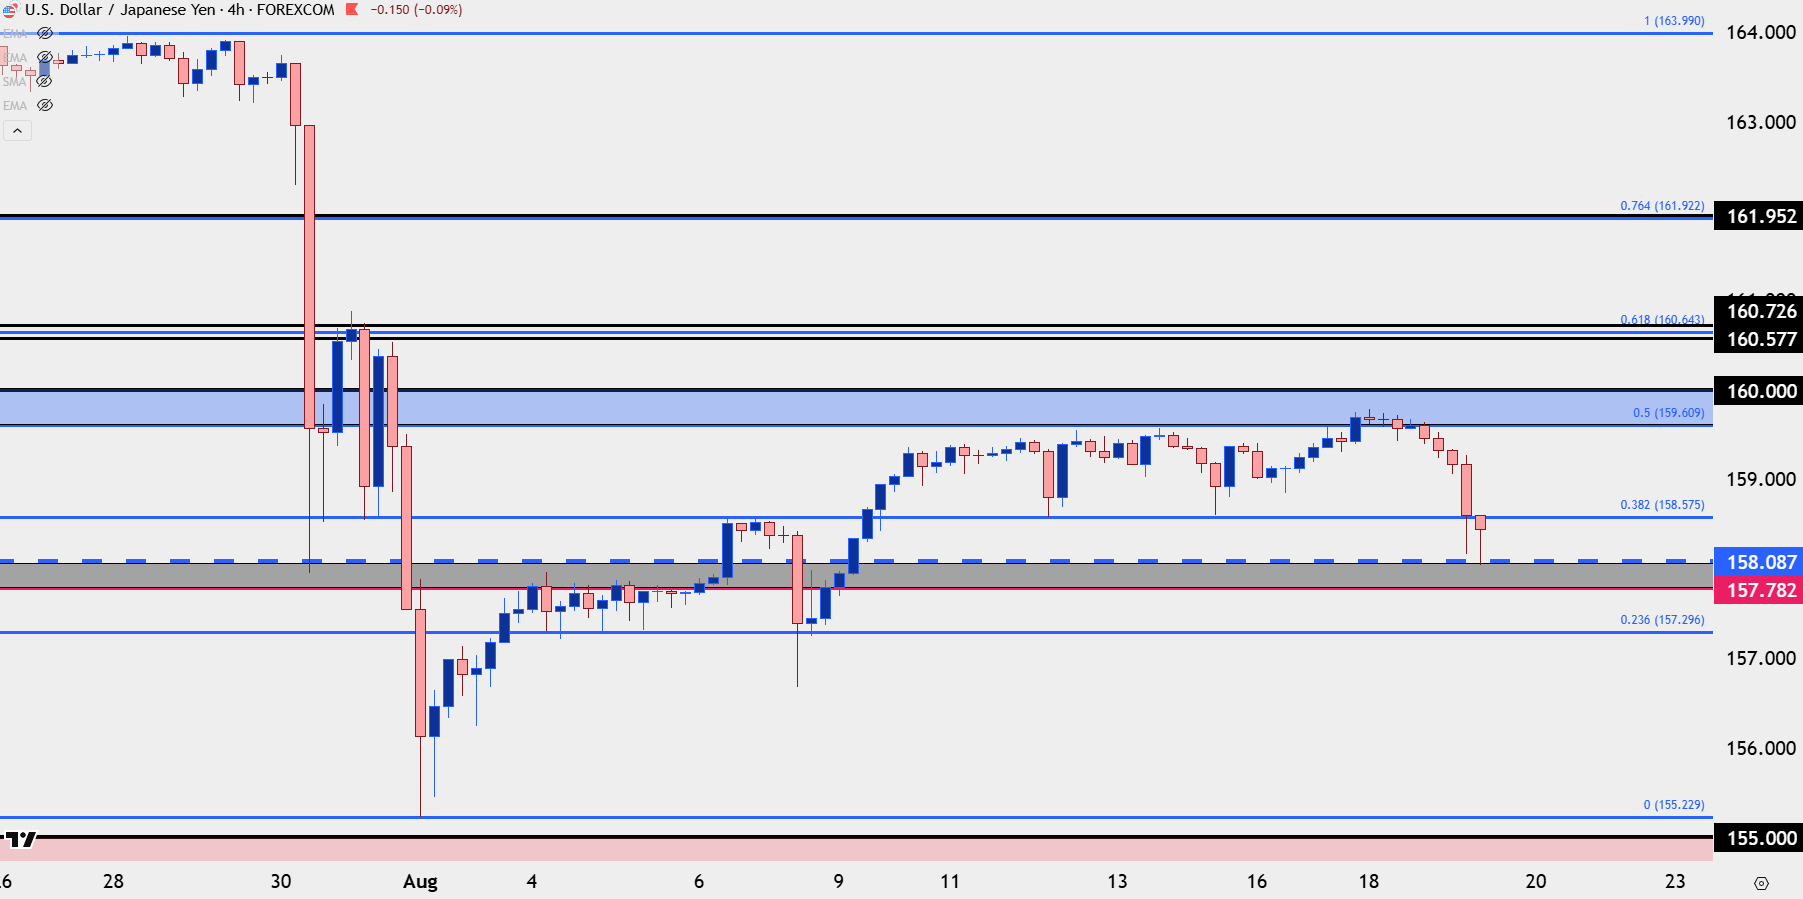
Chart prepared by James Stanley; data derived from Tradingview
Gold
I saved the best for last, at least in my opinion. While much remains in flux around the macro backdrop the item that I think is perhaps most consistent is governments’ maneuvering to continue supporting economies and stock markets. This is, after all, the trigger point behind the gold breakout at $2k back in 2024 and as the Fed cut rates, even with inflation above target, it highlights how lower real rates and less attraction for investing in Treasuries makes gold a seemingly more attractive spot for reserves.
After spending months pulling back and then holding at the $4k level, gold broke out in a big way the week after the FOMC meeting and the BoJ intervention. As I wrote then, I thought this was manifestation of market expectations that inflation wasn’t quite the priority that it had been built up to be and, instead, the primary focus was on continued economic growth even if that meant higher rates of inflation.
Gold has now broken out to a fresh high and has started to stall (on short-terms) at the $4500 psychological level. But – given how much resistance had shown previously at $4435, there’s an ideal spot to look to for support on pullback scenarios that can allow for bullish continuation for trend traders and trending strategies.
Gold (XAU/USD) Daily Chart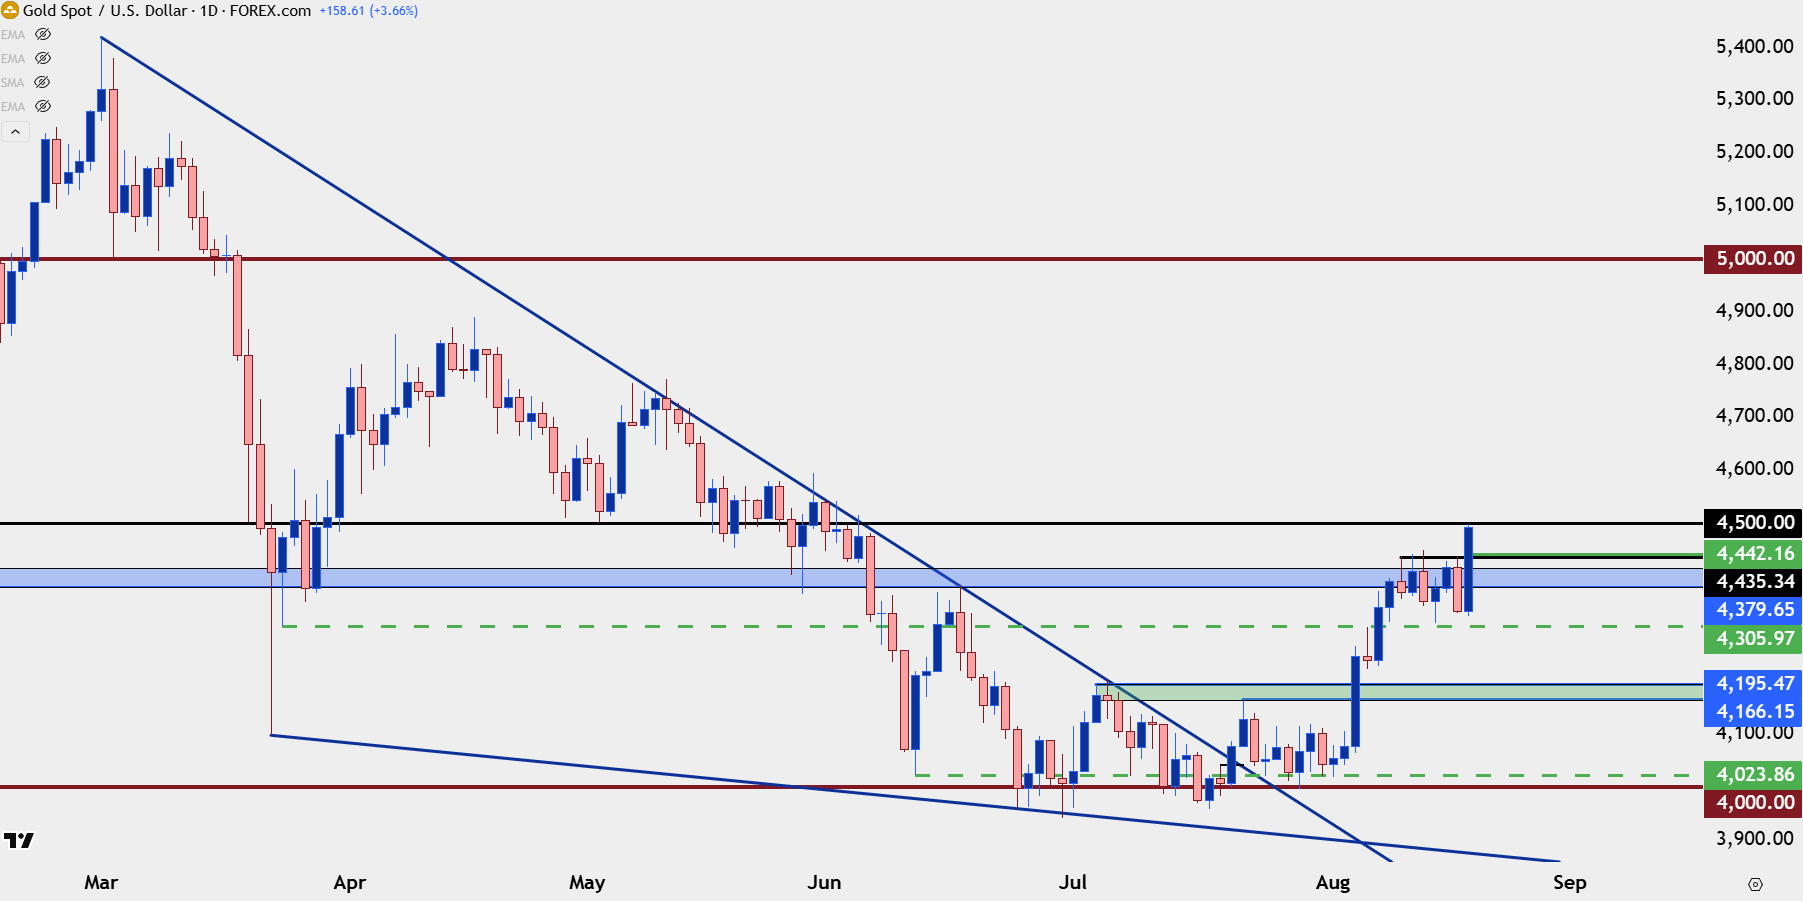
Chart prepared by James Stanley; data derived from Tradingview
--- written by James Stanley, Senior Market Analyst, Global Macro
Related tags:
Latest market news










Web Trader platform
Our sophisticated web-based platform is packed with features.
Open an account today
Experience award-winning platforms with fast and secure execution.
Economic calendar
Related articles

Gold and S&P 500 analysis: What now after Warsh’s hawkish speech?
The dollar surged across the board after the Fed Chair Kevin Warsh surprised with a hawkish-leaning speech at the Jackson Hole summit. All the bearish dollar bets that had been accumulated since last Friday on the back of data weakness and bond market troubles had to be squared and that triggered a short squeeze rally for the dollar. Gold and silver dropped, as a result, as too did bitcoin, while US indices were giving back earlier gains.


Gold Falters at Resistance, Grappling With PCE, Month-End Flows and Jackson Hole
Gold has pulled back from resistance after sticky PCE data, with month-end flows and Jackson Hole now shaping the near-term outlook.


Gold forecast: XAU/USD retreats along with dollar debasement trade
Gold was down nearly 1.5% on the session, with US indices and Bitcoin also struggling. Is this a mere pause before more gains are seen, or have we already seen the end of the recent bullish advance?