


Gold Price Forecast: XAU/USD Avoids Breakdown as Yields Surged but Can it Continue?
Surging Treasury yields sent a jolt across markets last week but, so far, gold prices have held above the FOMC low. The big question now is whether that can continue and, if not, will bulls show up at $4100 or $4k like they did in June and July?
Written by
James Stanley
Sr. Strategist
Gold Talking Points:
- Gold was red on the week following the prior week gain, but notably sellers were unable to take out the FOMC swing low at $4235.
- The macro backdrop behind gold is about as unattractive as can be, with surging Treasury yields and an increasingly hawkish Fed.
- But, bigger picture, there’s still the motive for reserves to flow into areas like gold or Bitcoin and that can support the bullish argument from a long-term basis.
The silver lining, pun intended, is that gold hasn’t broken down more aggressively over the past two weeks.
Much like we saw back in June when Kevin Warsh first shocked markets by sounding far more hawkish than what anyone had expected, weakness in gold only went so far, as buyers showed up at the $4k handle and then held the lows for more than a month before ultimately tilting a breakout in August following Warsh’s next meeting atop the Fed.
Since then, however, the 2025-like action in gold has been evasive and the metal has sauntered lower, albeit tepidly.
From the weekly chart below you can see underside wicks illustrating buyers coming in to support the lows. But more problematic for shorter-term aims is the fact that sellers have been getting increasingly aggressive on bounces, thereby leading to a series of lower-highs.
Gold Weekly Price Chart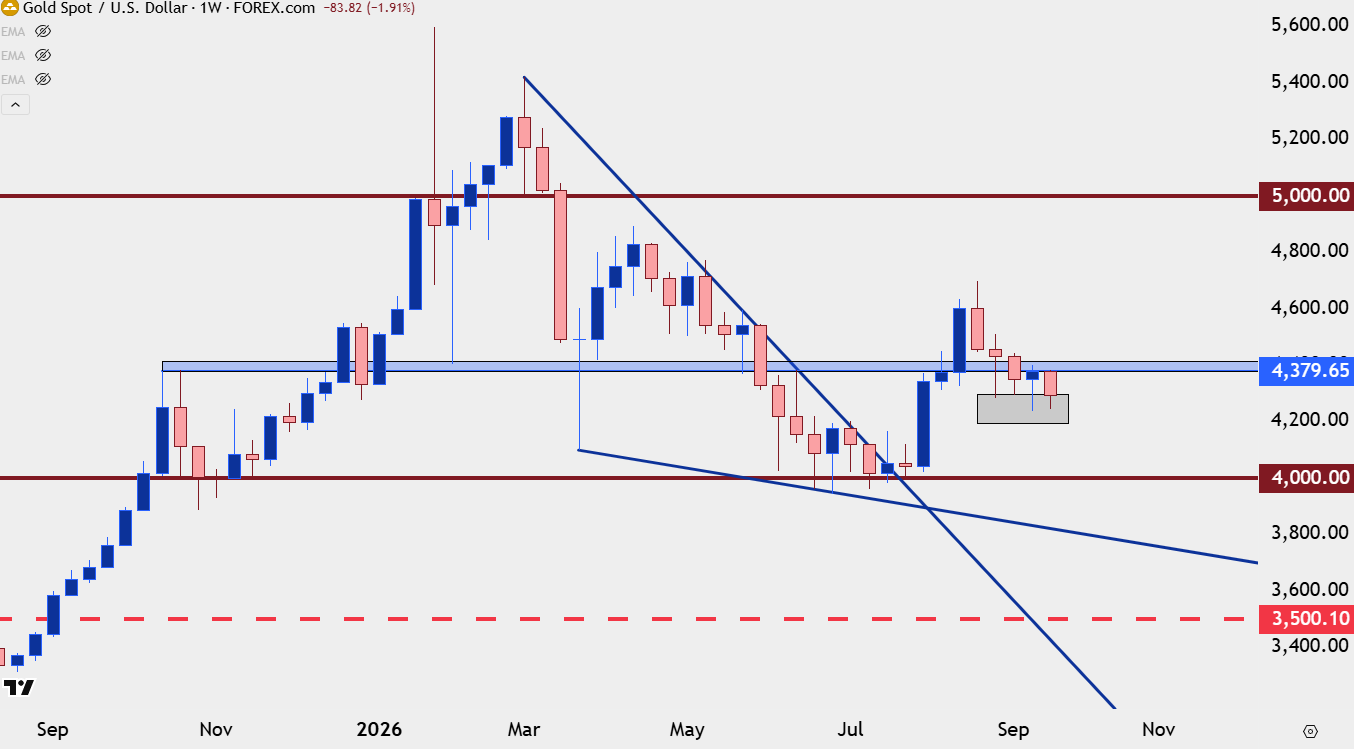
Chart prepared by James Stanley; data derived from Tradingview
Gold’s Lower-Highs
The lower-highs in gold show increasing aggression from bears, and unless bulls can change the tone in the next week or two, that bearish pressure sets up for a downside break and a test of a deeper support level.
This wouldn’t necessarily spell doom and gloom on a long-term basis, as that same $4k level lurks below. But, more ideally for the bullish case, buyers would step in a bit earlier, upon a test of prior resistance in the $4100 area that had set the highs back in late-July, just before the falling wedge breakout.
Gold Daily Chart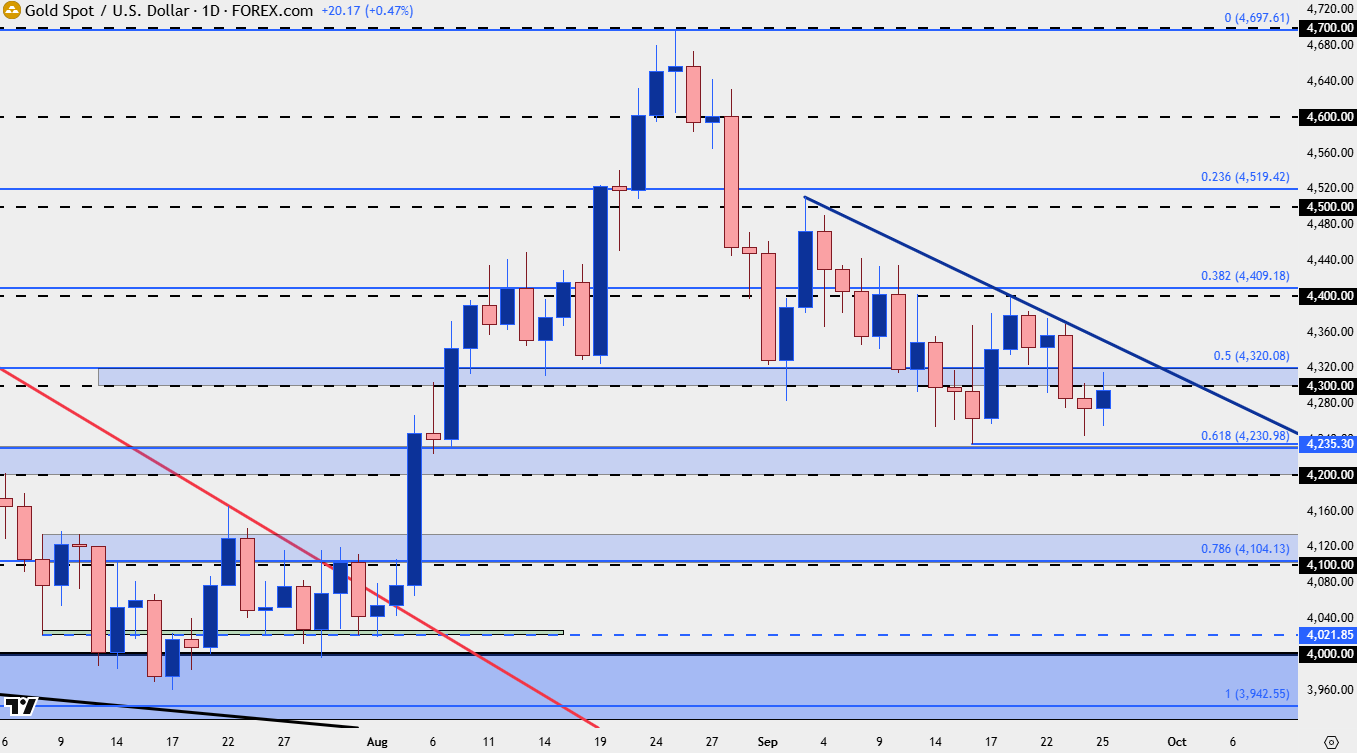
Chart prepared by James Stanley; data derived from Tradingview
Gold Shorter-Term
From the four-hour we can see a clean zone of resistance taken from prior support, spanning the $4300-4320 zone on the chart. If bulls can break above that, and then force a test above the descending trendline, the door opens for a re-test of the prior week high at $4400, and then the larger test would be the early-September high at $4500.
It’s difficult to imagine that taking place without some form of softening in Treasury yields, but as the old saying goes, price leads and narrative follows. The fact that gold hasn’t broken down harder yet might be saying something important and we’ll find out whether that’s the case in the next couple of weeks.
Gold Four-Hour Chart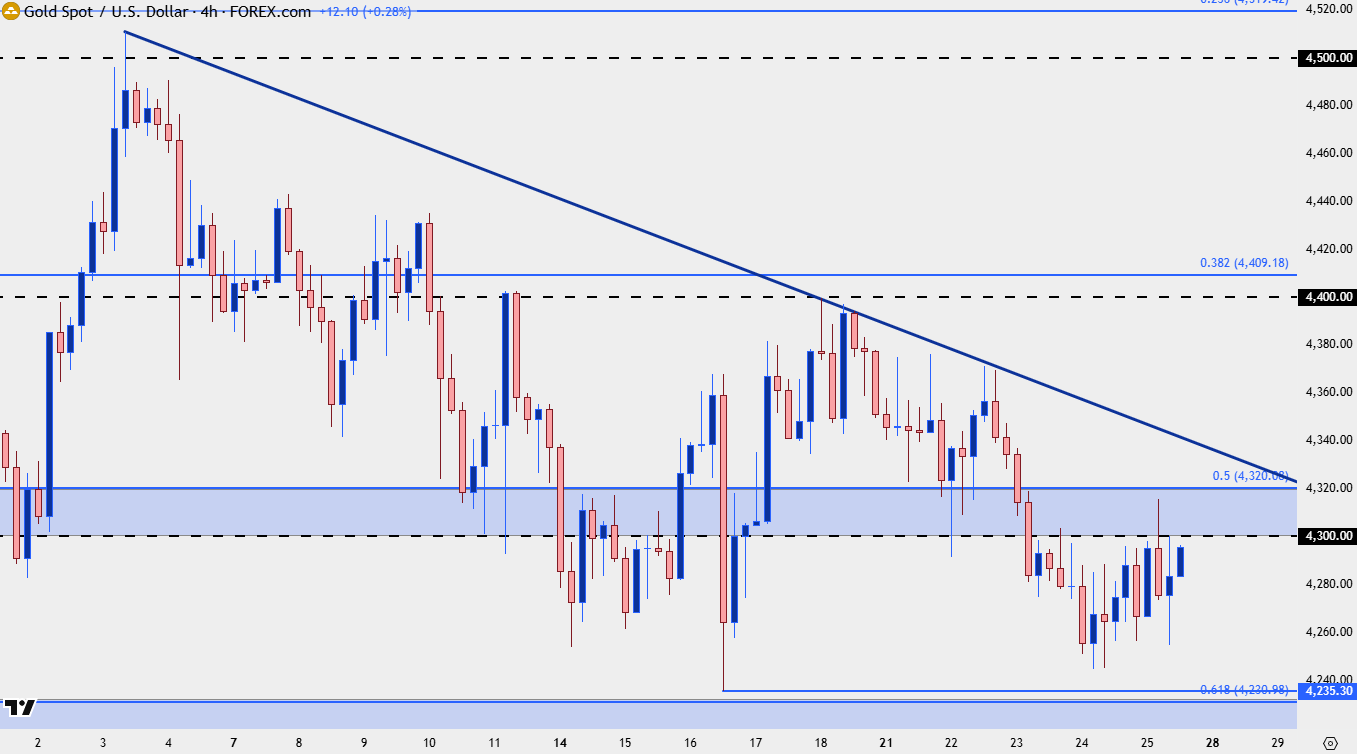
Chart prepared by James Stanley; data derived from Tradingview
--- written by James Stanley, Senior Market Analyst, Global Macro
Related tags:
Latest market news










Web Trader platform
Our sophisticated web-based platform is packed with features.
Open an account today
Experience award-winning platforms with fast and secure execution.
Economic calendar
Related articles

Gold and S&P 500 analysis: What now after Warsh’s hawkish speech?
The dollar surged across the board after the Fed Chair Kevin Warsh surprised with a hawkish-leaning speech at the Jackson Hole summit. All the bearish dollar bets that had been accumulated since last Friday on the back of data weakness and bond market troubles had to be squared and that triggered a short squeeze rally for the dollar. Gold and silver dropped, as a result, as too did bitcoin, while US indices were giving back earlier gains.


Gold Falters at Resistance, Grappling With PCE, Month-End Flows and Jackson Hole
Gold has pulled back from resistance after sticky PCE data, with month-end flows and Jackson Hole now shaping the near-term outlook.


Gold forecast: XAU/USD retreats along with dollar debasement trade
Gold was down nearly 1.5% on the session, with US indices and Bitcoin also struggling. Is this a mere pause before more gains are seen, or have we already seen the end of the recent bullish advance?