


Equity Indices Q4, 2026 Outlook: Cracks Begin to Show
There's still an open door for a melt-up in the S&P 500 and Nasdaq but the Dow and Russell 2000 are looking more vulnerable, and until calm hits the Treasuries market there's a higher probability for volatility. The big question is whether that's a next quarter theme or not.
Written by
James Stanley
Sr. Strategist
I’ve written these forecasts for years and in each one that I’ve produced, I’ve retained a bullish bias. Even when I felt confident of a pullback, rather than trying to get too cute by trading the ‘counter trend inside of the trend,’ my prerogative was, instead, to simply wait, try to catch support, and then look for the bounce that I expected to follow.
This worked particularly well after the 2025 and 2026 opens as each brought a form of pressure driven by tariffs and then the threat of inflation from higher oil prices. And, in both scenarios after a violent sell-off, buyers jumped back on the bid and stoked epic rallies.
But in this forecast I think there’s possibility that we see a sell-off that’s more than just a pullback, and despite a seemingly bullish outlook across most Wall Street analysis, it feels almost as if the world is whistling past the graveyard as a plethora of risks have mounted. These types of things are difficult to time, but the ingredients are there, as Treasury yields are the item that will, likely, drive the theme. And not Treasury yields going up, either, but once Treasury yields get to a point where investors are less interested in chasing the 14th or 15th dip in overbought stock prices and, instead, divert capital into bonds to get the ‘safe’ 5 or 6%, that’s when we have a problem.
Whether this becomes something more than a pullback will ultimately depend on the Fed’s response, and at this early stage, there’s not enough history around the Kevin Warsh-led Fed to proffer anything more than a guess. The simple route for the bank will be to back down and try to push accommodation at the risk of inflation, much as we’ve seen from Yellen and Powell. But that induces the larger risk, where an increasingly indebted US government combined with a declining birth rate runs the risk of further hollowing out the US economy in the decades to come, eroding the middle class via inflation and creating more extreme political shifts that ultimately manifest in economic policy.
Longer-term, the fight with yields is something that will likely require some help and given the Fed’s tendency to move towards QE and bond buying, essentially subsidizing government spending, it’s difficult to imagine that this will not come into play at some point. The only problem with that right now is inflation, and until inflation is tamed, they’re largely hamstrung with few options. But, given the timing of yields flying and the Fed suddenly sounding concerned around inflation it seems no coincidence that this is the first time in decades that the argument can be made that Fed is leaning and biasing hawkish. Given that inflation has been above target for five years now makes the timing even that much more interesting. But I think it also points to why another round of QE is more of ‘when’ rather than ‘if.’
More near term, however, the major concern is oil prices. That’s a precursor to inflation and as long as the entanglement continues in the Middle East there’s a risk of higher inflation, and this is something the Fed cannot simply ignore. This is also playing into the other problem with Treasury yields so it creates a type of perfect storm, where ongoing pressure in the Middle East leads to higher yields which leads to firmer Fed policy which, eventually, can take toll on equities.
The Larger Macro Risk
Oil prices, inflation, Treasuries and an important mid-term election cycle highlight a culmination of risks that I think will take their toll with a pullback of 10% or more from the recently-established all-time-highs in the S&P 500. At that point, we could be on the cusp of another compelling support setup – or – if we’re seeing yields come down there may be a more attractive opportunity cost that helps to draw more capital out of elevated equity names.
For two years now I’ve shared my opinion that the AI trade is a bubble – not the technology, but the valuations. The parallels to the internet bubble are striking, although the revenue generation from AI has been greater than what we saw more than 25 years ago. Nonetheless much of it is unprofitable, and financed by debt, and that debt will increase in cost considerably as yields go up and that further puts the onus on companies to both increase revenues and cut costs.
That template is what highlights the importance of the Federal Reserve’s pace in the coming months.
What ultimately helped to pop the bubble back then was six rate hikes in 11 months, including a 50 bp hike when the Nasdaq had already began selling off in early 2000. And, notably, the start of those rate hikes was extremely bullish for stocks. It wasn’t until rates got high enough that they acted as a drag on capital flows, pulling investors into bonds and away from bidding dips in overbought, stretched equities. To be sure, this wasn’t the only factor as valuations played a large role, but from many measures, valuations are even higher today.
The Fed has no choice but to get inflation down as the US government is far more indebted now than it was then, and the American public can’t afford life with the 10-year at 5.5%. The only thing that can help is capital going into Treasuries to boost prices and the only reason an investor would do that right now is if they had confidence that purchasing power wouldn’t be massively eroded by inflation in the coming years.
One look at what Treasuries did back in 2024, when the Fed cut rates by 100 bps in a few months even as inflation remained well-above their 2% target shows this impact. But, perhaps lost in that shuffle is why the Fed was cutting in the first place, and while their dual mandate was far from satisfied, it was the banking stress that arrived on the back of their own rate hikes a year prior that pushed that move. The fear then was that a similar 2008 domino effect of mark-to-market accounting would cause contagion amongst banks and freeze up the financial system. Slowing rate hikes and then eventually cutting rates helped regional banks to position further away from that risk. But the larger problem now is the US government and the American public, as much of everyday life is more correlated to longer-term yields.
With mortgage rates already pushing 7% there’s pockets of the US economy already seeing issues. Should that go up to 8%, which is certainly possible given the parabolic route of Treasury rates right now, there could be an even larger swath of the economy impacted. And until inflation is ‘handled,’ or at least until market participants gain confidence that it’s on the way, given all of the Treasury issuance that’s coming up, there’s simply no reason for an investor to want to hold any form of duration.
That creates a spiraling situation with yields until, eventually, buying bonds is attractive which will in-turn draw capital away from equities at exuberant valuations.
This is the harboring risk. It’s also one that doesn’t necessarily need to come out in Q4 of 2026, although it’s possible that it does. And given that this is a forecast I’d be remiss if I didn’t at least point out the possibility of a debt spiral causing the ultimate pop in the AI bubble.
For what it’s worth, it seems most economic forecasters aren’t expecting something similar until next year or the year after, and instead looking for the melt up that I forecasted coming into this year to continue through the end of 2026. But, it’s that very reason that I think we could see something show earlier, as the threat of doom is often enough to curtail buying, at least by a little bit, which can then manifest in price action.
S&P 500
In Q3 there was an early warning sign that had showed, as the S&P 500 was starting to outperform the Nasdaq 100 after Kevin Warsh’s first meeting at the Fed. After his second meeting, the S&P jumped up to a fresh all-time-high but notably, the Nasdaq did not. For a tech-led uber-rally such as we’ve seen over the past four years for that dynamic to shift is noteworthy, as the AI names that led the charge higher were suddenly on their back foot.
As I write this in the closing days of Q3 that fact hasn’t been completely rectified as NVDA still has yet to push through the high from May, and this is despite a stellar quarterly earnings report. It highlights a degree of fatigue, along with worry about the trajectory of rates.
It was after the Fed’s rate hike in September that the Nasdaq finally got back up to a fresh high so at this point, it may seem like any possible crisis has been averted. But, again, that seems conditional on a continued ease in oil prices which will require a continued drawdown in tensions in the Middle East – an impossible item to forecast at this stage.
As we go into Q4 there is bullish technical potential remaining the S&P 500, in the form of an ascending triangle and, shorter-term, an inverse head and shoulders pattern. Each could allow for the 8k level to trade which would be beyond my 2026 forecast for the index, but perhaps the larger question is what happens after that.
Because there’s little reason to hold bonds there’s lacking opportunity cost for stocks. That can change if we see the parabolic rise in yields continue and that’s what can allow for the timing of an 8k test in SPX to be followed by a pullback, or retracement, or, perhaps even, the start of a reversal rivaling what we saw back in 2022. But, like we saw in 2022 if we do get that backdrop there may simply be more attractive equity indices for bearish stances, such as the tech-heavy Nasdaq or the small cap Russell 2000.
So, for Q4, if you are looking for strength in stocks the S&P 500 would probably be the more attractive backdrop. If you think a melt up is going to drive, then perhaps the Nasdaq. And for sellers or bears, the Russell 2000 and Dow Jones can offer greater potential as looked at below.
S&P 500 Weekly Chart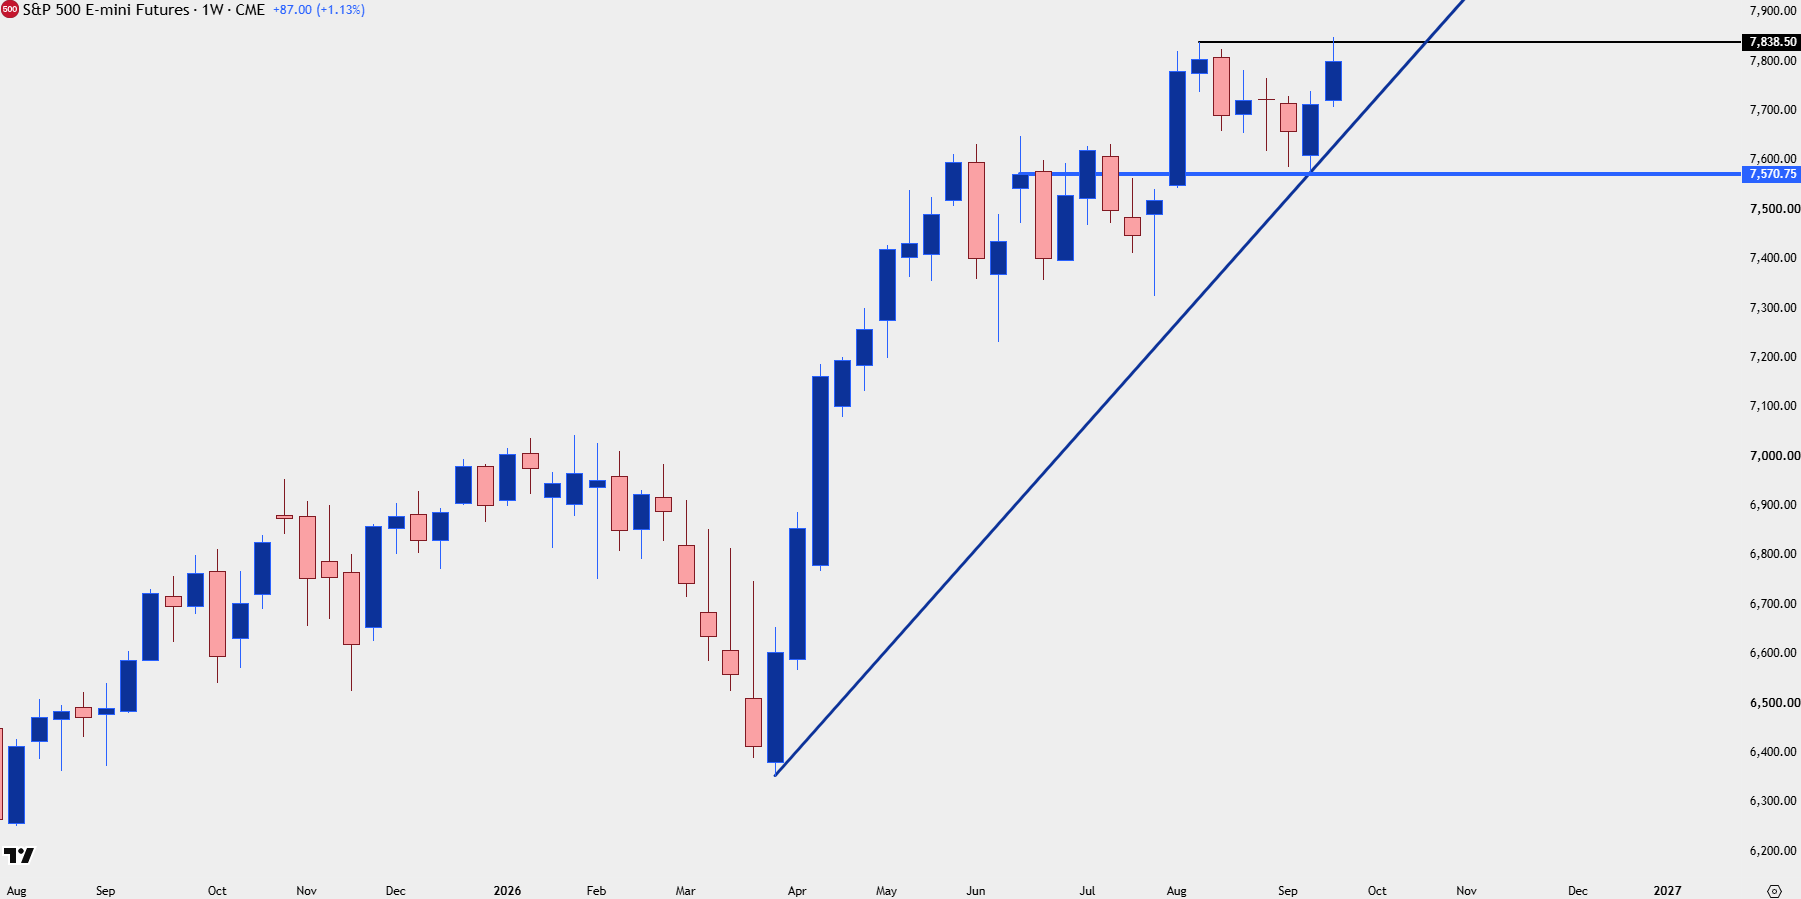
Chart prepared by James Stanley; data derived from Tradingview
S&P 500 Technical Levels
As we wind into the end of Q3 there’s a possible inverse head and shoulders pattern on the daily chart. These are notoriously tricky, and they don’t trigger or activate until you have a break of the neckline which for this formation is the ATH at 7839.
But – there is logic to the formation. There’s a line-in-the-sand that’s clearly been respected multiple times. Sellers had an open door to go for control multiple times, with failure in each instance. The left shoulder shows reaction to a low followed by a push from sellers to create the head, but it’s the higher low of the right shoulder that shows that waning bearish response which keeps the door open for bulls to ultimately grab control upon continued tests of the highs.
That formation is nullified on a break of the head, which projects here to around 7572.
S&P 500 Daily Chart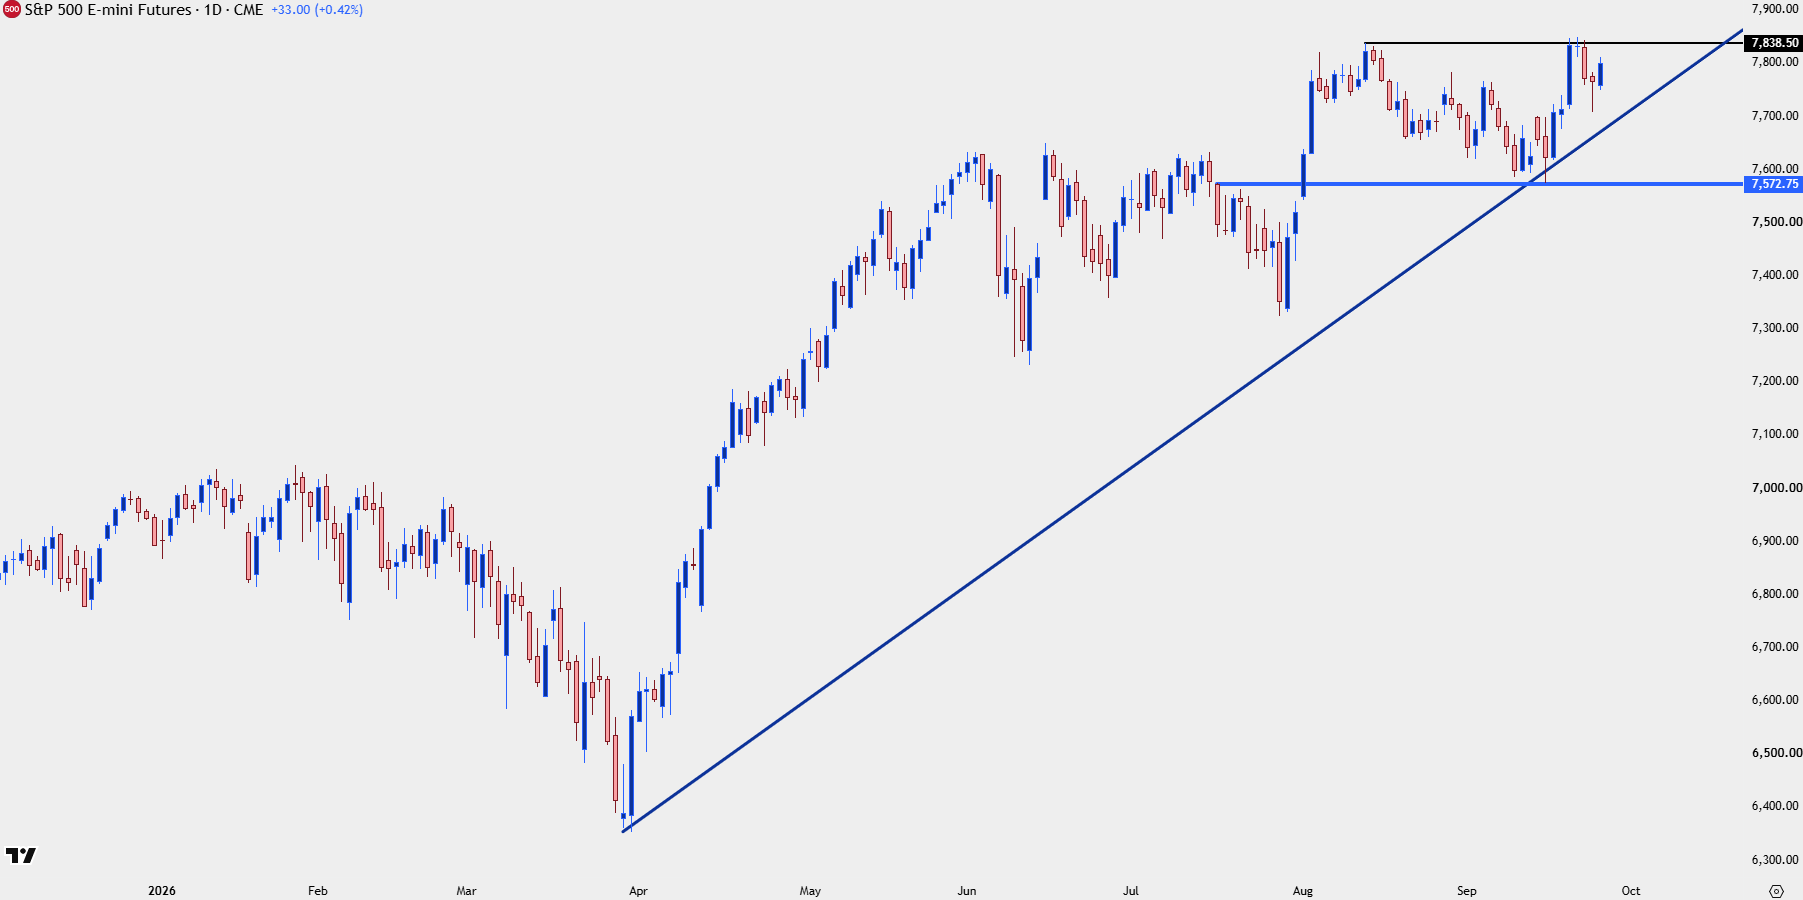
Chart prepared by James Stanley; data derived from Tradingview
Nasdaq 100
On the topic of inverse head and shoulders patterns, the Nasdaq 100 had built a similar setup going into that September rate hike. Bulls broke out of that in a big way, ultimately stalling at the ATH once they were able to push up for another test. The fact that buyers came back in such a big way indicates that we could be on the cusp of that melt up scenario.
The vulnerability, as noted above, would be both oil prices and inflation, pushing higher Treasury yields. But, the counter to this thesis is if there is thawing in the Middle East situation, and we do see oil prices ease, that could wave the red flag in front of bulls and that can lead to the breakout scenarios in both the S&P 500 and the Nasdaq.
This wouldn’t necessarily eliminate the problem of surging Treasury yields as the US still faces a maturity wall of debt coming due, but it does push the problem into next year or the year after while keeping the door open for a Santa Rally in stocks.
In the Nasdaq 100, there’s another inverse head and shoulders pattern that’s built and this one is a monster, as the roughly 4,000 points from head to neckline projects to a move towards the 35k marker.
For a bubble bursting scenario, this actually aligns better as it’s that capitulation from buyers in a melt-up top that often marks the high – very similar to what played out back in the year 2000. That, along with higher inflation and a hawkish Fed and surging Treasury yields simply builds the backdrop with which a major reversal can brew. But, again, that would seem to be more of a next year type of scenario rather than something that imminently shows.
The below chart shows that, initially, rate hikes didn’t matter much. But, suddenly in March of 2000, they did. And when the Fed put in their last hike of that cycle, a 50 bp move in May, the Nasdaq found a bottom shortly after before rallying 45% off the lows. But, by then, it was too late, the bubble was already pricked and investors flocked into the safe harbor of Treasuries rather than chasing another pullback in overbought tech stocks.
Nasdaq 100 Weekly Chart – September 1999-2001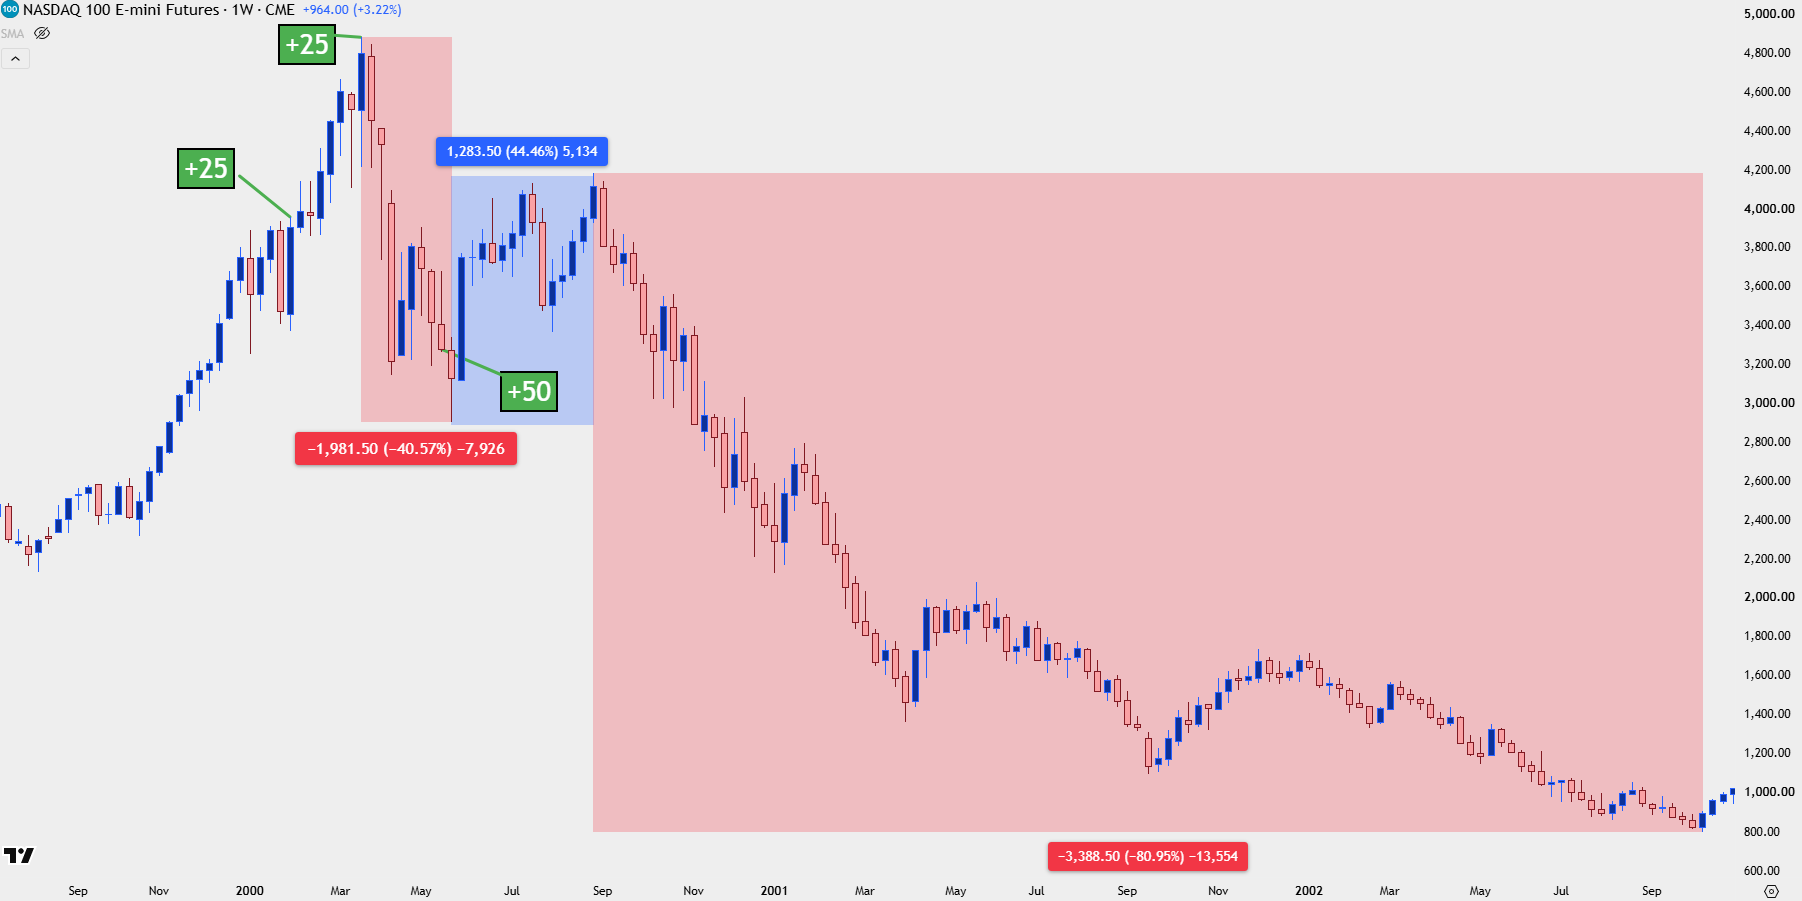
Chart prepared by James Stanley; data derived from Tradingview
Just like the above, the Nasdaq holds breakout potential as we go into Q4 and this is what might ultimately drive some form of capitulation from buyers, particularly if Treasury yields get to an attractive level that induces buying demand.
Nasdaq 100 Daily Chart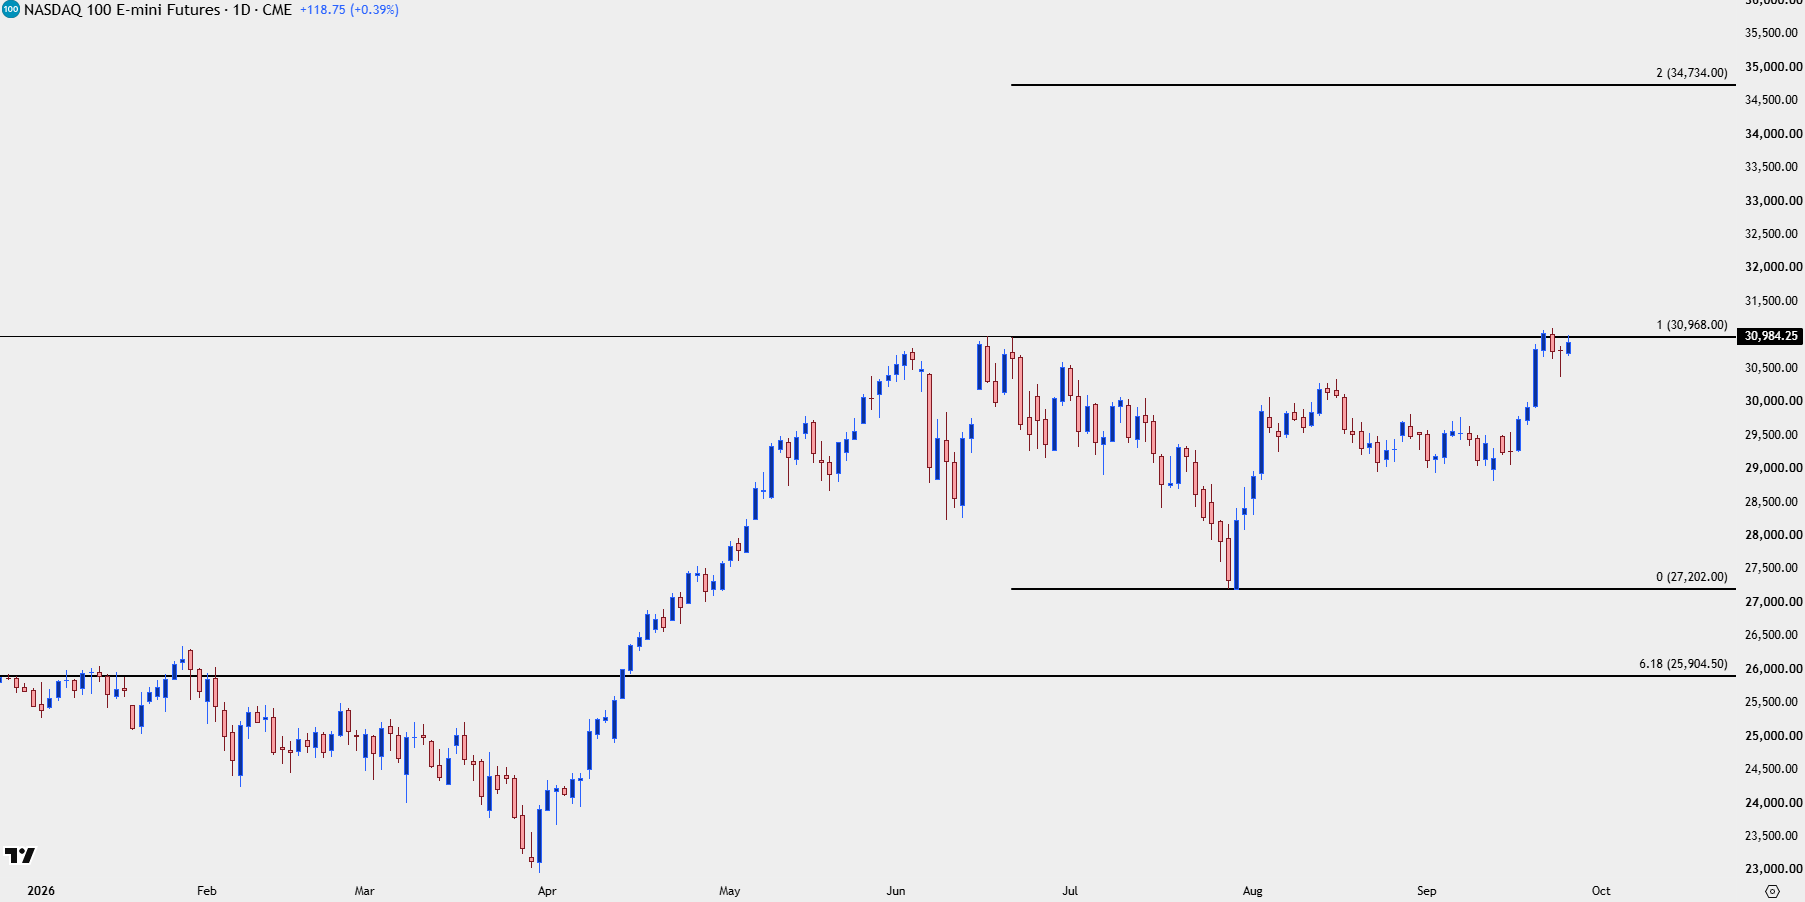
Chart prepared by James Stanley; data derived from Tradingview
Dow Jones
While both the Nasdaq and S&P 500 have recovered, the Dow has not as the index limps into the end of Q3 with a net loss. And the quarterly bar here isn’t very attractive as we have a pin bar formation given the intra-quarter reversal. Of course, the 50k level remains a big deal as this held the highs in the first-half of the year but we can’t quite say that there’s acceptance at that price as there hasn’t yet been much for support.
Dow Jones 3-Month Chart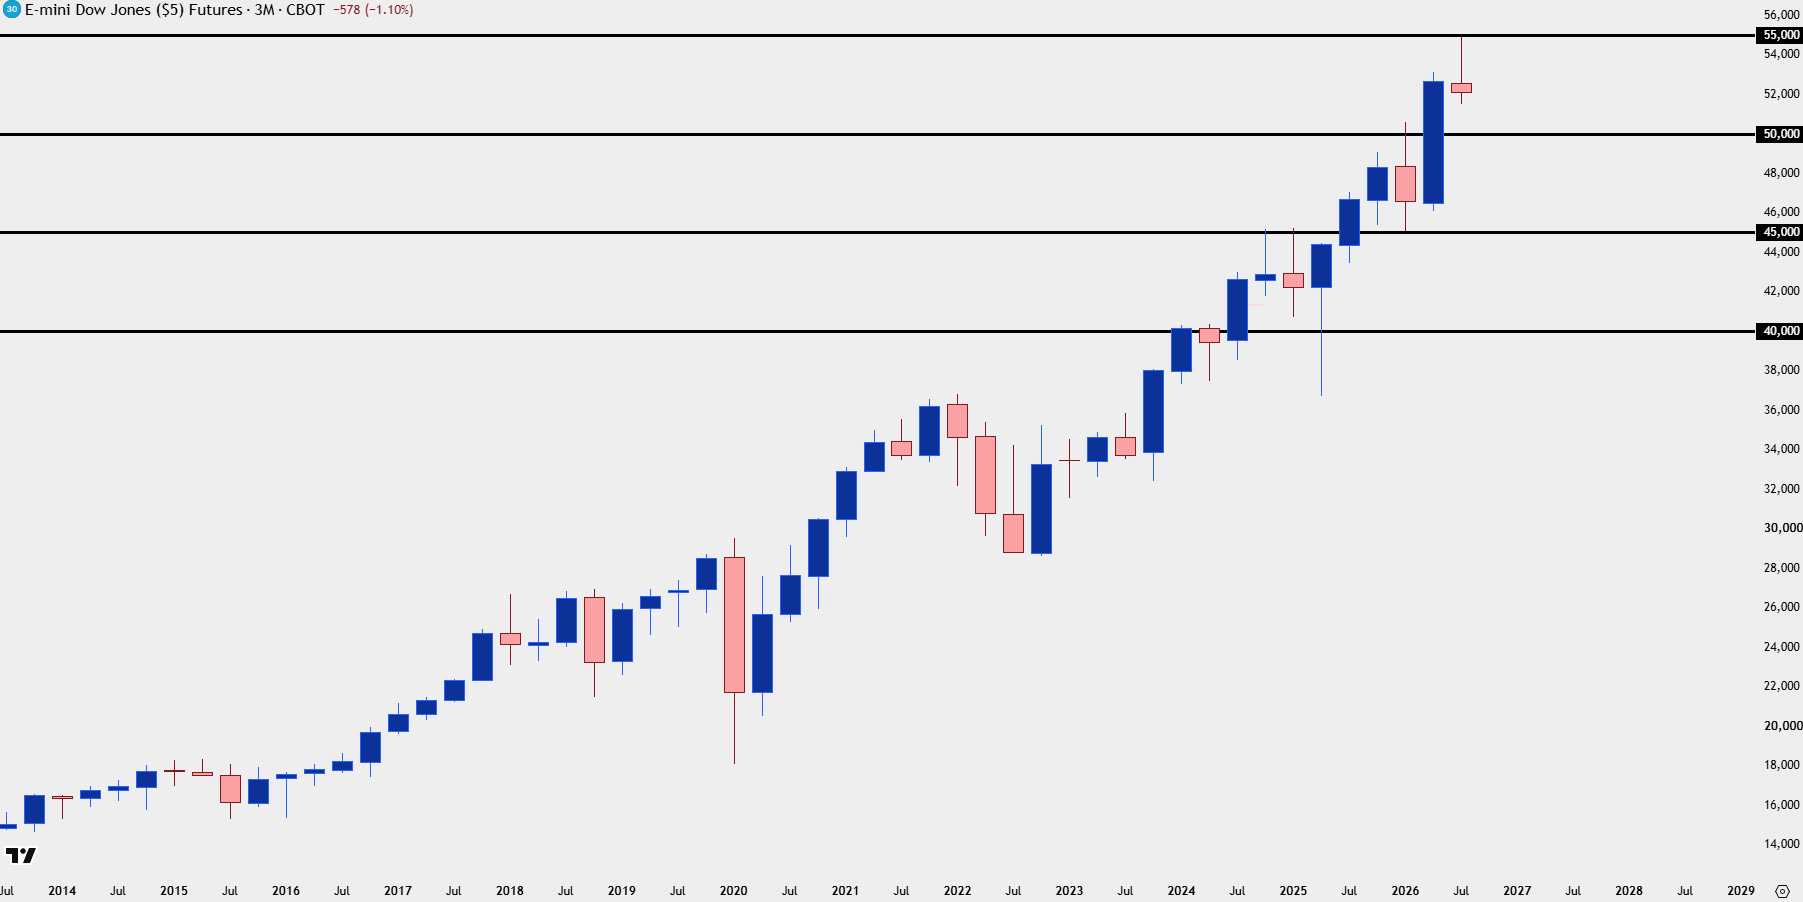
Chart prepared by James Stanley; data derived from Tradingview
From the weekly, it’s the major psychological levels that stand out and, again, if you’re bearish stocks this likely makes for a more attractive backdrop given that divergence from the strength after the rate hike exhibited in the S&P 500 and Nasdaq.
If the Dow loses the 50k handle, it’s the 45k handle that comes up next and that’s 10% move from level-to-level, or a 13%-plus move from current prices.
Dow Jones Weekly Price Chart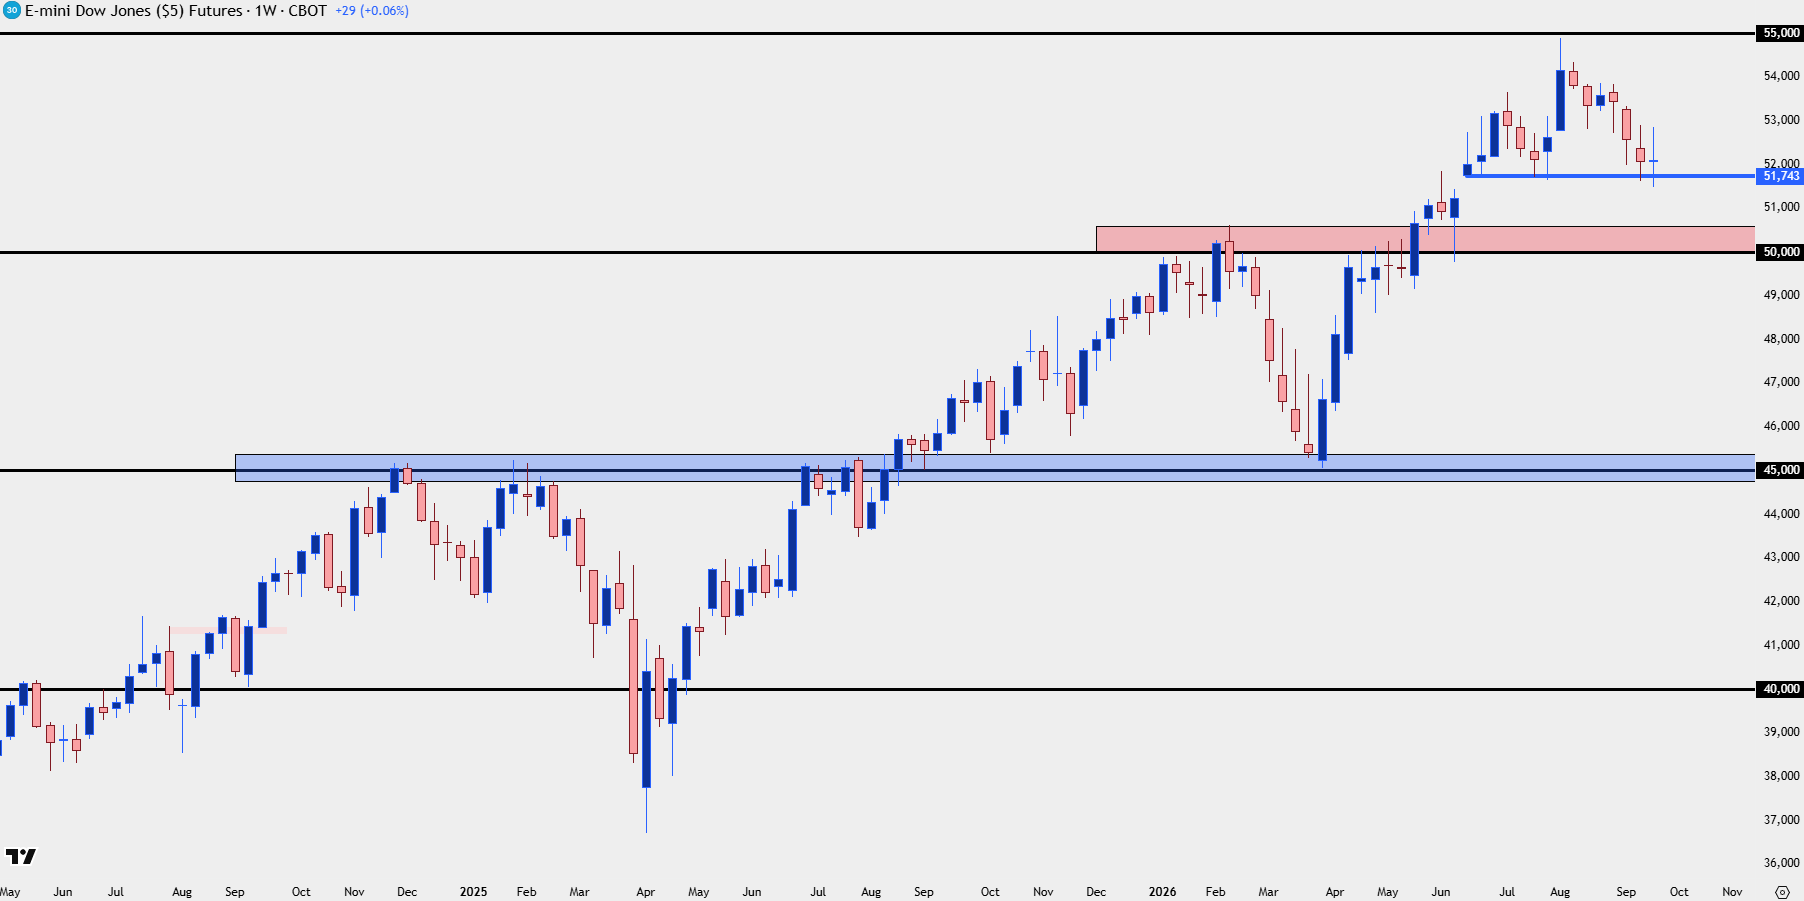
Chart prepared by James Stanley; data derived from Tradingview
Russell 2000
Similar to the Dow, the Russell 2000 is limping into the end of Q3 with a net loss, and if looking to take a short stance on stocks it can make for a more compelling argument than the S&P 500 or the Nasdaq.
Given the driver of the weakness – higher rates – it makes sense as to why small caps could be more impacted. And at this stage it seems unlikely that Treasury yields ease as an upcoming trove of maturing debt combined with a spend-heavy US government is going to keep pushing supplies into debt markets. In-turn, those higher supplies mean lower prices and higher yields and this will probably continue to hamper smaller companies more than larger ones, although capital intensive AI names could certainly feel the strain in the coming months.
In the Russell 2000, the next support level down is the 2740-2772 area, and that’s followed by the 2500 level which was a massive point of contention after buyers shied away from tests for four years until it ultimately gave way earlier this year. Given how contentious that spot was as resistance, a support test there makes sense and it’s how buyers respond to that where we could get a better read for forward-looking trajectory.
Russell 2000 Weekly Price Chart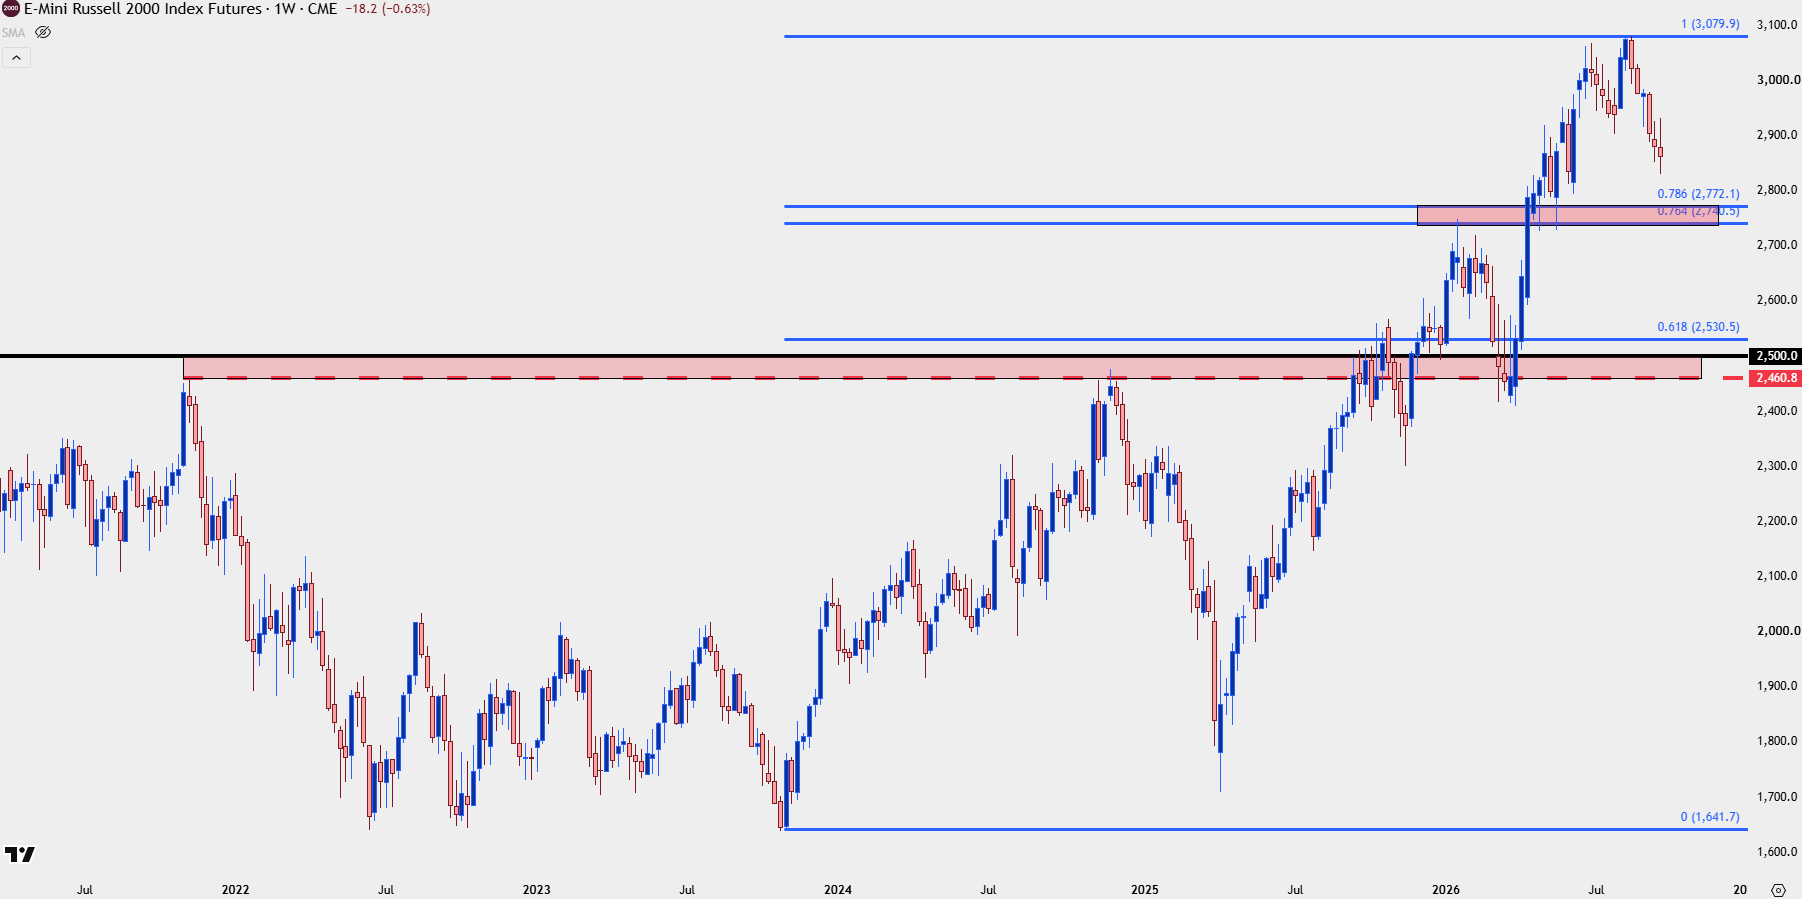
Chart prepared by James Stanley; data derived from Tradingview
--- written by James Stanley, Senior Market Analyst, Global Macro
Related tags:
Latest market news











Web Trader platform
Our sophisticated web-based platform is packed with features.
Open an account today
Experience award-winning platforms with fast and secure execution.
Economic calendar
Related articles

Gold and S&P 500 analysis: What now after Warsh’s hawkish speech?
The dollar surged across the board after the Fed Chair Kevin Warsh surprised with a hawkish-leaning speech at the Jackson Hole summit. All the bearish dollar bets that had been accumulated since last Friday on the back of data weakness and bond market troubles had to be squared and that triggered a short squeeze rally for the dollar. Gold and silver dropped, as a result, as too did bitcoin, while US indices were giving back earlier gains.


Nasdaq 100 Forecast: NDX slips ahead of Fed Chair Warsh’s speech
U.S. stocks are edging lower on Friday, giving back some of yesterday's gains after Nvidia's strong outlook revived the tech trade. The focus has now shifted firmly to Fed Chair Kevin Warsh's Jackson Hole speech, with investors looking for more clarity on the outlook for interest rates.


S&P 500 Forecast: SPX after Nvidia revives confidence in the AI trade
U.S. stocks are heading higher on Thursday, with technology leading the move after Nvidia's stronger-than-expected outlook revived confidence in the AI trade.