


S&P 500, Nasdaq, Dow Forecast: Wall Street Split Widens Into Month-End
Nasdaq strength contrasts with mounting Dow pressure as rising Treasury yields raise the stakes for stocks heading into the monthly close.
Written by
Michael Boutros
Sr. Technical Strategist
Equity Indices Technical Forecast: Weekly Trade Levels
- U.S. equities closed mix this week, with the Nasdaq surging 3.2%, the S&P 500 up 1.1%, and the Dow slipping 0.28%.
- S&P 500 has rebounded sharply from the September low but remains capped by pivotal resistance near the record highs.
- Nasdaq continues to lead, with a two-week surge carrying the index to a fresh record weekly close.
- Dow remains the clear laggard after breaking its April uptrend and extending a fourth consecutive weekly decline.
- Surging Treasury yields and growing expectations for additional Fed tightening remain an increasingly important headwind for equity valuations.
- Core PCE and Non-Farm Payrolls headline next week’s event risk as markets reassess the path for Fed policy into year-end.
U.S. equities head into month-end with increasingly uneven leadership as technology shares extend higher while broader market momentum remains more fragile. The recent surge in Treasury yields has added another layer of pressure, with markets building expectations for additional Fed tightening into year-end following September’s rate hike. That backdrop raises the stakes for next week’s Core PCE and Non-Farm Payrolls reports, which could reshape the rates outlook just as the S&P 500, Nasdaq, and Dow approach sharply different technical inflection points.
S&P 500 Price Chart – SPX500 Weekly
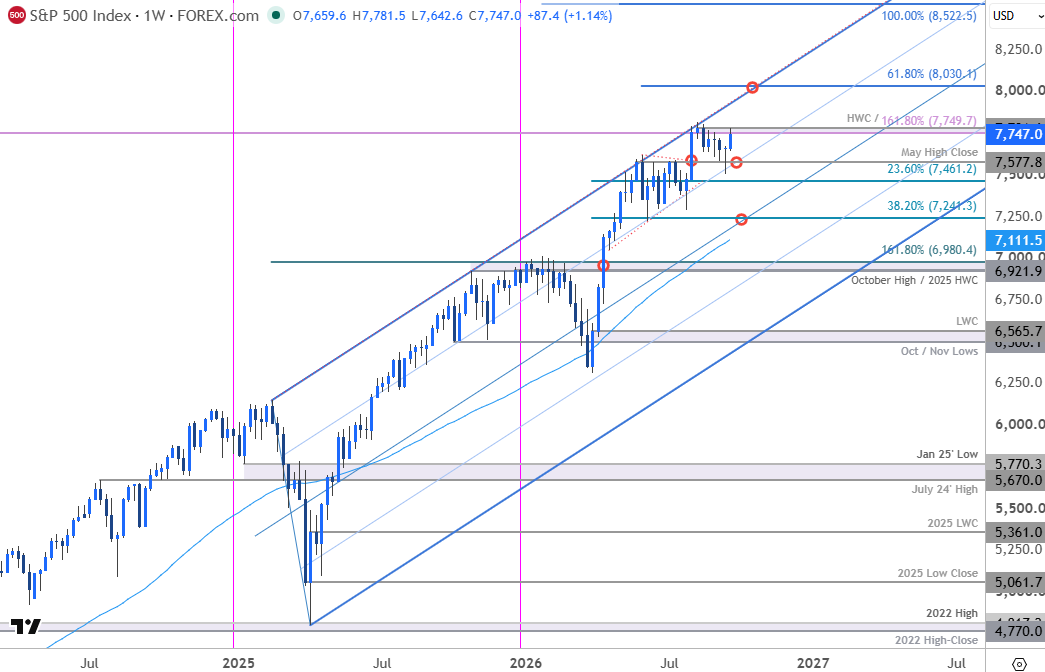
Chart Prepared by Michael Boutros, Sr. Technical Strategist; S&P 500 on TradingView
Technical Outlook: In last month’s S&P 500 Forecast we noted that the SPX500 had, “turned from uptrend resistance, and the focus heading into next week is on whether the bulls back stabilize this recent pullback. From a trading standpoint, losses would need to be limited to 7461 IF the index is heading higher on this stretch with a close above 7781 needed to fuel the next leg of the advance.” The index fell nearly 4% off the yearly highs in the following weeks with price registering an intraday low at 7505 last week before rebounding sharply. The rally registered an intraday high at 7781 this week with the index closing just below confluent resistance on Friday at the 1.618% extension of the 2020 advance and the record high week close (HWC) at 7750/7781.
Once again, the focus is on possible inflection off this pivotal zone heading into the monthly cross with the bulls vulnerable while below. A topside breach / weekly close above this threshold is needed to mark uptrend resumption with subsequent resistance objectives eyed at the upper parallel (currently near 7940s) and the 61.8% extension of the March rally near 8030.
Initial support remains unchanged at the May high close at 7578, which converges on the 75% parallel over the next few weeks. A break / weekly close below this slope would be needed to suggest a more meaningful correction is underway with subsequent support seen at 7461 and the 38.2% retracement of the yearly range at 7241. Note that the median line converges on this level into mid-October- look for a larger reaction there IF reached.
Bottom line: The S&P 500 is trading into pivotal resistance near the record high close, and the outlook remains unchanged into the close of the month. From a trading standpoint, losses would need to be limited to 7461 IF the index is heading higher on this stretch with a close above 7781 needed to fuel the next major leg of the rally.
Nasdaq Price Chart – NDX Weekly
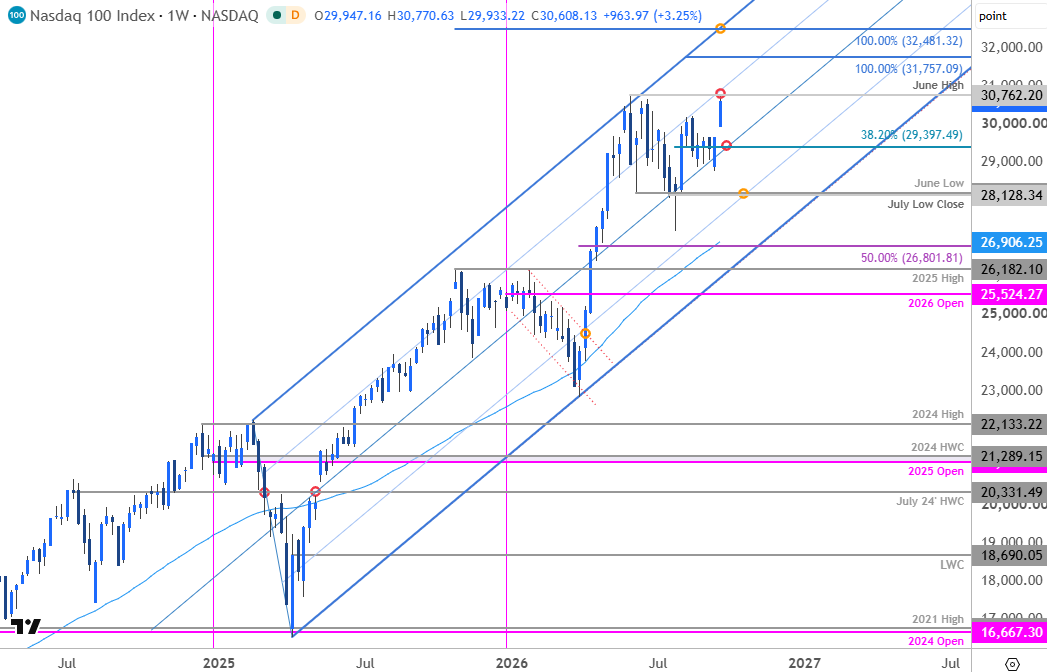
Chart Prepared by Michael Boutros, Sr. Technical Strategist; NDX on TradingView
Technical Outlook: Nasdaq was the best performer last week with the index rallying more than 3.2% to mark a fresh record high close on Friday. The rally faltered into the June high at 30762 with the 75% parallel of the 2025 uptrend seen just higher. The bulls would need to secure a weekly close above this slope to fuel the next major leg of the rally with subsequent resistance objectives eyed at the 100% extension of the July advance at 31,757 and the 100% extension of the broader 2025 rally at 32,481.
Support now rests with the 38.2% retracement of the July rally at 29,397. Note that the median0line converges on this threshold over the next few weeks and a break / close below this slope would be needed to suggest a more significant high is in place and a larger correction is underway. Subsequent support rests at the July low close and the June low at 28,128/96 and is backed by the 50% retracement / 52-week moving average at 26,801/906.
Bottom line: A two-week rally of more than 6.5% takes Nasdaq into confluent uptrend resistance, and the focus is on a reaction off this zone into the close of the month. From a trading standpoint, losses would need to be limited to 29,397 IF the index is heading higher on this stretch with a close above 30,762 needed to fuel the next major leg of the rally.
Dow Jones Price Chart – DJI Weekly
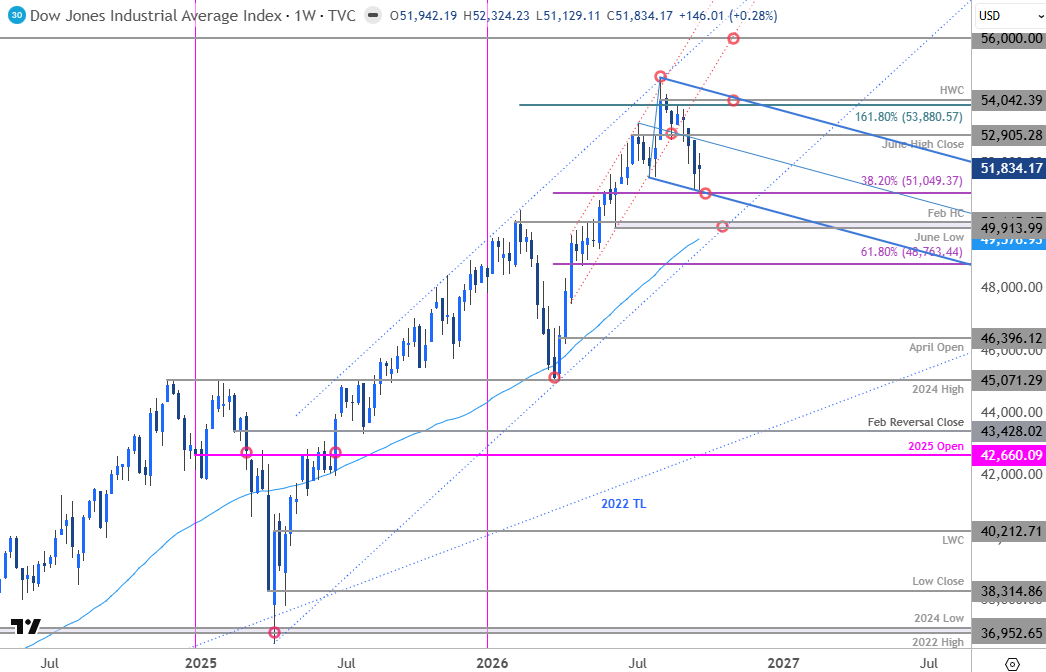
Chart Prepared by Michael Boutros, Sr. Technical Strategist; DJI on TradingView
Technical Outlook: The Dow was the worst performing index last week with a decline of 0.28%. The break of the April uptrend has fueled a fourth consecutive weekly decline, driving the index more than 6.6% off its record high and to its lowest level since June.
The bulls have defended support for the past two-weeks at the 38.2% retracement of the yearly range near 51,049. The lower parallel of a newly added descending pitchfork extending off the record high converges on this level over the next few weeks and the focus is on a reaction off this slope into the close of the month. Key support and bullish invalidation rests just lower at the June swing low and the February high close at 49,914-50,115. A break / weekly close below this threshold would be needed to suggest a more significant high is in place and a larger trend reversal is underway towards the 61..8% retracement at 48,763.
Resistance is eyed at the June high close at 52,905 with key resistance unchanged at the 1.618% extension of the yearly range breakout and the record high-week close (HWC) at 53,880-54,042. Note that the upper parallel converges on this threshold in late-October and a breach above this slope would be needed to mark resumption of the 2025 uptrend towards the yearly high (54,749) and ~56K.
Bottom line: The Dow is trading just above Fibonacci support into the close of September with momentum dropping to the lowest levels since April. From a trading standpoint, losses would need to be limited to 49,914 IF the 2025 uptrend is to remain viable with a close above 54,042 needed to fuel the next leg of the rally.
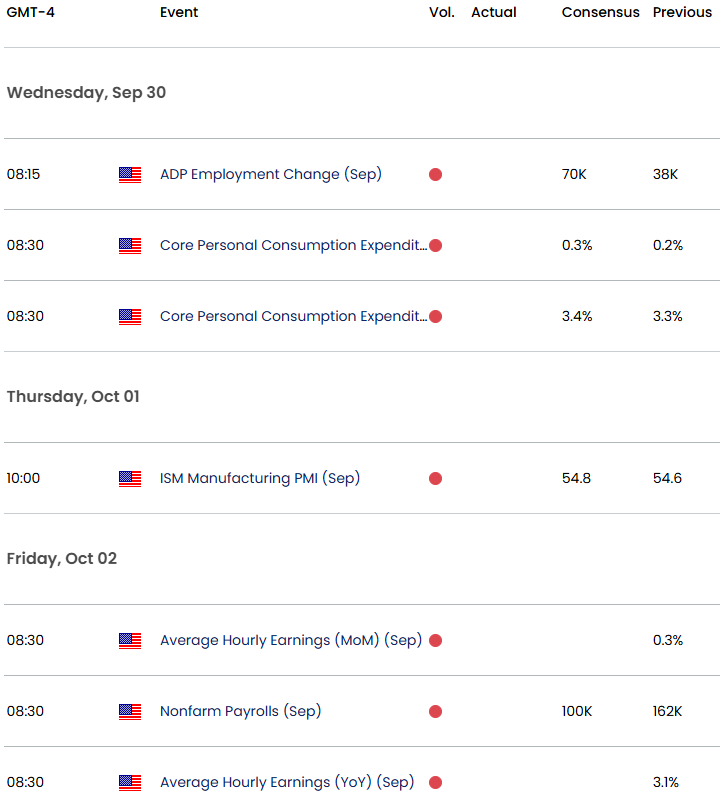
The economic calendar heats up into the close of next week and the start of the new month, with Core PCE—the Fed’s preferred inflation gauge—and the highly anticipated Non-Farm Payrolls report taking center stage. With markets assessing the scope for additional Fed tightening into year-end, the combination of inflation and employment data could drive a meaningful repricing in Treasury yields and broader risk sentiment. Persistent inflation alongside another resilient jobs report would reinforce the case for a more restrictive policy path, creating a potential headwind for equities—particularly the rate-sensitive Nasdaq. Stay nimble into the releases and watch the weekly / monthly closes for guidance
Key US Economic Data Releases
--- Written by Michael Boutros, Senior Technical Strategist
Follow Michael on X @MBForex
Latest market news










Web Trader platform
Our sophisticated web-based platform is packed with features.
Open an account today
Experience award-winning platforms with fast and secure execution.
Economic calendar
Related articles

Weekly Equities Outlook: Broadcom, Palo Alto Networks, Dell
Earnings this week from Broadcom, Palo Alto Networks and Dell week keep AI in focus.


Gold and S&P 500 analysis: What now after Warsh’s hawkish speech?
The dollar surged across the board after the Fed Chair Kevin Warsh surprised with a hawkish-leaning speech at the Jackson Hole summit. All the bearish dollar bets that had been accumulated since last Friday on the back of data weakness and bond market troubles had to be squared and that triggered a short squeeze rally for the dollar. Gold and silver dropped, as a result, as too did bitcoin, while US indices were giving back earlier gains.


Nasdaq 100 Forecast: NDX slips ahead of Fed Chair Warsh’s speech
U.S. stocks are edging lower on Friday, giving back some of yesterday's gains after Nvidia's strong outlook revived the tech trade. The focus has now shifted firmly to Fed Chair Kevin Warsh's Jackson Hole speech, with investors looking for more clarity on the outlook for interest rates.