


Gold’s Breakout Represents a Potentially Massive Macro Shift
Gold prices broke out in a very big way this week following months of support at or around the $4k level. The big question now is whether that shift shows across the macro landscape.
Written by
James Stanley
Sr. Strategist
Gold Talking Points:
- After a rough six-month outing gold prices rallied in a very big way over the past week.
- With a weekly gain over 7% as of this writing, it’s the largest such move since January, just before the metal had topped-out, begging the question as to whether buyers are in control and, if so, might that shift have carryover to other markets such as stocks or Treasuries.
After coming into the year with a full head of steam, gold spent much of the past six months in varying forms of distress. But, along the way, it built a falling wedge pattern – which is often approached with the aim of bullish reversals. And over the past week, that is what has so far shown up, as buyers took a step forward in a big way, and prices are re-testing a prior point of resistance that had previously held the highs back in October of last year.
Gold Weekly Chart – The Breakout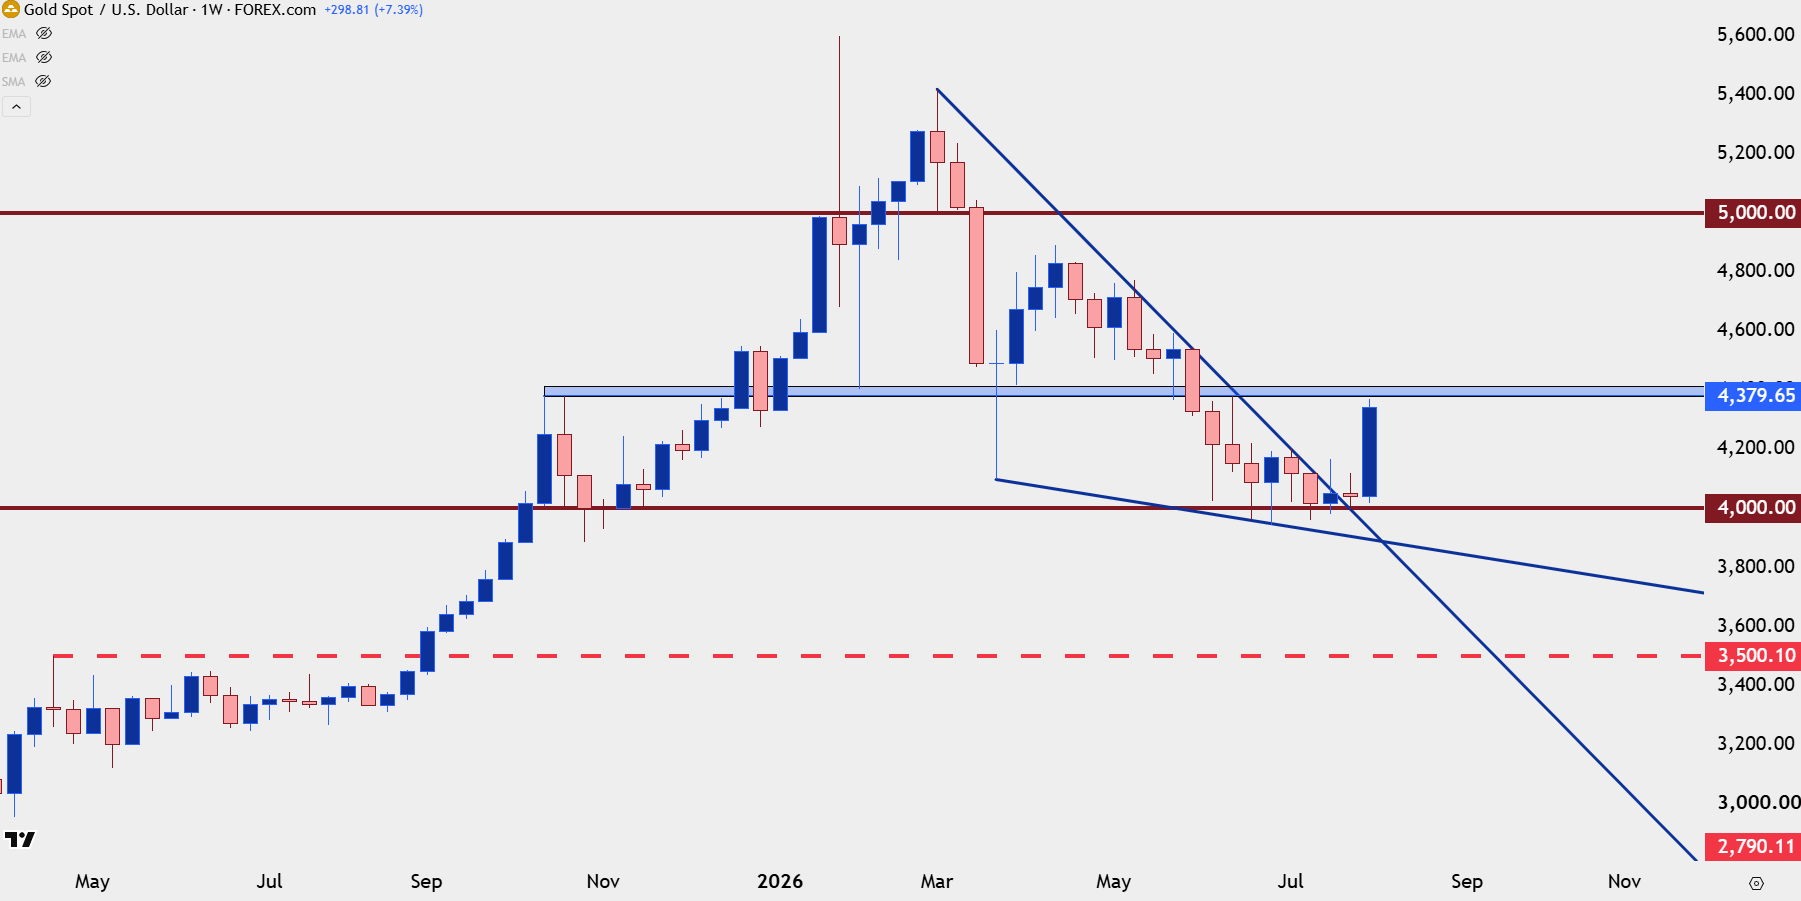
Chart prepared by James Stanley; data derived from Tradingview
What’s Behind the Drive?
I looked at this in the five charts for the week ahead video for StoneX, and I’ve linked that below, but my opinion is that gold is looking or trying to look around the next corner. And after Kevin Warsh seemed to talk a big game on being hawkish at last week’s FOMC meeting without any actual follow-through, gold markets are moving on the basis of a less-hawkish Fed. Now, this doesn’t mean that there won’t be fracture, as we saw at last month’s vote with three dissents actually looking for a hike. And since then, we’ve heard from other Fed members like Paulson or Cook that sounds as though they could also be in that dissent camp voting for a hike before too long.
But, from where we’re at now, it looks as though that inflationary pressure may not be as strong as it was a month or two ago, and this puts perhaps even more pressure on the CPI report for next week.
Gold Leads the Top 5 Charts for Next Week
This content was created by an affiliate of FOREX.com and represents the views and opinions of the author/speakers, not the views and opinions of Forex.com, StoneX Group Inc., or its subsidiaries. The content has not been independently reviewed by FOREX.com.
Gold Structure
At this point the daily chart shows the theme quite cleanly, as the sell-off of lower-lows and lower-highs ran into consolidation through the month of July. Notably – the metal had held above $4k until just after the June FOMC meeting when the bank sounded hawkish and that’s ultimately what brought the test of the big figure in.
It’s the last part of that statement that is most important, as this signified a change-of-pace, which also showed on the weekly chart with the past two weeks showing as higher-lows. And then after this week’s open, bulls wouldn’t even allow for a $4k re-test, as support played at the familiar level of $4023 before the breakout ramped up in a big way.
Also notable from the daily chart is how those prior lower-highs during the consolidation phase now set up as possible higher-lows for the bullish trend scenario.
Gold Daily Chart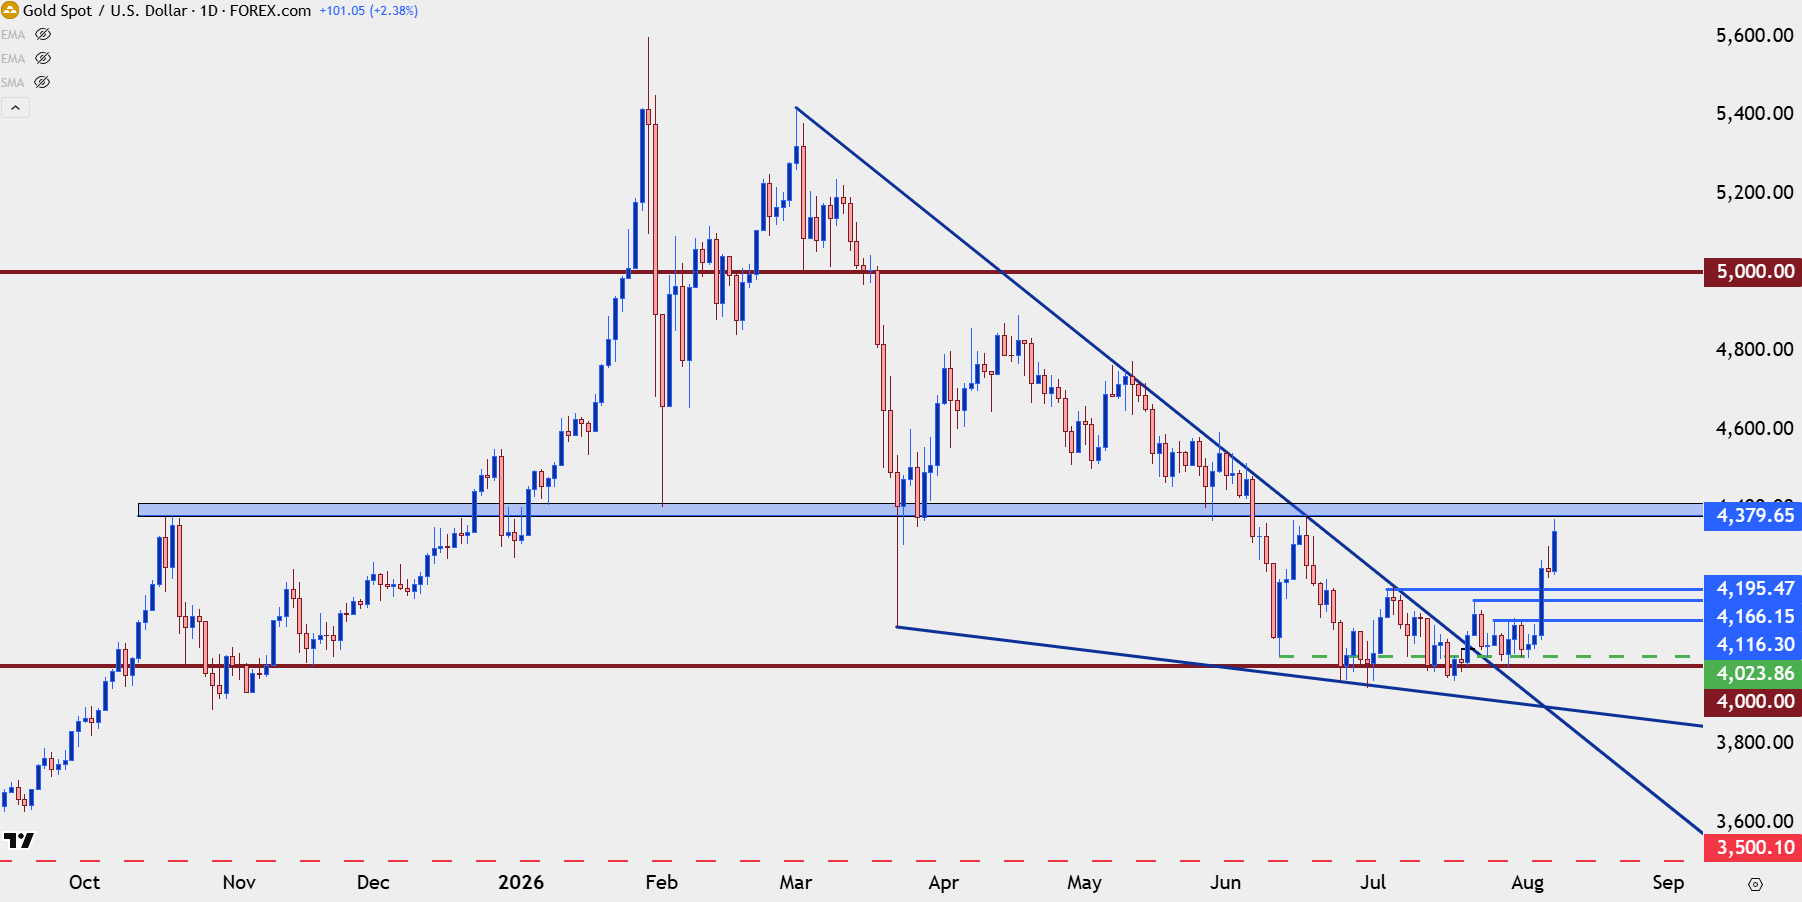
Chart prepared by James Stanley; data derived from Tradingview
Gold Near-Term Strategy
The below four-hour chart is the one that I had shared in the above video, and given how strong the bullish move priced-in, there’s a few different scenarios worth entertaining.
Ideally, bullish momentum would remain so aggressive that pullbacks are mild or moderate, but given the intensity of the CPI release next week, the realm of possible setups should be widened. For nearby supports, both $4300 and $4250 stand out, as does the $4200-$4220 zone.
But, should profit taking drive a deeper pullback, support from around $4160-$4180 could be workable, as could the $4100-$4116 zone.
If buyers fail to hold the move for an almost $300 pullback, it’ll start to look like bulls had failed to take advantage of that rally.
Gold Four-Hour Chart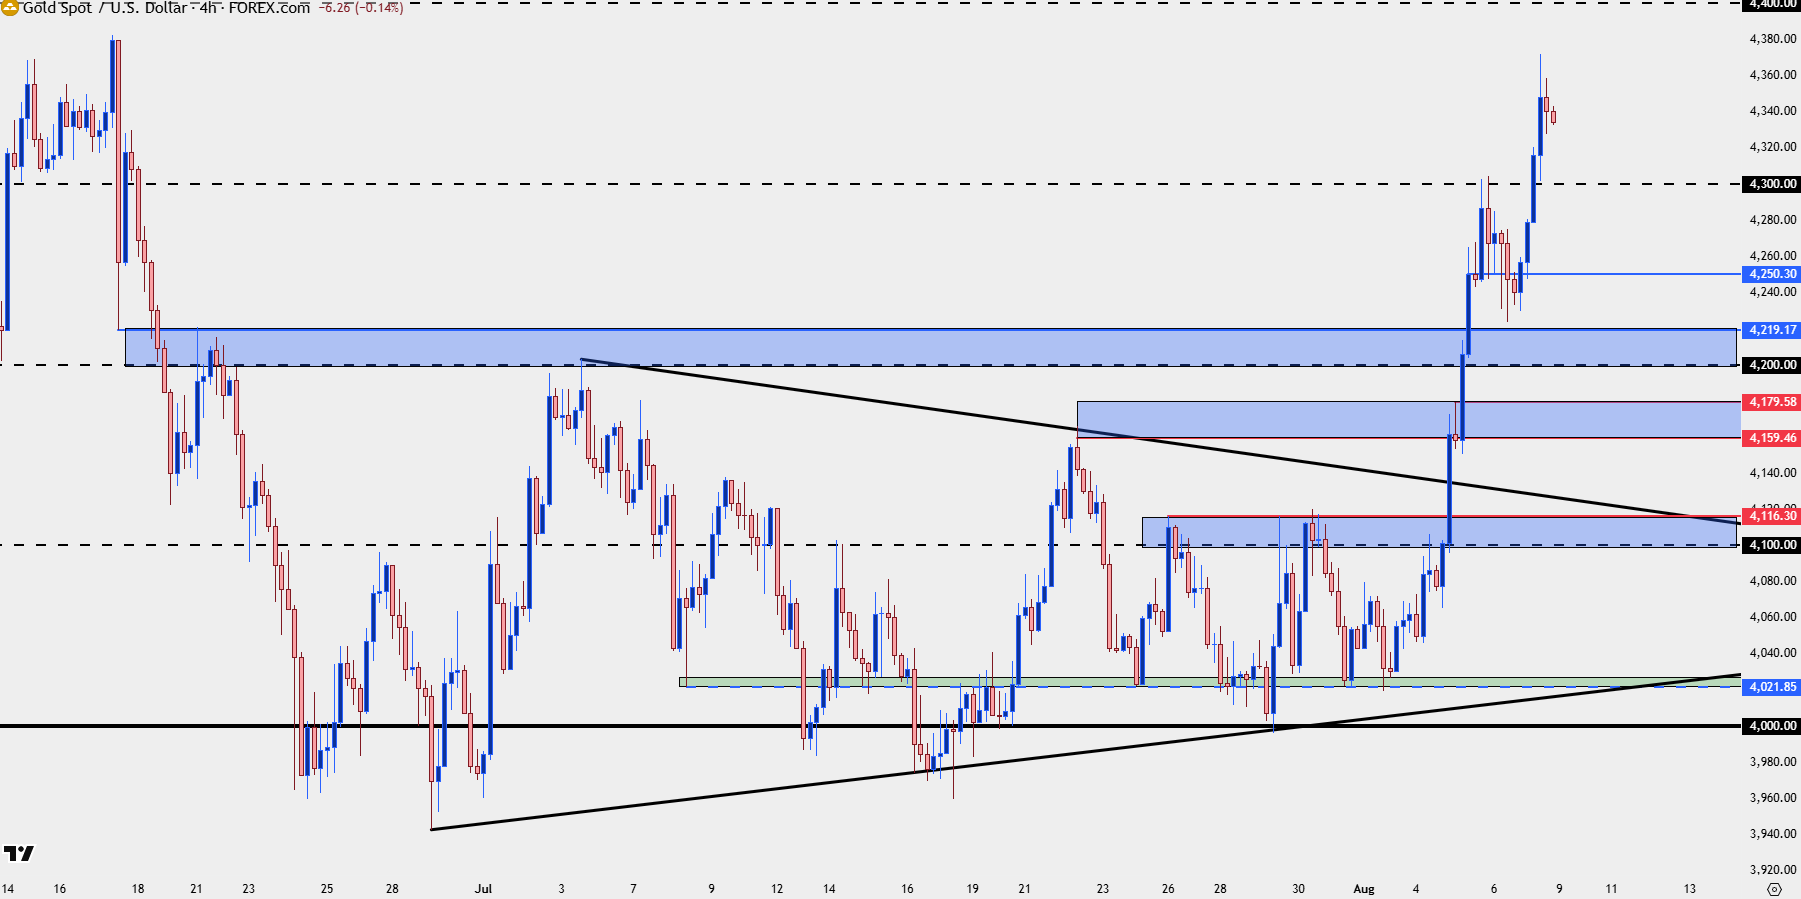
Chart prepared by James Stanley; data derived from Tradingview
--- written by James Stanley, Senior Market Analyst, Global Macro
Related tags:
Latest market news










Web Trader platform
Our sophisticated web-based platform is packed with features.
Open an account today
Experience award-winning platforms with fast and secure execution.
Economic calendar
Related articles

Gold and S&P 500 analysis: What now after Warsh’s hawkish speech?
The dollar surged across the board after the Fed Chair Kevin Warsh surprised with a hawkish-leaning speech at the Jackson Hole summit. All the bearish dollar bets that had been accumulated since last Friday on the back of data weakness and bond market troubles had to be squared and that triggered a short squeeze rally for the dollar. Gold and silver dropped, as a result, as too did bitcoin, while US indices were giving back earlier gains.


Bitcoin Forecast: BTC/USD Back to $80K Ahead of Warsh’s Jackson Hole Speech
After surging over $15,000 in the past 10 days alone, there is risk of a near-term pullback if Warsh says anything remotely hawkish at Jackson Hole - what are the levels to watch from here?


Gold Falters at Resistance, Grappling With PCE, Month-End Flows and Jackson Hole
Gold has pulled back from resistance after sticky PCE data, with month-end flows and Jackson Hole now shaping the near-term outlook.
