

Gold, silver outlook: Trading the ranges before the next break
Gold and silver have been going nowhere fast, but their narrowing ranges may offer trading opportunities. We look at the macro drivers, developing chart patterns and levels to watch.
Written by
David Scutt
Market Analyst
- Gold and silver consolidate following sharp declines
- DXY and Treasury yields struggle for sustained direction
- Gold's narrowing range suggests a potential triangle or pennant
- Silver's potential ascending triangle offers defined trading levels
Compared with some of the wild moves we've seen in markets elsewhere recently, gold and silver have been unusually quiet, at least by their usual standards. Both have settled into relatively narrow trading ranges after sharp declines, with neither showing much in the way of sustained directional momentum.
But range-bound markets don't mean there aren't opportunities for traders. And with both metals starting to form potential triangle patterns on the four-hourly charts, these structures provide something akin to a blueprint when it comes to trade construction.
What's happening beneath the surface?
Perhaps explaining the rangey price action, there's been a lack of directional movement in what have historically been key macro drivers for gold and silver: the US dollar and benchmark US 10-year Treasury yields.
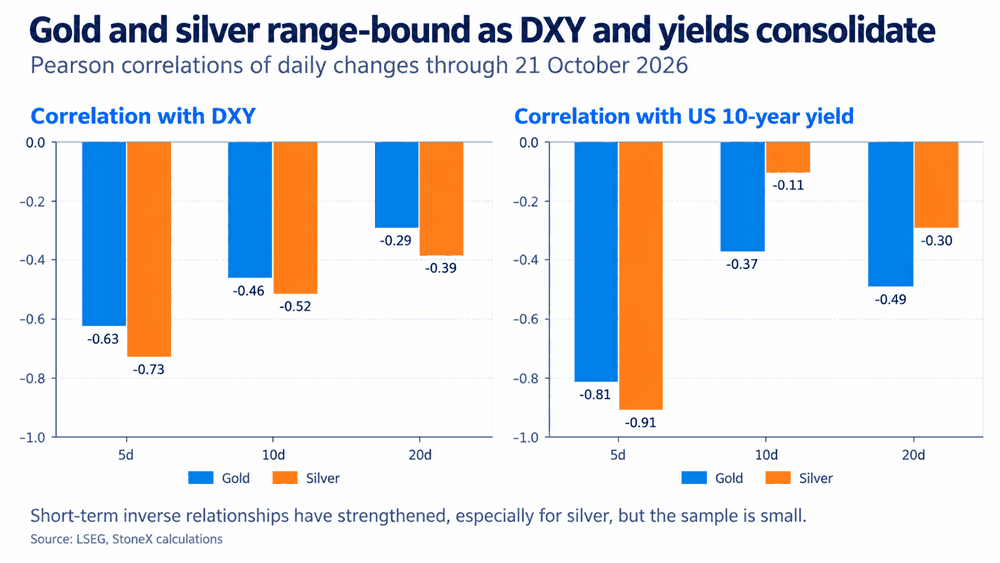
Source: LSEG
Looking at correlations over the past five, ten and twenty sessions, both gold and silver have maintained inverse relationships with DXY and 10-year Treasury yields, with those relationships strengthening considerably over the past week.
Key macro drivers have stalled
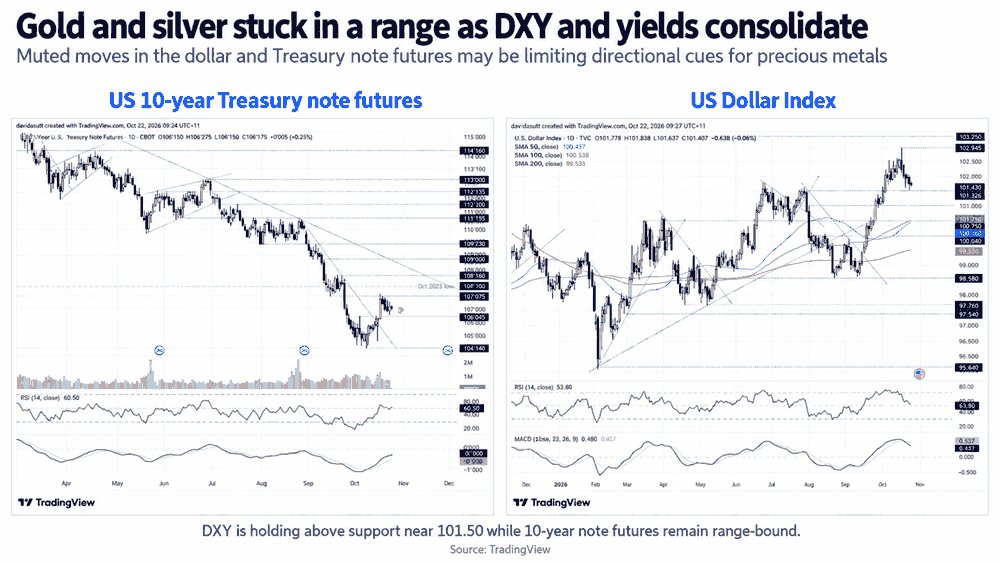
Looking at the price action in both DXY and US 10-year Treasury note futures, it provides further evidence as to why gold and silver have lacked direction recently.
Source: LSEG
US 10-year Treasury note futures, shown on the left, are now oscillating in a relatively narrow range, having managed to bounce from the lows seen earlier this month. At the same time, DXY may have come off its earlier highs, but it too is holding above support at 101.50, continuing to attract bids around and just above that level over the past week.
So we have a scenario where two of gold and silver's key macro drivers are also going nowhere fast. If we're going to see a meaningful increase in volatility in precious metals, it may need to come from a breakout or breakdown in one or both of these markets first.
Gold's narrowing range offers trading opportunities
Source: TradingView
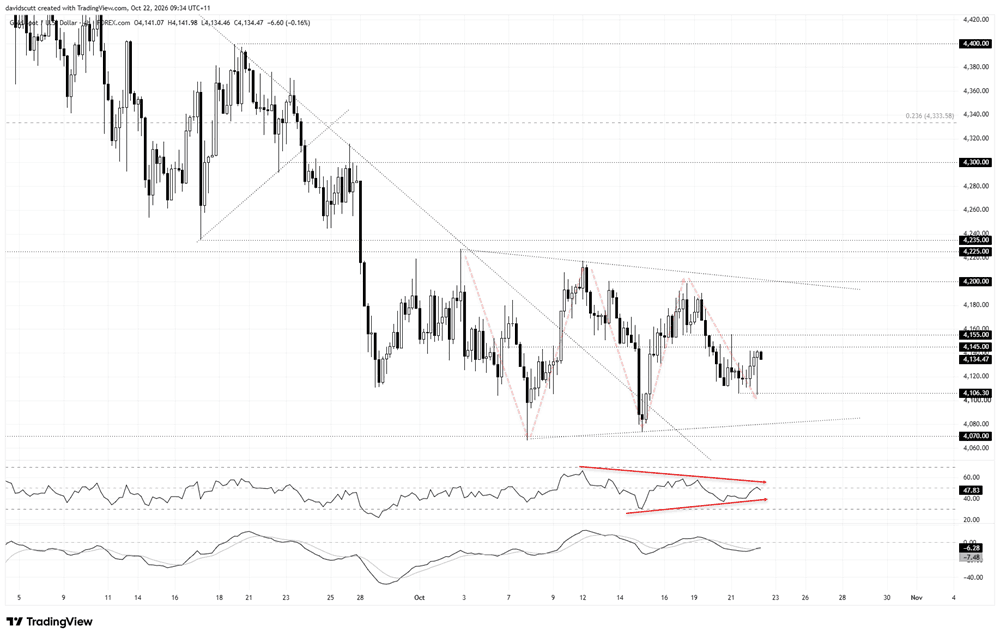
Pretty much since the start of October, gold has been range-bound between resistance at $4,225 and support at $4,070 per ounce. More recently, the range has shown signs of narrowing, consistent with a potential symmetrical triangle or bear pennant, depending on your perspective.
Right now, the evidence isn't strong enough to declare either structure in place, putting greater emphasis on the price action within the narrowing range when assessing directional risk.
You can see gold has attracted bids around $4,106.30 over the past couple of days, including on the last completed four-hourly candle. That took the price back towards resistance at $4,145, with $4,155 another level that's seen plenty of work on either side, creating something of a resistance zone to monitor overhead.
That's the initial range to focus on.
If gold can make a sustainable break above the $4,145–$4,155 resistance zone, bulls may look to target $4,200, where the upper boundary of the narrowing structure intersects with a level where the price has stalled on several occasions over the past week. A break above that would potentially put $4,225 on the menu.
However, if the price fails to break through the resistance zone, the alternative would be to consider positions from the short side, with a tight stop placed within or above the zone for protection, initially targeting $4,106.30 support. Beyond that, the lower boundary of the narrowing structure currently sits just above $4,080, with $4,070 another level of note immediately beneath.
Like the price action, RSI (14) is also displaying a narrowing range, characterised by lower highs and higher lows. While it sits marginally beneath the neutral 50 level, the overall assessment remains neutral. That's backed up by MACD, which has just recorded a bullish crossover but remains in negative territory.
It feels like something may be brewing, but until we see a definitive breakout or breakdown, trading the range using these levels looks to be the easier way to paly it.
Silver's potential ascending triangle takes shape
Source: TradingView
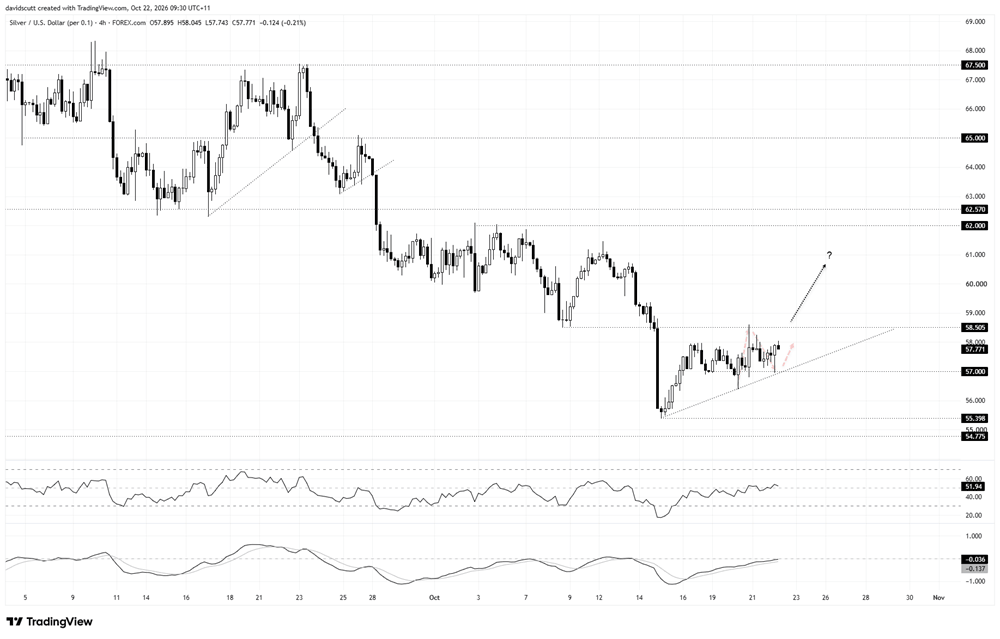
Relative to gold, silver has underperformed so far in October with the price pulling back from resistance at $62 to trade as low as $55.40 per ounce before slowly grinding higher over the past week or so.
Like gold, silver finds itself in a coiling structure, but this one more closely resembles a potential ascending triangle rather than a symmetrical triangle or bear pennant, suggesting we may eventually see upside risk materialise. But until that happens, the emphasis should remain on how the price reacts around known technical levels.
The one to watch overhead right now is $58.50, which was the low set back in the first week of October before being subsequently tested from beneath and rejected, making it a resistance level of note.
Above that, $60 has seen plenty of work on either side recently, although it's a messy level with the price often trading through it before reversing. Keep that in mind if using it as a topside target. Beyond that, $61 and $62 are the next levels of note.
On the downside, we've seen plenty of work around $57 recently, with the price attracting bids there over recent days. Just underneath sits the lower boundary of the potential ascending triangle, making $57 the key level to watch today.
Aside from $56.40, where the price attracted bids on October 20, a break beneath that confluence of support levels may see bears look for a retest of the recent swing low at $55.40, set on October 15.
The oscillators are entirely neutral in their messaging, placing greater emphasis on price action when assessing near-term directional risk. But the broader message is that the bearish momentum that dominated earlier in October has now all but dissipated.
Latest market news











Web Trader platform
Our sophisticated web-based platform is packed with features.
Open an account today
Experience award-winning platforms with fast and secure execution.
Economic calendar
Related articles

Gold and S&P 500 analysis: What now after Warsh’s hawkish speech?
The dollar surged across the board after the Fed Chair Kevin Warsh surprised with a hawkish-leaning speech at the Jackson Hole summit. All the bearish dollar bets that had been accumulated since last Friday on the back of data weakness and bond market troubles had to be squared and that triggered a short squeeze rally for the dollar. Gold and silver dropped, as a result, as too did bitcoin, while US indices were giving back earlier gains.


EUR/USD forecast: All eyes on Warsh at Jackson Hole - Forex Friday
For much of this week, the EUR/USD has been edging lower with the US dollar regaining some ground after last week’s sell-off that was triggered, in part, by the bond market worries. Investors have been unwilling to bet further against the US dollar so far this week ahead of Kevin Warsh’s keynote speech at the Jackson Hole summit, due later today.

Bitcoin Forecast: BTC/USD Back to $80K Ahead of Warsh’s Jackson Hole Speech
After surging over $15,000 in the past 10 days alone, there is risk of a near-term pullback if Warsh says anything remotely hawkish at Jackson Hole - what are the levels to watch from here?
