


Gold Update XAUUSD slides after hawkish Fed signals
The trading week continues, and so far, gold is once again showing clear short-term weakness. During the session, the price is down more than 2.00%, while selling pressure has returned shortly after today’s Federal Reserve decision and comments.
Written by
Julian Pineda
Market Analyst
The trading week continues, and so far, gold is once again showing clear short-term weakness. During the session, the price is down more than 2.00%, while selling pressure has returned shortly after today’s Federal Reserve decision and comments.
This event has strengthened the bond market again and has also supported the US dollar, two factors that have made it difficult for XAU/USD to maintain consistent demand in the short term. Under this scenario, the renewed weakness could remain relevant over the coming trading sessions.

Federal Reserve decision takes center stage
During the session, the central bank kept interest rates unchanged in the 3.50% - 3.75% range, in a unanimous decision by board members. One of the main reasons behind this decision is that the 2.00% inflation target has still not been fully achieved, while average inflation levels remain above what was expected at the beginning of the year.
In addition, Warsh, the new Federal Reserve Chair, emphasized that inflation remains the central pillar of monetary policy management. He also noted that inflation staying above the target for more than five years can continue to pressure households. For this reason, markets did not interpret the comments as a signal of lower rates, but rather as a sign that policy could remain cautious to more restrictive over the coming months.
Another important event after the Federal Reserve decision was the release of the new dot plot, which showed an upward revision in interest rate expectations. The median federal funds rate projection for the end of 2026 rose to 3.8%, from 3.4% in March, reflecting a more restrictive stance among FOMC participants. Several members now expect rates above 4.00% by the end of the year, while only a minority project levels below the current range. Overall, the chart suggests that the Fed is not preparing for a near-term rate-cutting cycle but is instead keeping the possibility of elevated rates for longer, and even additional hikes, open if inflation persists.

Source: FederalReserve
In fact, this scenario of potentially higher rates sooner than expected is also reflected in the CMEGROUP probability table for upcoming monetary policy decisions. At the moment, the probability of a 0.25% hike at the September 16 meeting is starting to stand out, with the chances of another rate increase now close to 48%.
This probability has risen sharply after the meeting, considering that just one month ago it stood near 17%. It now also exceeds the probability of rates remaining unchanged in September, which is around 33.5%. This suggests that a potential rate-hiking scenario and a more aggressive Federal Reserve could be arriving earlier than markets expected a few weeks ago.
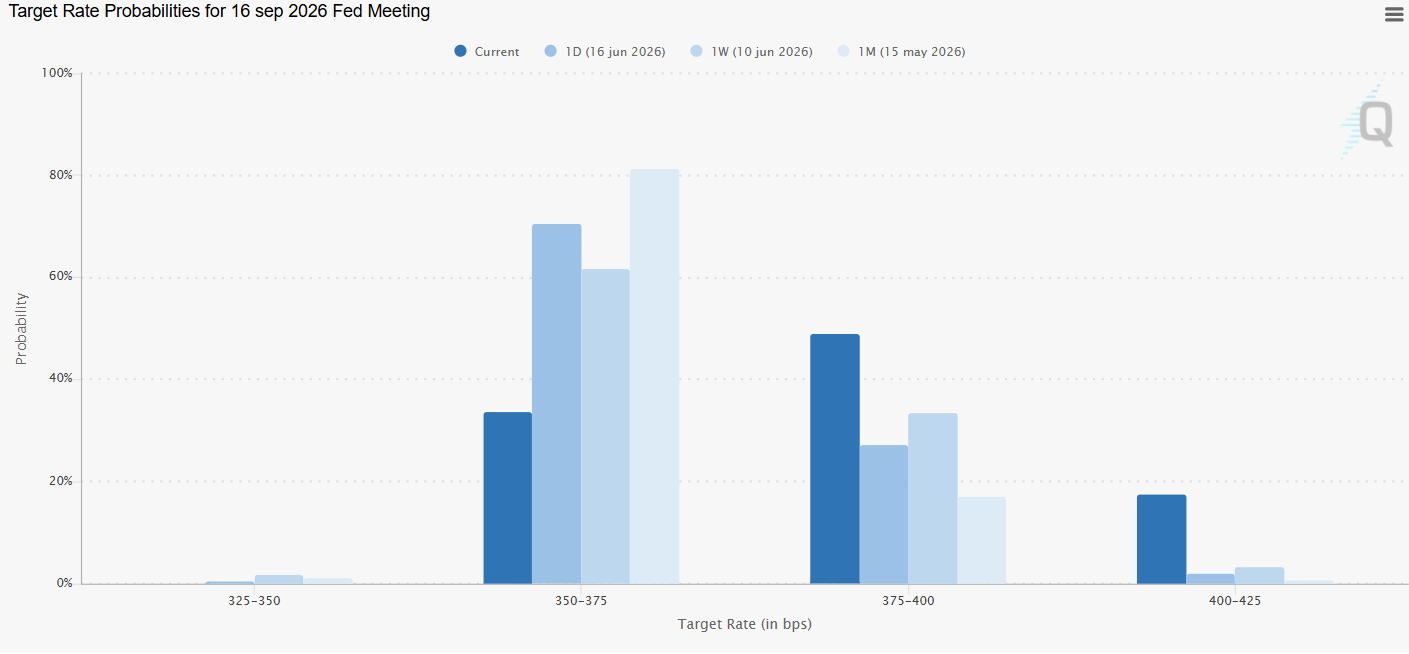
Source: CMEGROUP
For gold, this environment is not particularly favorable. The new outlook for higher-than-expected interest rates has started to support one of its main competing markets again: the US 10-year Treasury market. Shortly after the central bank decision, yields showed a relevant recovery and are now holding an upward slope, near the 4.5% area in the short term.
This behavior is partly linked to the message left by the Fed. If the central bank maintains a more restrictive stance or opens the door to higher rates, bond yields can regain appeal, increasing competition against gold as a reserve asset.
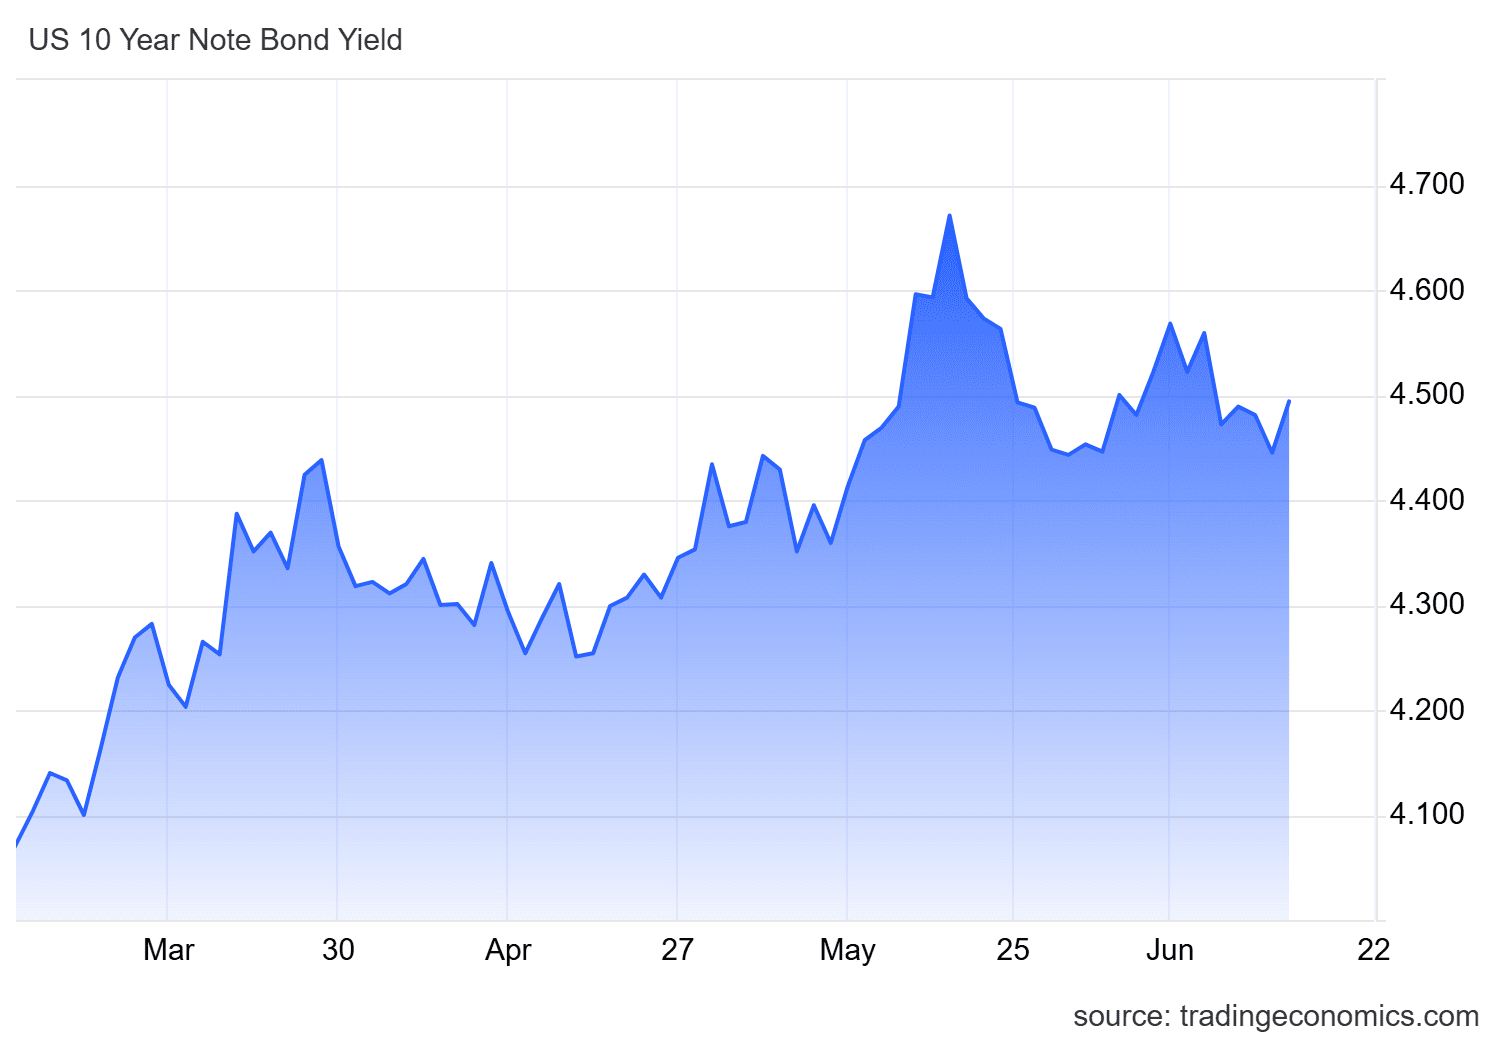
Source: TradingEconomics
With all this in mind, the Federal Reserve’s monetary policy decision has not been especially favorable for short-term gold demand. A more aggressive outlook from the central bank has started to support the bond market again, which remains one of the metal’s main substitutes.
Because gold does not offer a fixed yield, it can lose appeal when bonds regain strength and offer higher rates. If this dynamic continues, part of the demand could keep moving toward fixed-income instruments, making it harder for XAU/USD to build a consistent recovery. In this context, selling pressure could remain relevant over the coming sessions.
Technical outlook for gold

Source: StoneX, Tradingview
- Long bearish trendline regains relevance: Despite the recovery that the gold market had tried to maintain in previous weeks, the latest price declines have brought attention back to the most relevant technical structure on the chart: a broad bearish trendline that has been in place for several months. If selling pressure stabilizes with more strength over the coming sessions, this structure could continue to extend as the dominant pattern over the following weeks.
- RSI: Now, the RSI line has started to fall again below the 50 level, suggesting that average selling impulses are starting to gain relevance in the short term. If this dynamic continues, the current bearish pressure could become more important over the coming sessions.
- MACD: However, the MACD still shows a different picture compared with RSI. The histogram remains close to the 0 line, reflecting that there is still an important balance in the average strength of short-term moving averages. This also highlights that indecision remains part of recent price behavior.
Key levels to watch:
- 4,470 USD – Crucial resistance: Relevant high that aligns with the major bearish trendline and coincides with the barrier formed by the 200-period simple moving average. Price action moving toward this level could begin to put the bearish structure at risk and open the door to a possible dominant buying bias over the following weeks.
- 4,340 USD – Near-term barrier: Relevant neutral zone that coincides with the 23.6% Fibonacci retracement line. This point could work as a tentative level to watch if bullish corrections continue over the coming sessions.
- 4,000 USD – Critical support: Important low area that coincides with recent lows and represents the most relevant psychological zone now. Price action below this level could revive the selling bias seen in previous weeks and give continuity to the major bearish trendline as the dominant chart pattern over the following weeks.
Written by Julian Pineda, CFA, CMT – Market Analyst
Follow him on: @julianpineda25







Web Trader platform
Our sophisticated web-based platform is packed with features.
Open an account today
Experience award-winning platforms with fast and secure execution.
Economic calendar
Related articles

Gold and S&P 500 analysis: What now after Warsh’s hawkish speech?
The dollar surged across the board after the Fed Chair Kevin Warsh surprised with a hawkish-leaning speech at the Jackson Hole summit. All the bearish dollar bets that had been accumulated since last Friday on the back of data weakness and bond market troubles had to be squared and that triggered a short squeeze rally for the dollar. Gold and silver dropped, as a result, as too did bitcoin, while US indices were giving back earlier gains.


AUD/CAD breakout puts the Bradman barrier in sight
A bullish breakout has pushed AUD/CAD to its highest level since early 2021. Whether it can clear 0.9994 may determine if the move extends well above parity.


Bitcoin Forecast: BTC/USD Back to $80K Ahead of Warsh’s Jackson Hole Speech
After surging over $15,000 in the past 10 days alone, there is risk of a near-term pullback if Warsh says anything remotely hawkish at Jackson Hole - what are the levels to watch from here?
