


Jackson Hole FX Returns: Volatility Analysis for USD Dollar, FX Majors
Jackson Hole takes centre stage as Kevin Warsh makes his Fed Chair debut, with 27 years of FX returns revealing a clear volatility pattern.
Written by
Matt Simpson
Market Analyst
Kevin Warsh’s first Jackson Hole speech as Fed Chair arrives with rate expectations finely balanced and markets still learning how to interpret his policy signals. Historical analysis since 1998 shows volatility tends to rise sharply on speech day, while directional returns across the US dollar and FX majors are far less consistent.
View related analysis:
How USD and FX Majors Trade Around Jackson Hole
Jackson Hole takes centre stage this week, with Kevin Warsh set to deliver his first speech at the symposium as Federal Reserve Chair. While the event has historically been a platform for important policy signals, expectations are lower that Warsh will use the occasion to telegraph the Fed’s next rate decision.
Instead, traders will be looking for greater clarity on how the Warsh Fed intends to operate, given the relatively little time markets have had to adjust to his less explicit communication style. Ultimately, markets may learn more about how Warsh intends to run the Fed than what it plans to do at its next meeting. Whether that includes the Fed’s reaction function to inflation and growth, the rise in crude oil and Treasury yields, or clues on the balance sheet and communication framework remains to be seen. That leaves plenty of scope for volatility if Warsh challenges how markets currently understand the Fed, even without signalling an imminent policy change.
Fed Hike Odds Sit on a Knife Edge
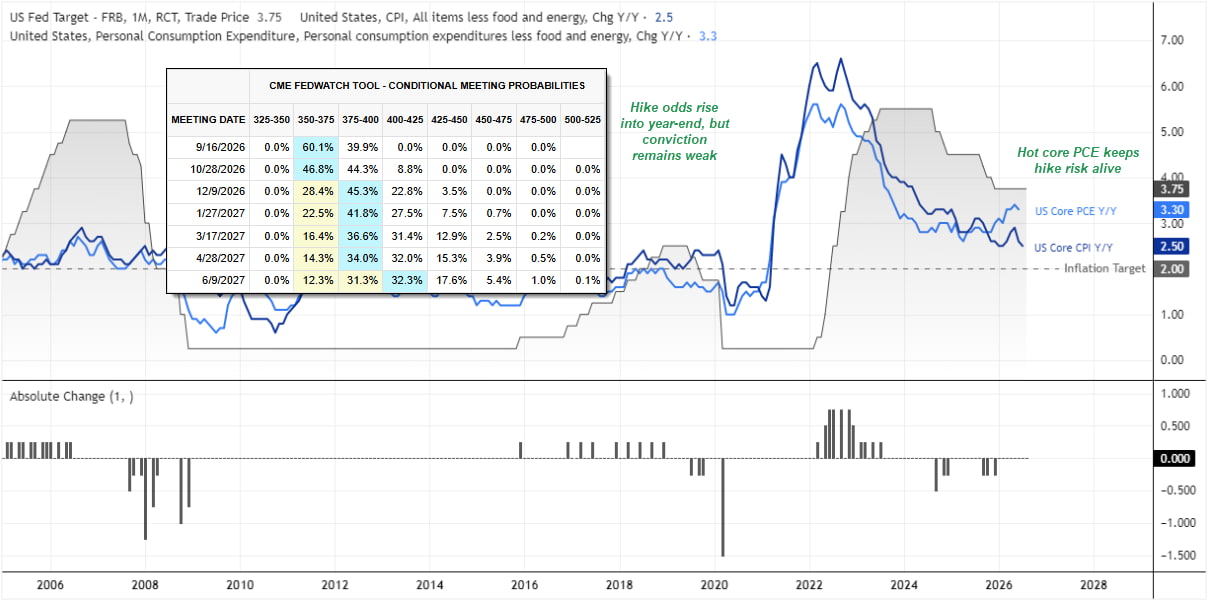
Traders are currently pricing just one Fed hike for the remainder of 2026, but conviction around its timing remains weak. Fed funds futures imply roughly a 35% chance of a September hike and around 66% by December, leaving the outlook finely balanced between no further tightening and one final move higher.
That uncertainty has only increased since the July meeting, where Warsh’s less explicit guidance left markets searching for a clearer reaction function. With inflation still elevated but recent jobs and spending data softer, Jackson Hole could shift those odds sharply even if Warsh stops short of signalling an imminent hike.
PCE inflation is released ahead of Warsh’s speech, making it an important final input for traders assessing the likelihood of another Fed hike. A hotter or softer print could shift rate expectations before Jackson Hole even begins.
Source: CME
Warsh Needs No Policy Shift to Move Markets
Jackson Hole has produced some major policy signals, but not every Fed Chair has used it to announce a shift. Some speeches have barely moved markets; others have materially changed how investors viewed the Fed. So while Warsh may not reveal an imminent policy change, even a subtle shift in tone could move Treasury yields and the US dollar sharply, and trigger broader market volatility.
|
Year |
Fed Chair |
Jackson Hole Takeaway |
Notable Market Reaction |
|
1998 |
Greenspan |
Global stress preceded Fed easing |
USD and equities volatile amid Russia/LTCM stress |
|
2007 |
Bernanke |
Fed signalled willingness to respond to the subprime crisis |
Rate-cut expectations increased as credit stress intensified |
|
2010 |
Bernanke |
Helped lay the groundwork for QE2 |
USD weakened as further QE expectations grew |
|
2012 |
Bernanke |
Reinforced the case for further QE |
USD came under pressure; gold and equities benefited |
|
2020 |
Powell |
Introduced flexible average inflation targeting |
USD weakened as markets priced greater tolerance for inflation |
|
2022 |
Powell |
Delivered a forceful hawkish inflation message |
Stocks plunged and Treasury yields rose; USD strengthened |
|
2024 |
Powell |
Signalled the time had come to adjust policy |
USD and Treasury yields fell; equities rallied |
|
2025 |
Powell |
Shifted focus towards labour-market risks and easing |
USD and short-term yields fell; equities rallied |
|
2026 |
Warsh |
TBC |
TBC |
How the US Dollar Index Trades Around Jackson Hole
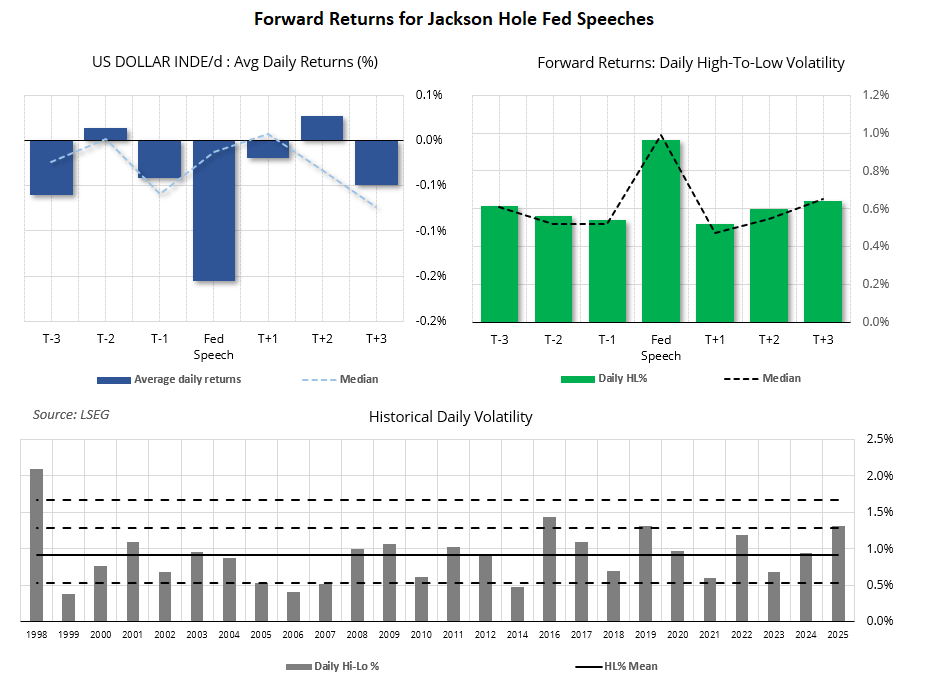
While history shows why Jackson Hole can matter, it also highlights how inconsistent the directional response can be from one year to the next. The more reliable historical pattern is volatility, with DXY tending to see its largest average move on the Fed Chair’s speech day itself.
Data since 1998 show daily volatility tends to peak on the day of the Fed speech. The US dollar index has posted an average daily range of 0.9% and a median of 1%. With the two measures so close, the pattern looks relatively robust — and that is broadly reflected across the three trading days either side of the speech.
DXY Volatility Rises, but Direction Remains Uncertain
Notice how volatility gradually declines from T-3 to T-1, which ties in with my earlier point that markets could quieten heading into Warsh’s speech. Volatility then tends to fall to its lowest level on the first trading day afterwards (T+1), before gradually picking up again.
The lower chart shows that while the average speech-day range is 0.91%, volatility has fallen below one standard deviation at 0.53% on five occasions, but exceeded one standard deviation at 1.29% just three times. The most volatile was Greenspan’s 1998 speech, when the daily range topped 2%.
Interestingly, DXY has generated an average return of around -0.2% on speech day, although the median is only marginally negative at -0.01% — effectively flat. That suggests picking direction from historical performance is closer to a coin flip than simply observing that volatility tends to rise. Ultimately, Jackson Hole may create opportunity through larger moves, but the directional bias for the US dollar is far less certain.
Source: ICE, TradingView
For a closer look at FX performance, I will also provide the average returns and volatility levels for some of the key FX majors.
EUR/USD (Euro) Forward Returns Analysis
Source: LSEG
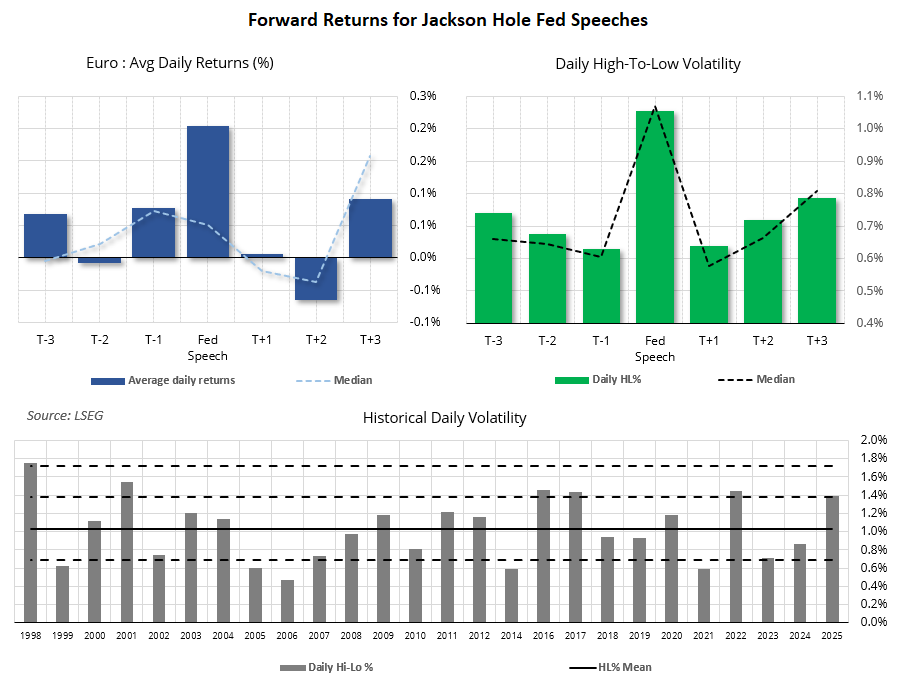
- Euro volatility peaks on Fed speech day, with the average high-low range rising to roughly 1.0%.
- Average speech-day EUR/USD returns are positive at around 0.2%, though the median is much smaller, suggesting limited directional consistency.
- Volatility tends to ease into the speech from T-3 to T-1, then drops sharply on T+1 before rebuilding.
- Speech-day volatility has varied widely by year, from roughly 0.5% to 1.8%, reinforcing that Jackson Hole is more reliable as a volatility event than a directional signal.
GBP/USD (British Pound) Forward Returns Analysis
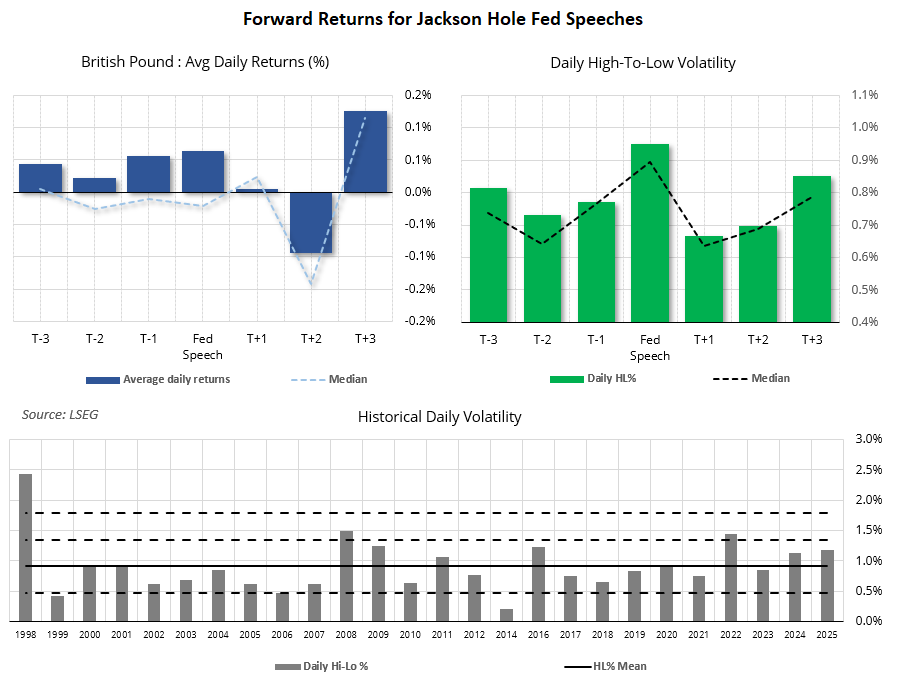
GBP/USD shows much less directional bias on speech day than EUR/USD, with average and median returns close to flat despite volatility still rising.
Source: LSEG
USD/JPY (Japanese Yen) Forward Returns Analysis
USD/JPY shows unusually weak directional consistency around Jackson Hole, with the average speech-day return almost flat despite a clear jump in intraday volatility to roughly 1.1%. That makes it look more like a two-way volatility trade than a clean directional setup.
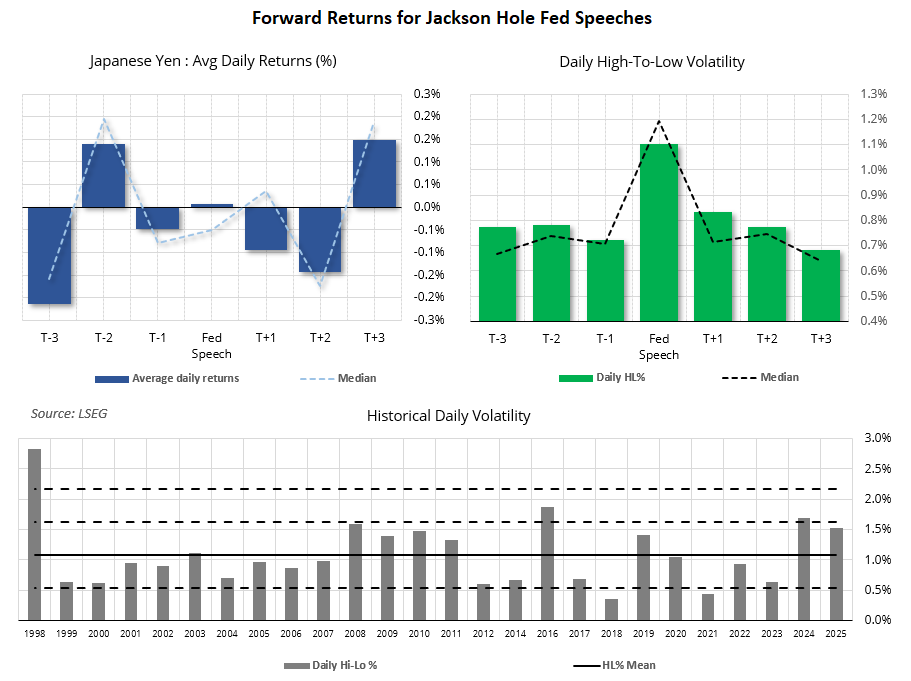
Source: LSEG
USD/CHF (Swiss Franc) Forward Returns Analysis
USD/CHF stands out for tail risk, with 2011 producing a speech-day range above 3% — far beyond the typical Jackson Hole move.
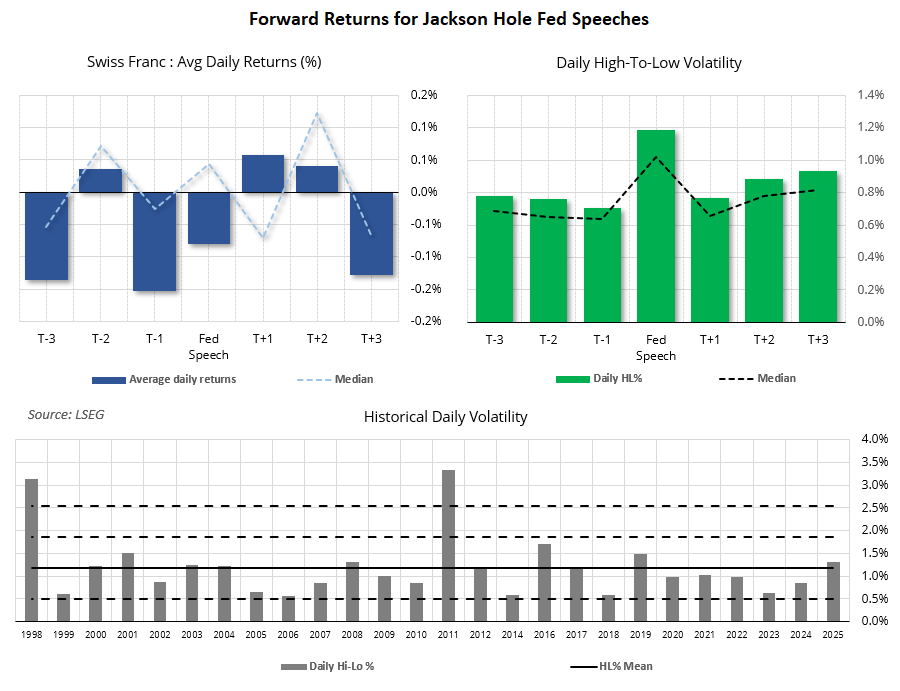
Source: LSEG
USD/CAD (Canadian Dollar) Forward Returns Analysis
USD/CAD shows one of the clearest bearish speech-day biases, with both average and median returns around -0.2% to -0.3%. Speech-day volatility rises to roughly 0.9%, but remains relatively contained compared with some other FX majors.
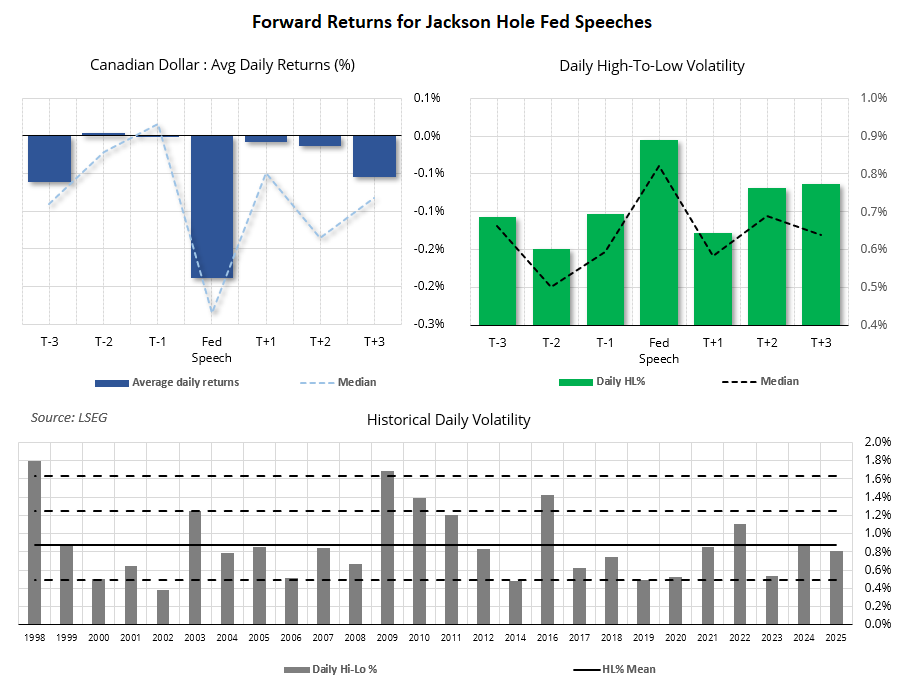
Source: LSEG
AUD/USD (Australian Dollar) Forward Returns Analysis
AUD/USD shows one of the clearer positive speech-day biases, with both average and median returns notably above zero, while volatility also rises sharply on the day of the Fed speech.
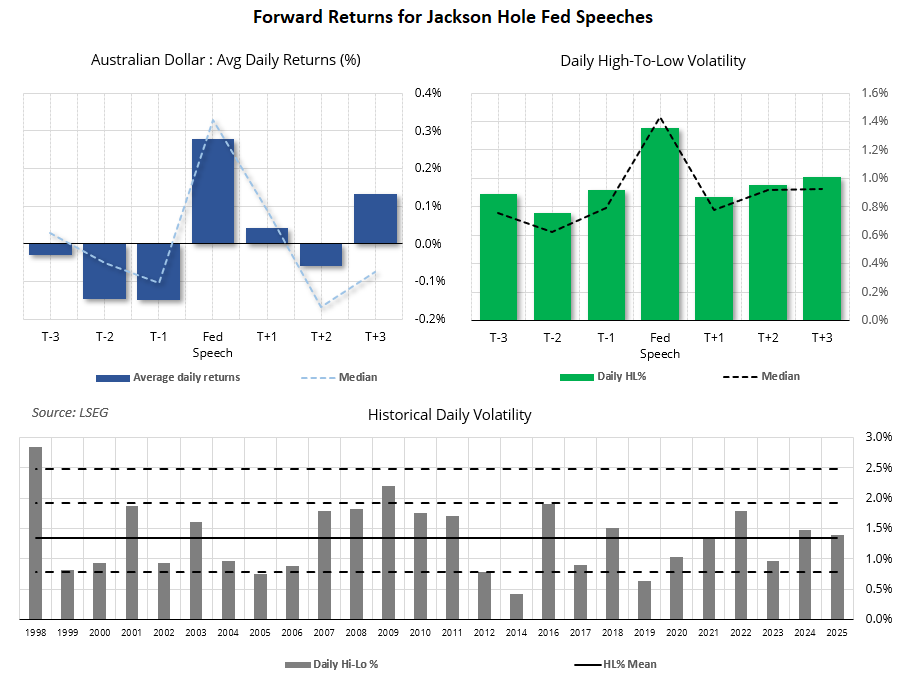
Source: LSEG
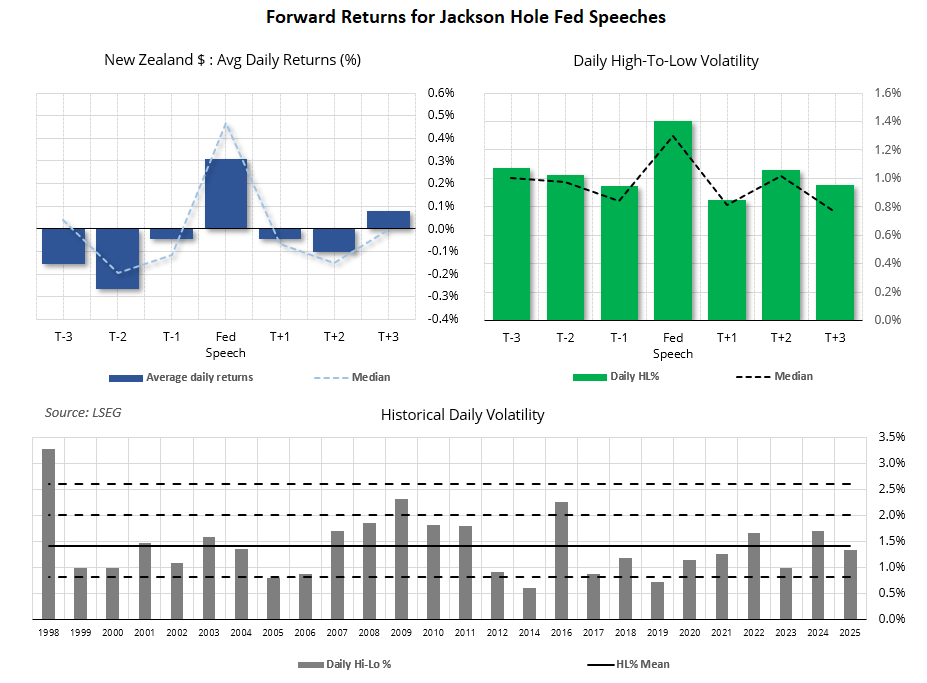
NZD/USD (New Zealand Dollar) Forward Returns Analysis
NZD/USD shows the strongest positive speech-day bias of the FX majors so far, with both average and median returns clearly positive.
Source: LSEG
Related tags:
Latest market news









Web Trader platform
Our sophisticated web-based platform is packed with features.
Open an account today
Experience award-winning platforms with fast and secure execution.
Economic calendar
Related articles

EUR/USD forecast: All eyes on Warsh at Jackson Hole - Forex Friday
For much of this week, the EUR/USD has been edging lower with the US dollar regaining some ground after last week’s sell-off that was triggered, in part, by the bond market worries. Investors have been unwilling to bet further against the US dollar so far this week ahead of Kevin Warsh’s keynote speech at the Jackson Hole summit, due later today.


Bitcoin Forecast: BTC/USD Back to $80K Ahead of Warsh’s Jackson Hole Speech
After surging over $15,000 in the past 10 days alone, there is risk of a near-term pullback if Warsh says anything remotely hawkish at Jackson Hole - what are the levels to watch from here?

DAX and EUR/USD forecast: Lower energy prices, yields offer support
But the question, of course, is how much further oil prices and bond yields can fall. For now, the combination is supportive of risk assets and is helping to sustain a relatively benign decline in the dollar. The focus today will be on US core PCE inflation, due for release shortly, while Nvidia’s second-quarter earnings will provide another test for risk appetite after the US markets close – not just for US indices but for global tech-heavy indices given the influence Nvidia has over the global tech and AI names.