


Japanese Yen Outlook: US CPI, Intervention Risks Put USD/JPY Bulls on Notice
Japanese yen weakness has returned, but renewed intervention risk and Wednesday’s US CPI report could challenge the USD/JPY recovery.
Written by
Matt Simpson
Market Analyst
The Japanese yen came under broad pressure on Monday, allowing yen crosses to recover some of their post-intervention losses. However, with the MOF and US Treasury prepared to coordinate again and US CPI due Wednesday, yen bears may be playing with fire as USD/JPY approaches key resistance.
View related analysis:
Japanese Yen Outlook: USD/JPY Faces CPI and Intervention Risks
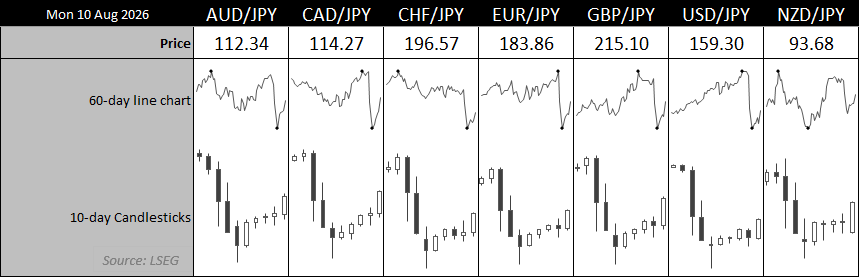
The Japanese yen was the weakest FX major on Monday, falling against all other FX majors and allowing yen pairs to recoup some of their post-intervention losses. GBP/JPY rose around 1% to a one-week high, while the 0.9% gain on USD/JPY marked its best day since January.
The move looks less like a fresh bout of US dollar strength and more like a partial unwinding of the post-intervention yen squeeze, with traders seemingly willing to rebuild yen-funded carry positions as the initial shock fades. However, there is a significant difference this time around: traders know that Japan is prepared to intervene again, and the US Treasury has joined forces with the Ministry of Finance to support the yen.
Source: LSEG
Yen Weakness Returns, but Intervention Risk Remains
That arguably makes the current yen sell-off a case of traders playing with fire. The underlying carry dynamics still favour yen weakness, but the prospect of another coordinated intervention means the risk is no longer simply about getting the direction wrong. A sharp and potentially disorderly reversal remains a genuine threat, particularly if USD/JPY approaches the levels that previously prompted action.
For now, however, the yen has begun to retrace some of its intervention-driven gains. The charts show how far that recovery could extend across the major yen crosses.
Softer US CPI Could Renew Pressure on USD/JPY
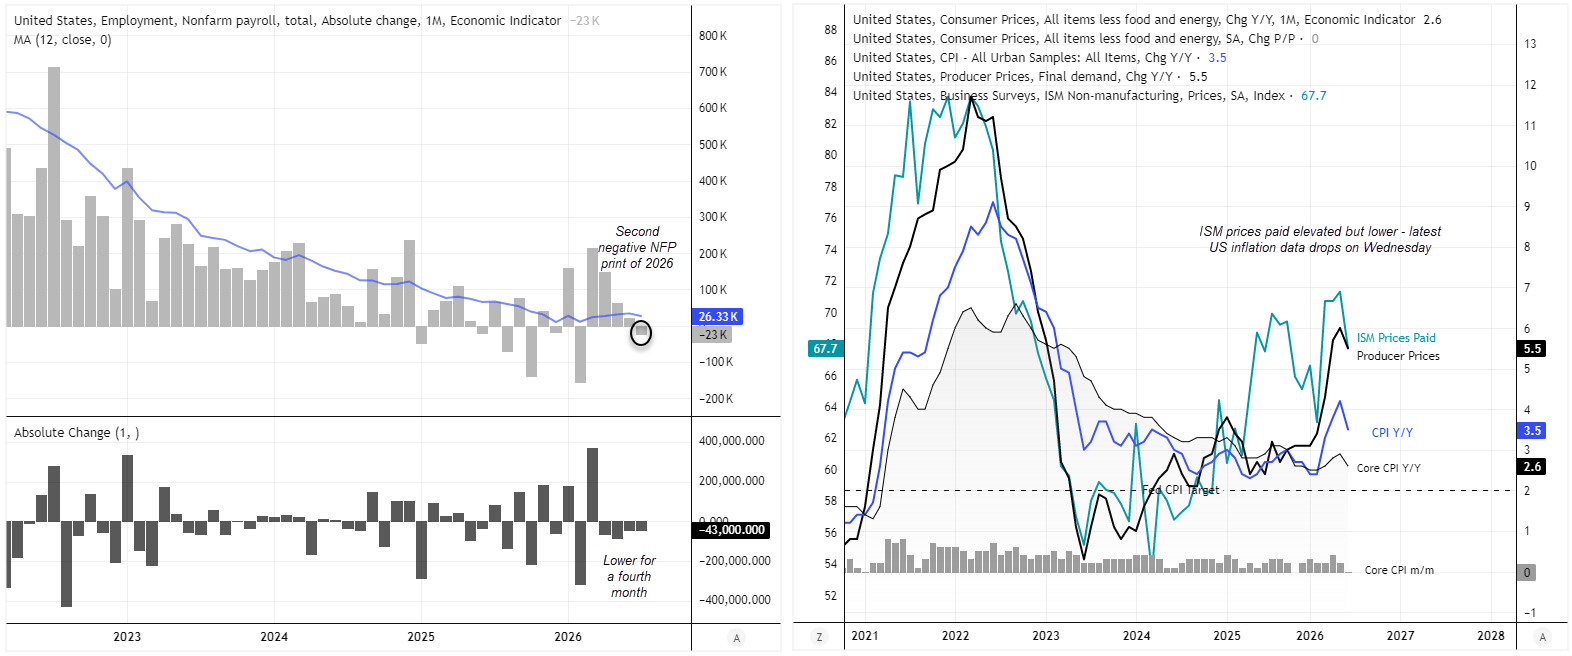
While traders would be wise to keep a wary eye on the potential for fresh intervention in the yen, the main calendar event is Wednesday’s US inflation report. Traders have scaled back bets of a Fed hike in recent weeks, with Friday’s nonfarm payrolls report being the latest to disappoint. This puts traders on high alert for pockets of weak US data, and US CPI is no exception.
With the MOF joining forces with the US Treasury and vowing to intervene, even a slightly softer CPI report could bode well for USD/JPY bears. And that means we’ll be keeping a very close eye on how USD/JPY responds to the plethora of resistance levels nearby.
Source: BLS, ISM, LSEG

USD/JPY Technical Analysis: US Dollar vs Japanese Yen
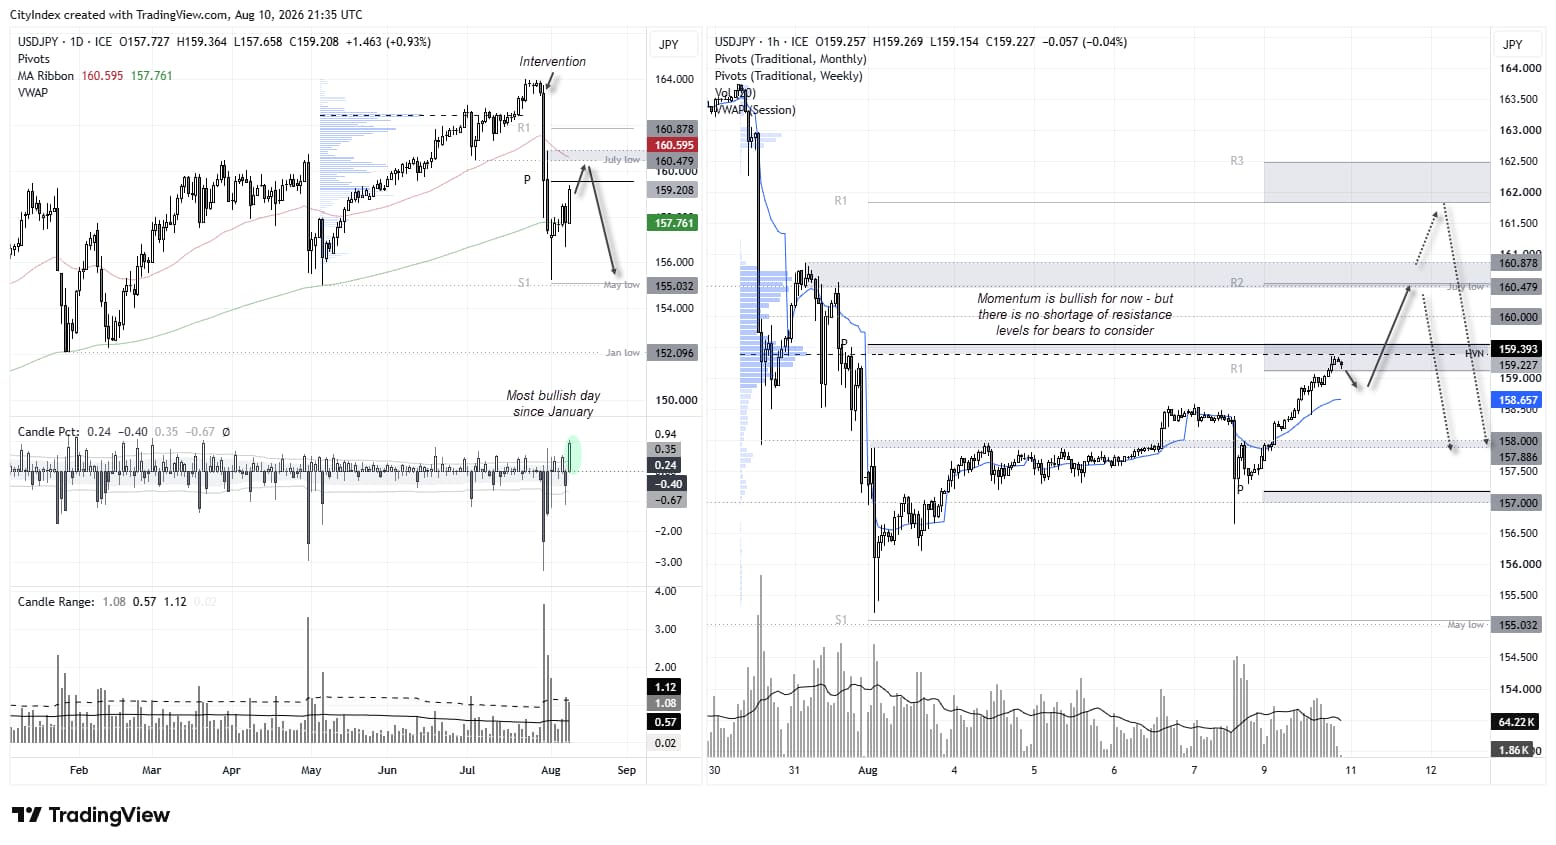
The daily chart shows that USD/JPY managed to use the 200-day EMA as a springboard and rally to a six-day high, marking its most bullish day since January. Still, the high-to-low range indicator (bottom panel) shows that volatility remains low compared to the bearish sell-off after the MOF and US Treasury joined forces to intervene in the yen and send it lower by 4% over a two-day period. The sell-off was also exacerbated by the less hawkish-than-expected FOMC meeting.
Ultimately, this move appears corrective to my eyes. And with the risk of another round of intervention growing while USD/JPY continues to rally, bulls may want to tread with caution and keep a close eye on resistance levels.
Tuesday’s high met resistance at the monthly pivot point (159.53), with the 160 handle, July low (160.47) and 160.88 high all providing additional levels of resistance for bears to track. But if US CPI comes in soft, it could provide a great timing tool for the MOF to pull the trigger again – like they did after a soft US CPI print in July 2024.
Source: ICE, TradingView
View the full economic calendar
-- Written by Matt Simpson
Follow Matt on Twitter @cLeverEdge
How to trade with City Index
You can trade with City Index by following these four easy steps:
- Open an account, or log in if you’re already a customer
• Open an account in the UK
• Open an account in Australia
• Open an account in Singapore
- Search for the market you want to trade in our award-winning platform
- Choose your position and size, and your stop and limit levels
- Place the trade
Related tags:
Latest market news










Web Trader platform
Our sophisticated web-based platform is packed with features.
Open an account today
Experience award-winning platforms with fast and secure execution.
Economic calendar
Related articles

EUR/USD forecast: All eyes on Warsh at Jackson Hole - Forex Friday
For much of this week, the EUR/USD has been edging lower with the US dollar regaining some ground after last week’s sell-off that was triggered, in part, by the bond market worries. Investors have been unwilling to bet further against the US dollar so far this week ahead of Kevin Warsh’s keynote speech at the Jackson Hole summit, due later today.


Gold Falters at Resistance, Grappling With PCE, Month-End Flows and Jackson Hole
Gold has pulled back from resistance after sticky PCE data, with month-end flows and Jackson Hole now shaping the near-term outlook.

DAX and EUR/USD forecast: Lower energy prices, yields offer support
But the question, of course, is how much further oil prices and bond yields can fall. For now, the combination is supportive of risk assets and is helping to sustain a relatively benign decline in the dollar. The focus today will be on US core PCE inflation, due for release shortly, while Nvidia’s second-quarter earnings will provide another test for risk appetite after the US markets close – not just for US indices but for global tech-heavy indices given the influence Nvidia has over the global tech and AI names.