


Silver, Nasdaq Price Outlook: Fed, NFP and DXY in Focus
Silver is approaching a major multi-decade price zone, while the Nasdaq continues consolidating just below its record highs. With several macro catalysts approaching, markets may be preparing for their next significant move.
Written by
Razan Hilal
Market Analyst
Silver is approaching a major multi-decade price zone, while the Nasdaq continues consolidating just below its record highs. With several macro catalysts approaching, markets may be preparing for their next significant move.
This week's key themes include:
- Fed Governor Kevin Warsh's speech (5:00 PM GST today) for further clues on interest rate expectations.
- The US Dollar Index (DXY) facing the key 102 breakout zone, while 100.80 remains the primary downside level to watch.
- Friday's US Nonfarm Payrolls (NFP) report, which could significantly influence the DXY and Nasdaq while inversely impacting precious metals.
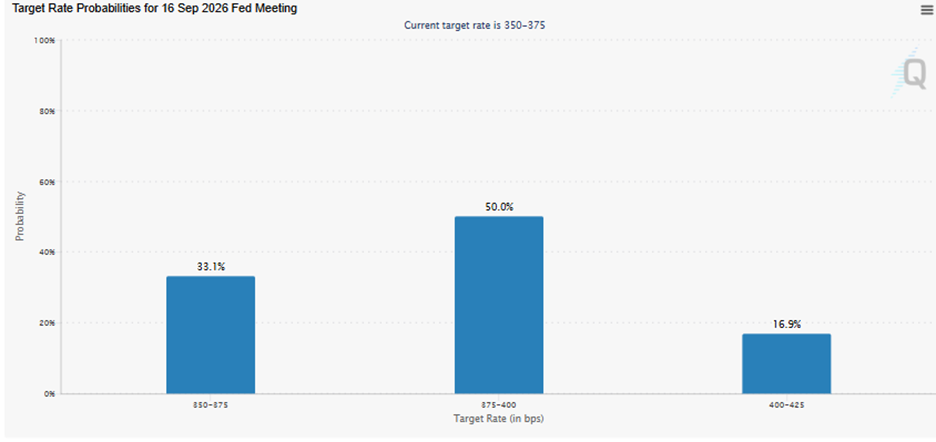
CME Fed Watch Tool
Source: Trading view
The following chart remains one of the primary drivers of financial markets, helping explain the combination of persistent US dollar strength, weakness across precious metals, and a cautious rally in US equities alongside continued softness in Bitcoin.
Markets continue to price a greater than 50% probability of a September rate hike, reinforcing the higher-for-longer narrative.
Another aspect worth monitoring is the gradual evolution of the petrodollar system. As oil settlements increasingly take place in yuan and as transit fees through the Strait of Hormuz are reportedly settled in yuan and UAE dirhams under regional arrangements, maintaining confidence in the US dollar becomes increasingly important.
Against that backdrop, another Fed rate hike could help preserve the long-term bullish structure that has defined the DXY since 2008.
With that macro framework in mind, let's turn to the key technical scenarios for silver and the Nasdaq.
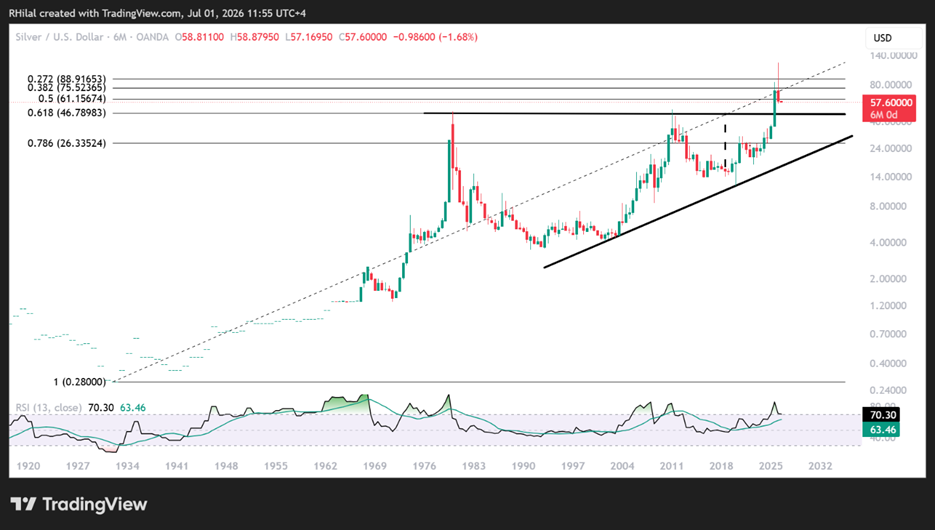
Silver Price Outlook: 6 Month Time Frame – Log Scale
Source: Trading view
I'm using the six-month timeframe to highlight the alignment between the 1980–2024 multi-decade resistance zone and the 61.8% Fibonacci retracement of the entire move from the all-time low in 1920 through the 2026 high, located near the $45–46 region.
Price action is currently holding below 61, which marks the previous 2026 low, while also remaining below the 50% retracement of the secular trend. At the same time, monthly momentum, after reaching historically overbought conditions, continues to unwind.
This combination builds the case for a possible decline toward the 61.8% Fibonacci retracement, where a long-term bullish accumulation zone could emerge before another attempt toward triple-digit prices.
On the upside, reclaiming the 61 level would strengthen the short-term bullish outlook, exposing the following resistance levels:
- 63
- 65
- 67
The final level separating the broader bullish and bearish outlook remains 71.30.
These levels align with the Fibonacci retracement ratios of the June 22–June 26 decline.
Nasdaq Price Outlook: Daily Time Frame – Log Scale

Source: Trading view
Outlook: Ascending Triangle Formation?
From a price action perspective, the Nasdaq continues consolidating below its 30,700 record high, potentially forming an ascending triangle.
At the same time, momentum indicators are also consolidating while attempting a bullish breakout, potentially providing an early signal that another record high may be approaching.
Bullish Scenario
Holding above 30,320, which represents the 23.6% Fibonacci extension of the March low – June high – June low wave, would expose:
- 30,600 (27.2% Fibonacci extension and triangle resistance)
A confirmed breakout above that area would target:
- 31,400 (38.2%)
- 31,900 (50%)
- 32,400 (61.8%)
Alternative Scenario
Alternatively, consolidation could continue, allowing prices to realign with the triangle's lower boundary.
A sustained break below:
- 29,900
- 29,600
- 29,400
would expose the lower triangle support near 29,000, where another rebound could emerge.
Failure to hold 29,000 would increase the probability of another 1,000-point decline, exposing the 28,600–28,200 region.
Bottom Line
This week's market direction is likely to be determined by the interaction between Federal Reserve expectations, the US dollar, and Friday's Nonfarm Payrolls report.
A stronger DXY would continue to pressure precious metals while supporting the case for further consolidation in US equities. Conversely, renewed weakness in the dollar could provide the catalyst for another recovery in silver while allowing the Nasdaq to challenge fresh record highs.
Written by Razan Hilal, CMT
Follow on X: @Rh_waves







Web Trader platform
Our sophisticated web-based platform is packed with features.
Open an account today
Experience award-winning platforms with fast and secure execution.
Economic calendar
Related articles

Canadian Dollar Forecast: USD/CAD Weekly Reversal Puts Yearly Uptrend Back in Focus 8 29 2026
USD/CAD has staged its strongest weekly advance since June, shifting the focus to whether a more durable low is finally taking shape.


USD/JPY weekly outlook: Payrolls may challenge the Fed’s hawkish reset
USD/JPY has finally woken from its slumber. Payrolls now loom as the key test of whether the latest hawkish repricing sticks or sinks.


Euro Short-term Outlook: EUR/USD Pullback Nears Pivotal Uptrend Support 8 28 2026
Warsh's comments accelerated the EUR/USD selloff, raising the stakes as buyers look to stabilize the broader recovery.