

US Dollar Price Action Setups as Global Yields Jump: USD/JPY, EUR/USD, Gold, SPX
This was a wide-ranging session that followed a support test in the S&P 500 as an ongoing theme, as climbing bond yields put the world a little more on edge.
Written by
James Stanley
Sr. Strategist
USD Talking Points:
- This was a wide-ranging webinar covering numerous topics and markets, with timestamps for each on the linked YouTube video below.
- The challenge on the long side of the USD at the moment is whether USD/JPY can rally significantly above the 160.00 handle, and, in-turn, bullish setups in EUR/USD, GBP/USD and AUD/USD are attractive.
Global Yields
Ballooning government deficits haven’t been much of a problem over the past 15 years but they’re suddenly threatening to unsettle several markets. With long-term US yields already at 19-year highs and Japanese, French and German yields already at highs, this is more of a global issue. And, for the US, with an oncoming maturity wall in Treasury issuance, there’s the very real prospect of more supply on the long end of the curve.
And like most other markets, supply can spell lower prices, and for bonds, that comes along with higher yields. There’s a lot of repercussion that could happen from that as it makes borrowing more expensive and unless the economy can rein in spending, there’s even more reason for market participants to avoid buying bonds for fear of greater supplies and lower prices driving even higher yields.
This is a debt spiral, and it’s a very real problem when it appears.
I think I’m less of the doom-and-gloom on the topic, as, eventually, US yields can get to a point where taking the risk becomes more worthwhile. But – that can serve as a deterrent from investing in stocks or chasing a pullback in equities as the expensive AI trade just continues to get more and more expensive.
I don’t think that we’re there yet although that’s something that can show in the next year. For now, that fear can show as opportunity, such as I looked at early in this webinar with prices in NQ and ES pulling back for a support test.
At this point, SPX is still working on the 23.6% Fibonacci retracement of the recent rally.
SPX, S&P 500 Daily Price Chart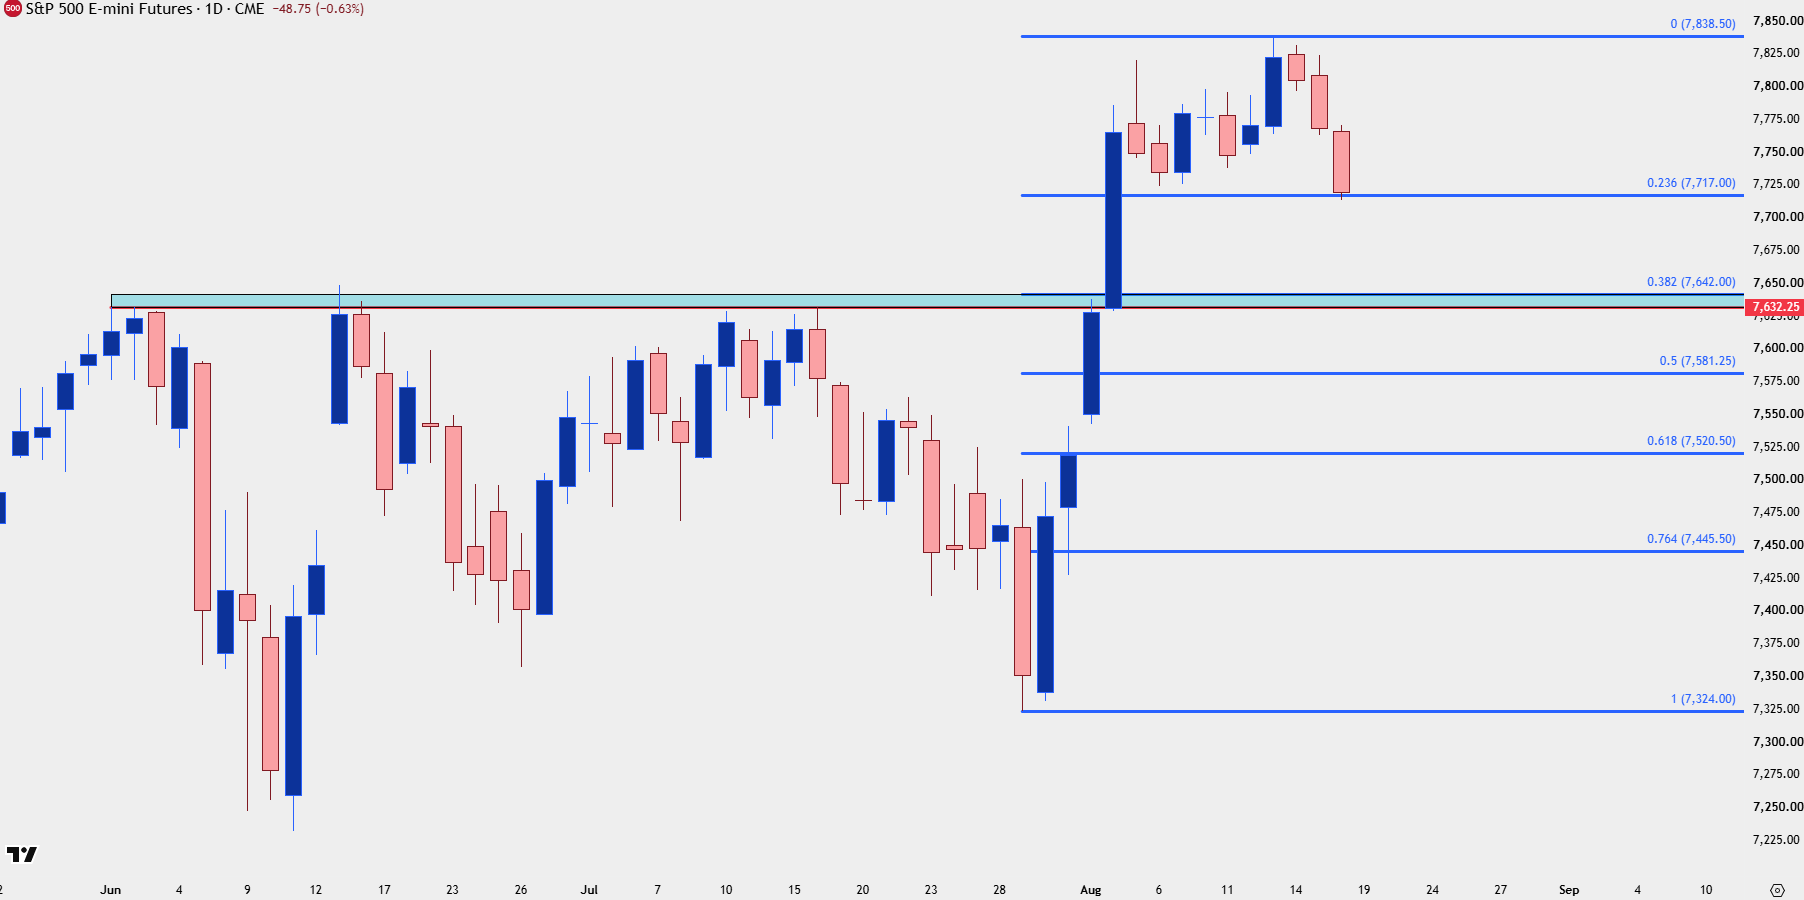
Chart prepared by James Stanley; data derived from Tradingview
USD
At this point the Dollar feels vulnerable given the lower-lows through August combined with the fundamental backdrop. For prolonged USD-strength to take hold then, likely, we’ll need to see at least some participation from USD/JPY. And that would mean that the efforts of the BoJ and US Treasury Department are being faded by markets and that seems a difficult argument to bolster.
If there is a theoretical cap on upside and if risk-reward ratios get less attractive as price re-approaches resistance, that can eventually play through for a bearish reversal. And in this case, a harder sell-off in USD/JPY can bring that to fruition although that scenario hasn’t presented yet.
US Dollar Four-Hour Price Chart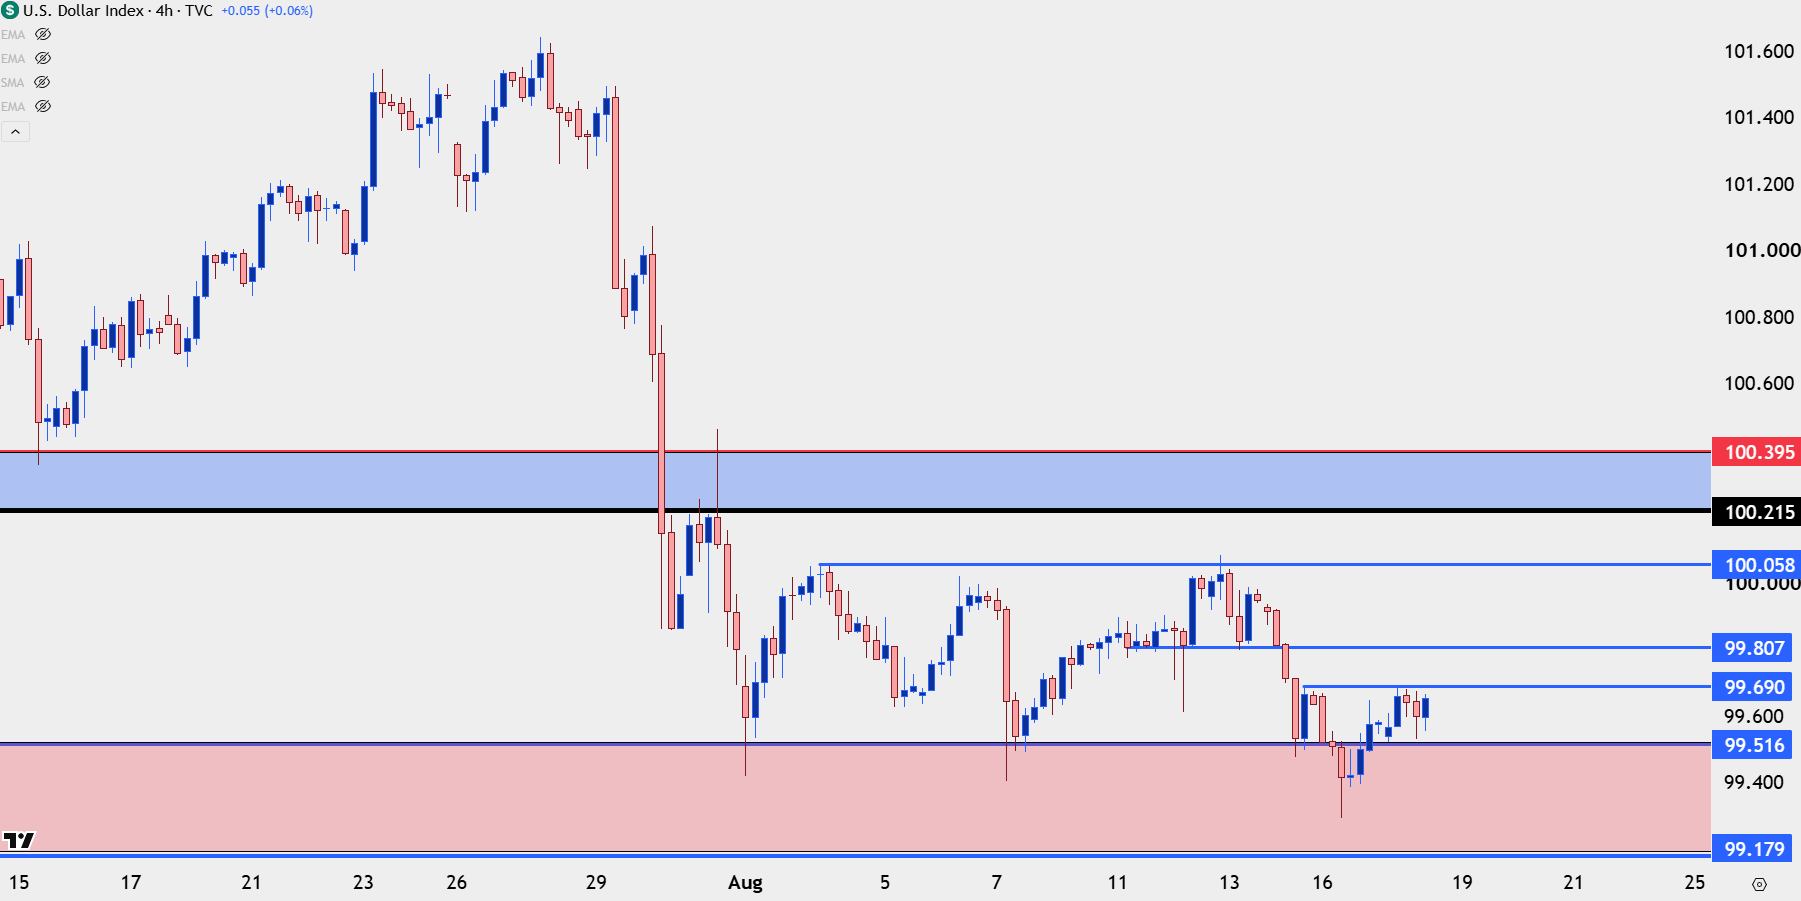
Chart prepared by James Stanley; data derived from Tradingview
USD/JPY
USD/JPY is still a cat and mouse game. Pullbacks are attractive on the long side as there’s still positive carry and an attractive risk-reward for a re-test of highs can continue to draw buyers into the equation. The bigger question is perhaps what happens when or if the pair tests above 160?
It seems unlikely at this point that the BoJ has a hard offer at 160 but it also seems unlikely that they would ignore a continued breakout beyond that price, but the big question is for how long that might last?
For now, bulls are tip-toeing a little bit higher and price is getting closer to the 160.00 handle, and I still expect this to be the driving force behind the USD and related trends.
USD/JPY Four-Hour Price Chart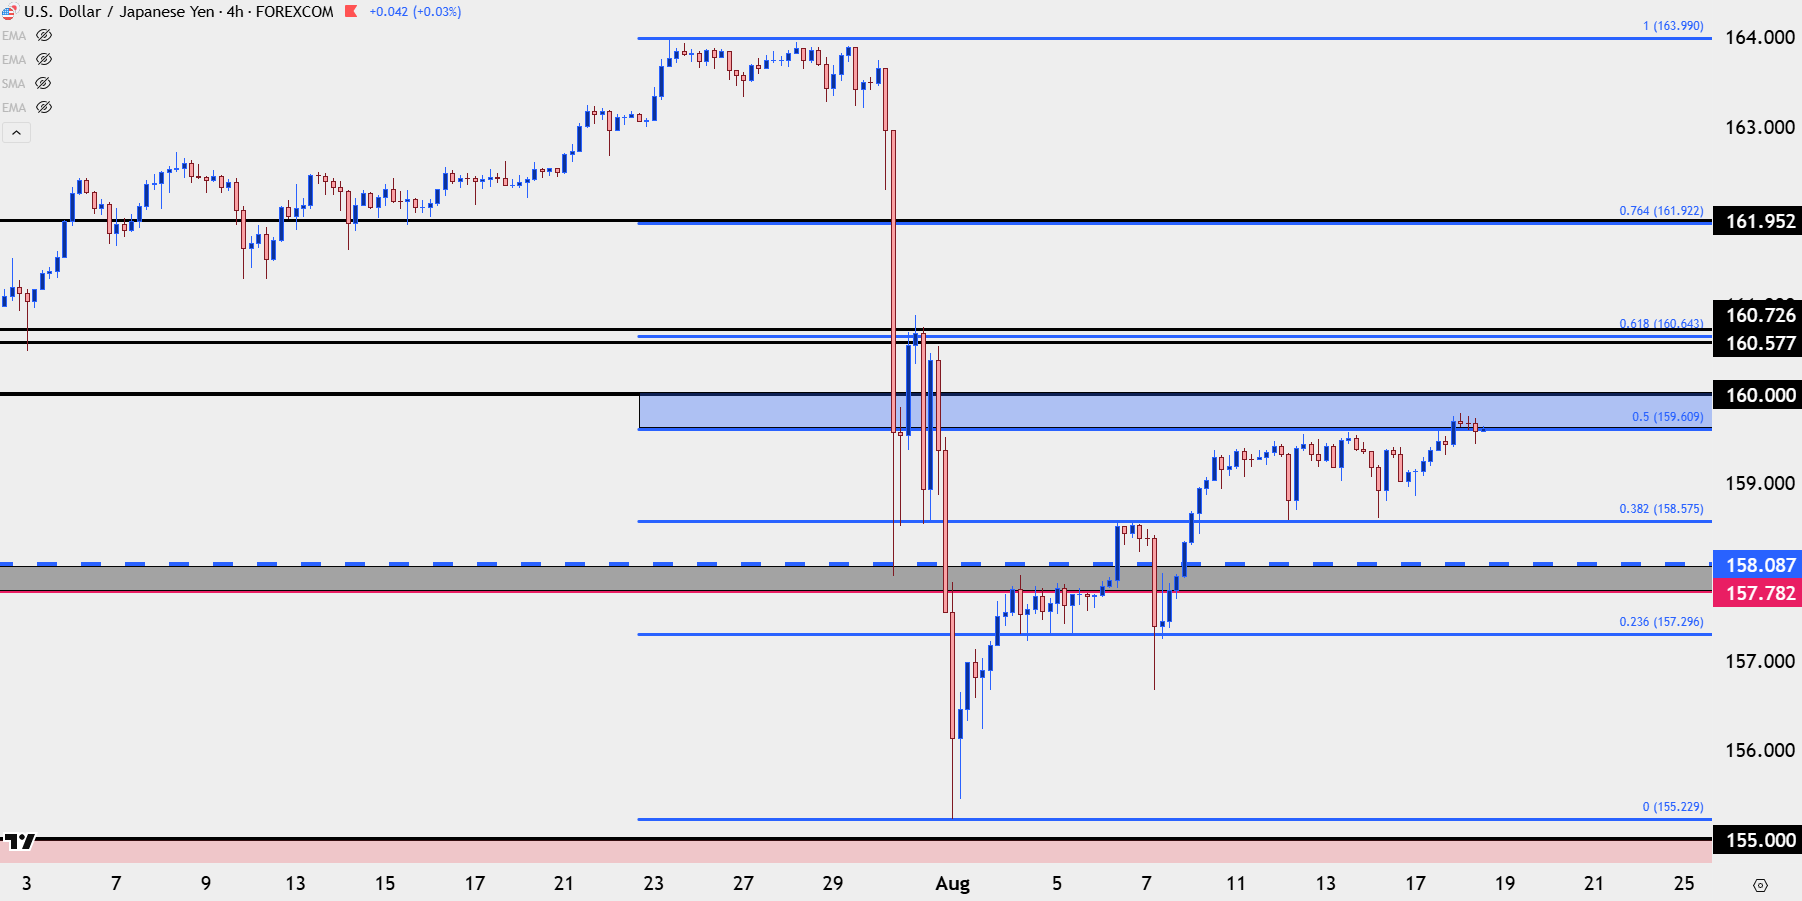
Chart prepared by James Stanley; data derived from Tradingview
EUR/USD
With the fireworks or potential for fireworks elsewhere, USD/JPY has retained clean structure over the past few webinars and at this point the pair is bristling for another breakout.
The top-end of the 1.1576-1.1613 zone has come into play and the next zone up is from 1.1669-1.1686. For support, ideally a pullback would hold 1.1537-1.1545 with the 1.1500-1.1515 zone serving as invalidation.
EUR/USD Daily Chart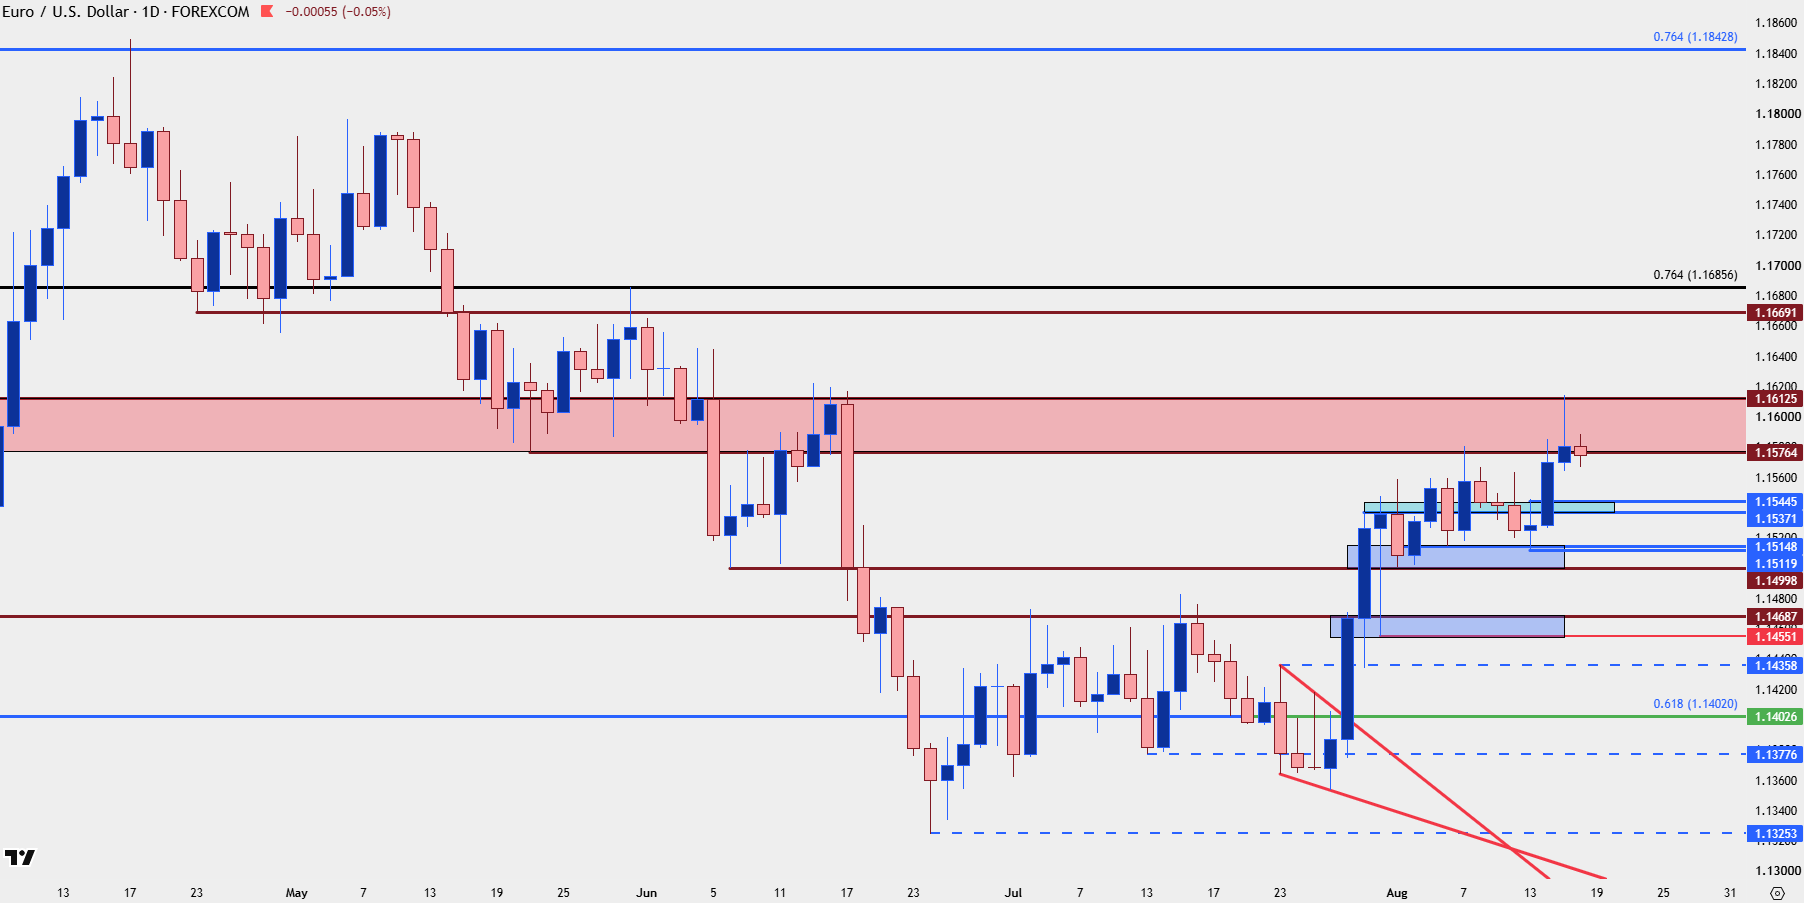
Chart prepared by James Stanley; data derived from Tradingview
Gold
With inflation remaining high in the US and Treasuries presenting the very real prospect of principal loss on larger supply, gold remains an attractive alternative and this is at least part of the reason why it broke out so aggressively a couple of weeks ago. And while gold prices are continuing to test a major spot of longer-term resistance, there’s been pullbacks to work with, such as the current one taking place at the 4358 spot highlighted in the webinar.
Gold Four-Hour Price Chart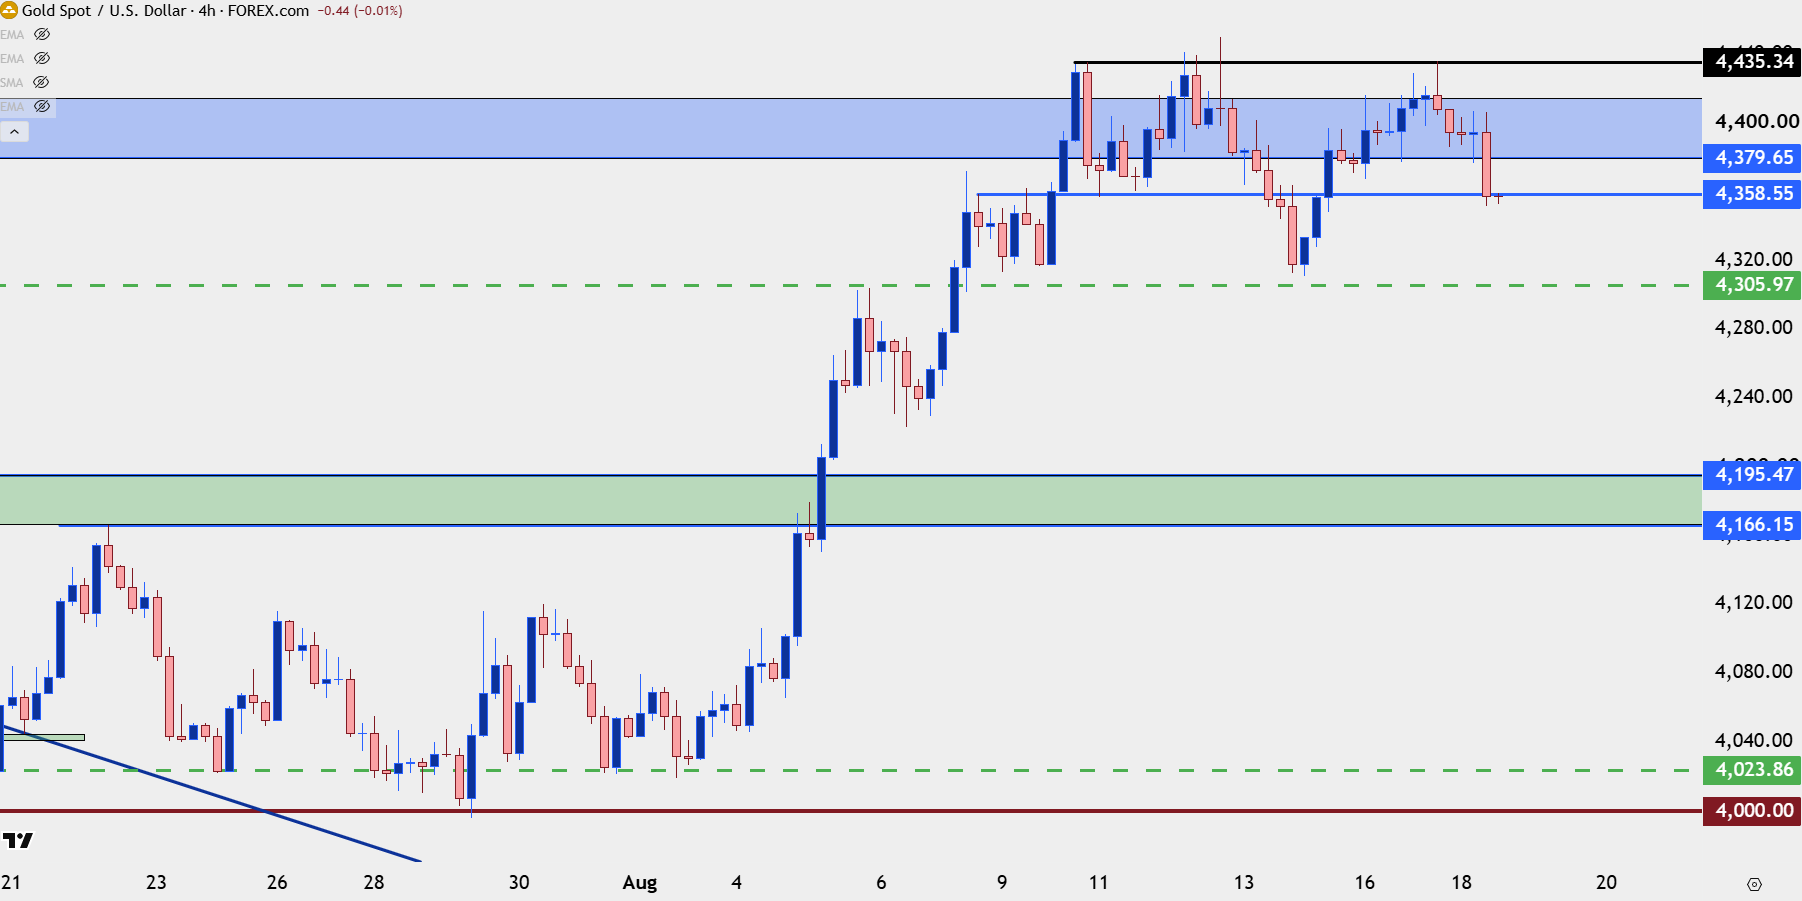
Chart prepared by James Stanley; data derived from Tradingview
--- written by James Stanley, Senior Market Analyst, Global Macro







Web Trader platform
Our sophisticated web-based platform is packed with features.
Open an account today
Experience award-winning platforms with fast and secure execution.
Economic calendar
Related articles

Euro Short-term Outlook: EUR/USD Pullback Nears Pivotal Uptrend Support 8 28 2026
Warsh's comments accelerated the EUR/USD selloff, raising the stakes as buyers look to stabilize the broader recovery.


Gold and S&P 500 analysis: What now after Warsh’s hawkish speech?
The dollar surged across the board after the Fed Chair Kevin Warsh surprised with a hawkish-leaning speech at the Jackson Hole summit. All the bearish dollar bets that had been accumulated since last Friday on the back of data weakness and bond market troubles had to be squared and that triggered a short squeeze rally for the dollar. Gold and silver dropped, as a result, as too did bitcoin, while US indices were giving back earlier gains.


Nasdaq 100 Forecast: NDX slips ahead of Fed Chair Warsh’s speech
U.S. stocks are edging lower on Friday, giving back some of yesterday's gains after Nvidia's strong outlook revived the tech trade. The focus has now shifted firmly to Fed Chair Kevin Warsh's Jackson Hole speech, with investors looking for more clarity on the outlook for interest rates.
