

US Dollar Price Action Setups: EUR/USD, USD/JPY, GBP/USD, USD/CAD
The Dollar is working on its second consecutive red week and while sellers didn’t exactly pounce on fresh lows, there’s an opening door for bears to make a move.
Written by
James Stanley
Sr. Strategist
US Dollar Talking Points:
- The USD works on a second consecutive red week following the bearish engulf from the week before.
- EUR/USD is still having trouble turning, but the rally in GBP/USD retains more attraction for USD-weakness scenarios. Below, I highlight how there can be expectation for a degree of correlation between the Euro and French bonds. And, in-turn, this could create a backdrop for inverse correlation between French bonds and the US Dollar.
- Perhaps the biggest takeaway from the past week is the pullback in USD/JPY, and even though the pair is holding on to a key support level, concern is building around the possibility of carry unwind as US equities face more pressure.
- USD/CAD put in a 1.4000 test and this sets up for possible USD-strength scenarios next week.
The US Dollar finished a bearish engulf in the prior week and that cast a shadow for the week after, as DXY printed a second consecutive red bar although sellers weren’t able to break much fresh ground below the 101.80 Fibonacci level.
For next week, it’s the FOMC rate decision that dominates attention and while expectations are high for the Fed to hold rates, there’s still a 78% probability that the bank hikes at least once more by the end of the year, meaning the press conference will be widely watched for clues from Kevin Warsh around just how hawkish he might be. And with equities on their back foot just a week ahead of mid-term elections, there may be more motive for Warsh to take an approach similar to July, when he still used hawkish language but markets walked away with the idea that this was a Fed Chair that did not want to hike. And then weeks later the S&P 500 was at a new fresh all-time-high.
For the Greenback, the issue will naturally draw back to counterparts, as I’ll outline below.
US Dollar Weekly Chart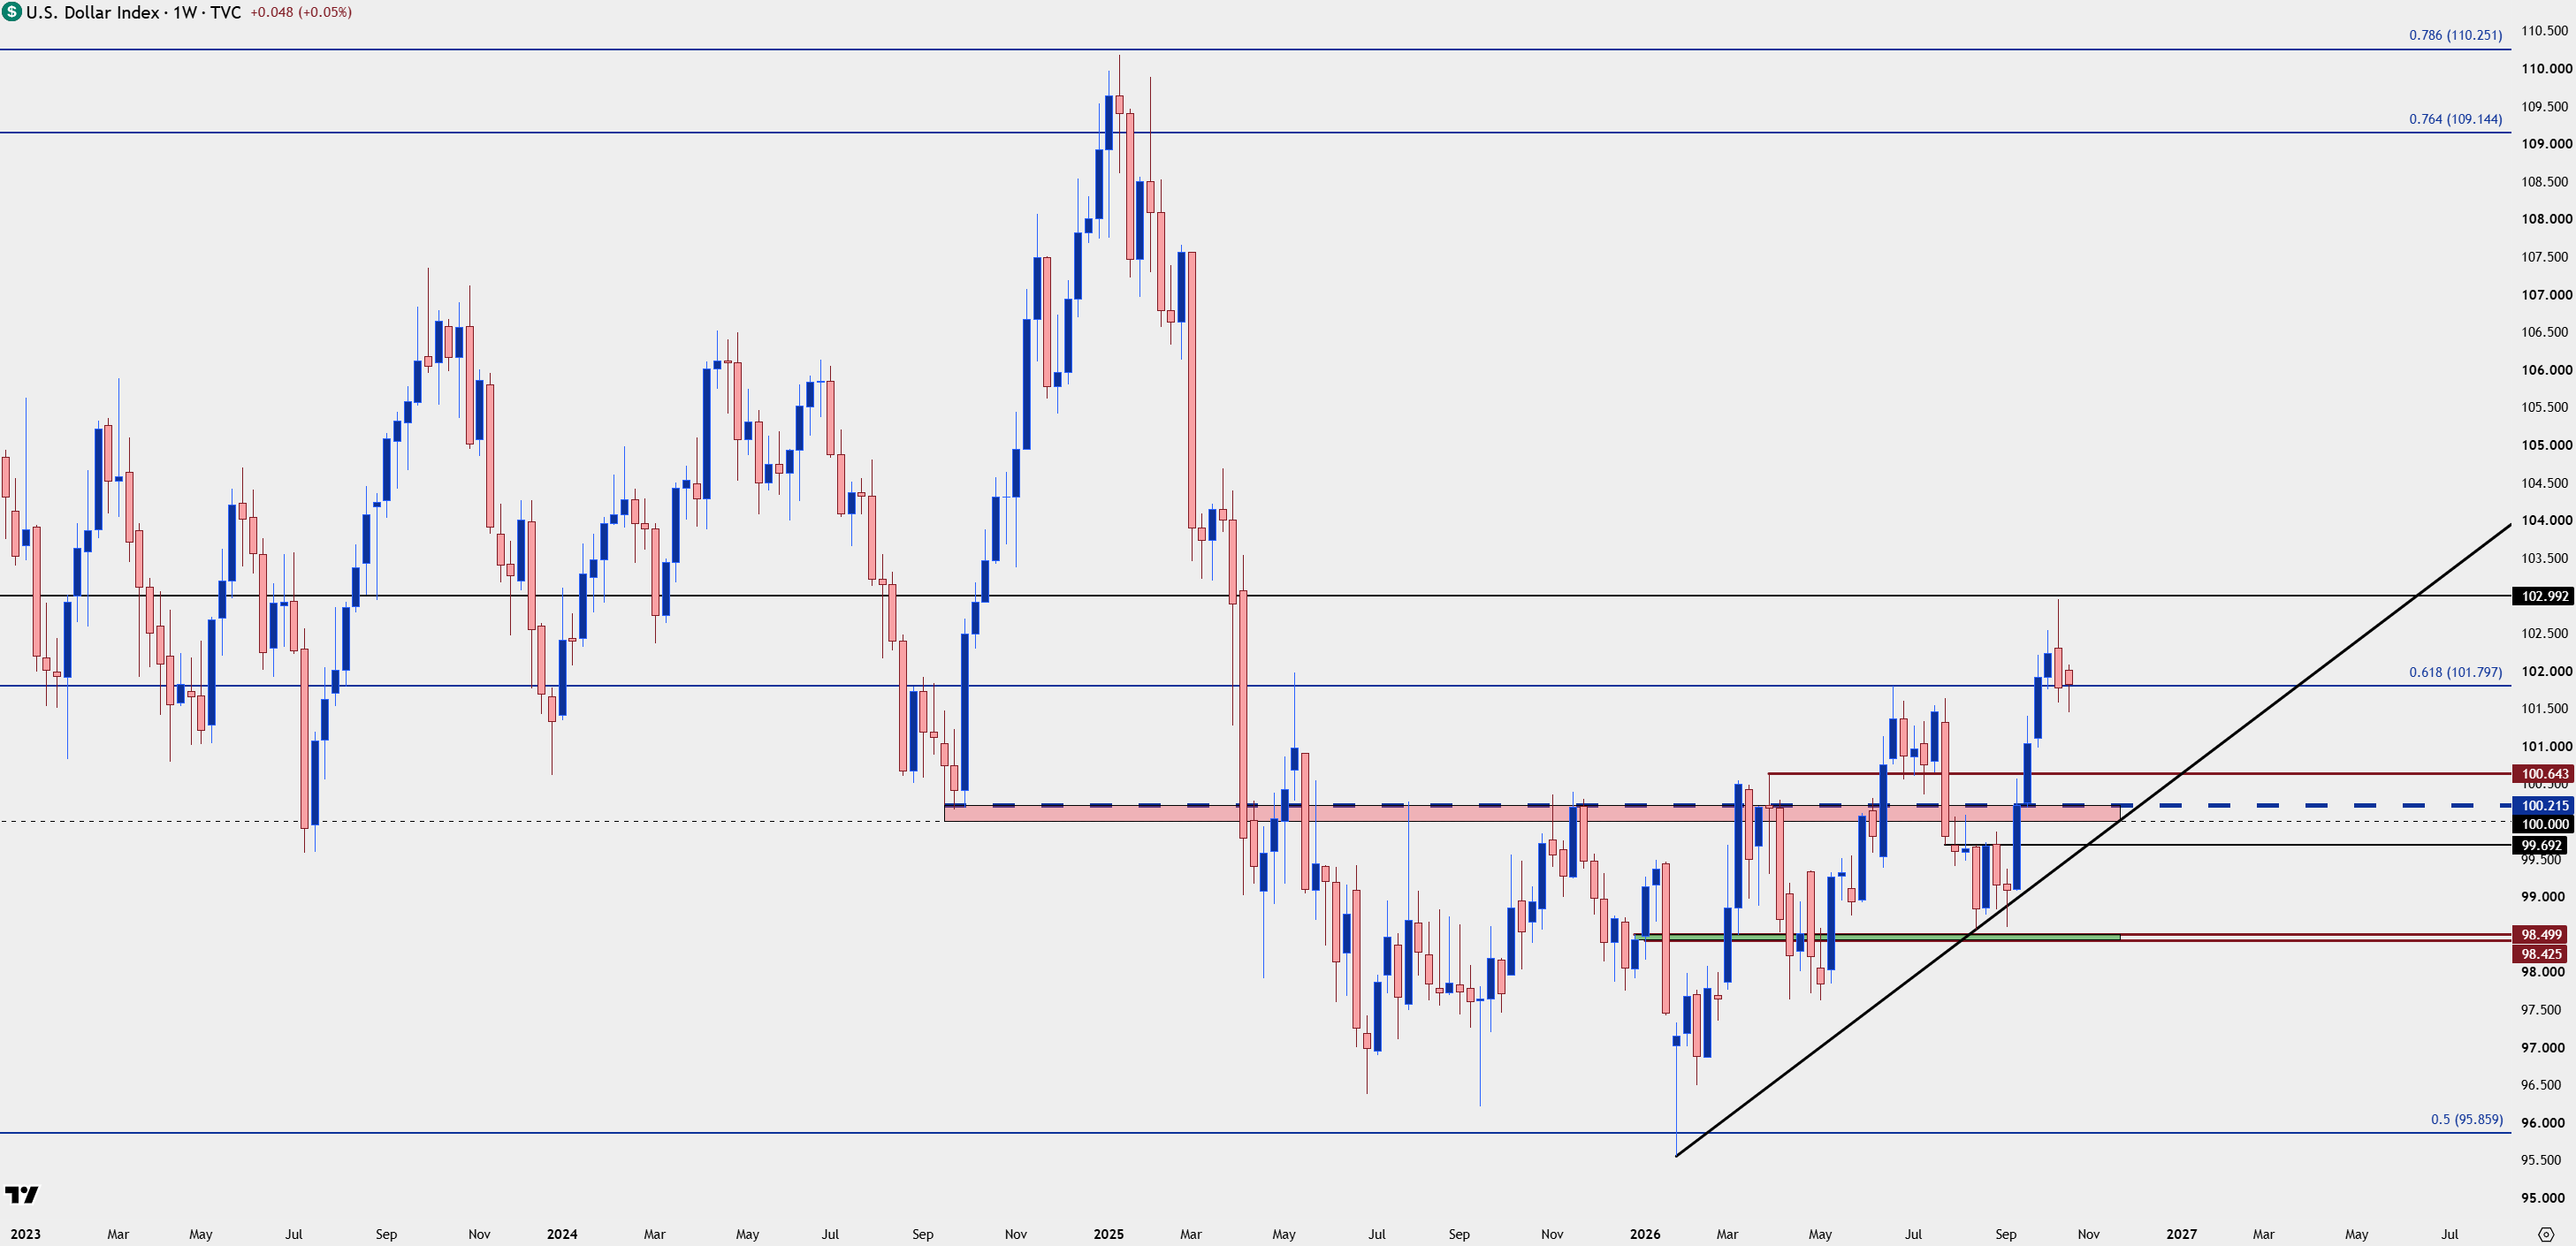
Chart prepared by James Stanley; data derived from Tradingview
EUR/USD: It’s a Euro Problem
French bond yields jumping have created a sense of unease around the European economy and this is something I’ve addressed in detail in the past two webinars. It also brings to question long-term viability of the single currency, as there remains a structure deficiency to the union as a shared currency without shared budgets makes for a great amount of friction.
This isn’t the first time that fear has reared its ugly head, and it was the ‘whatever it takes’ promise of Mario Draghi back in 2012 that helped to allay those fears. But in our current state, it seems there’s less motivation for Lagarde to address that problem and, in turn, the Euro has suffered with a consistent sell-off that started just before the September open.
This led to a deep oversold situation on the daily chart, and while the past week has seen the sell-off stall buyers still haven’t been able to take the important next step of punching up to fresh highs and I think it’s largely due to that lacking confidence in long-term health of the European Union. I’m sure surging French bond yields haven’t helped matters so, likely, we’re looking at a scenario where the Euro is going to show a degree of correlation with French bonds in the near-term.
If we can get some element of recovery, that 1.1275-1.1285 spot in EUR/USD represents a massive point of interest for bulls on the daily chart.
EUR/USD Daily Price Chart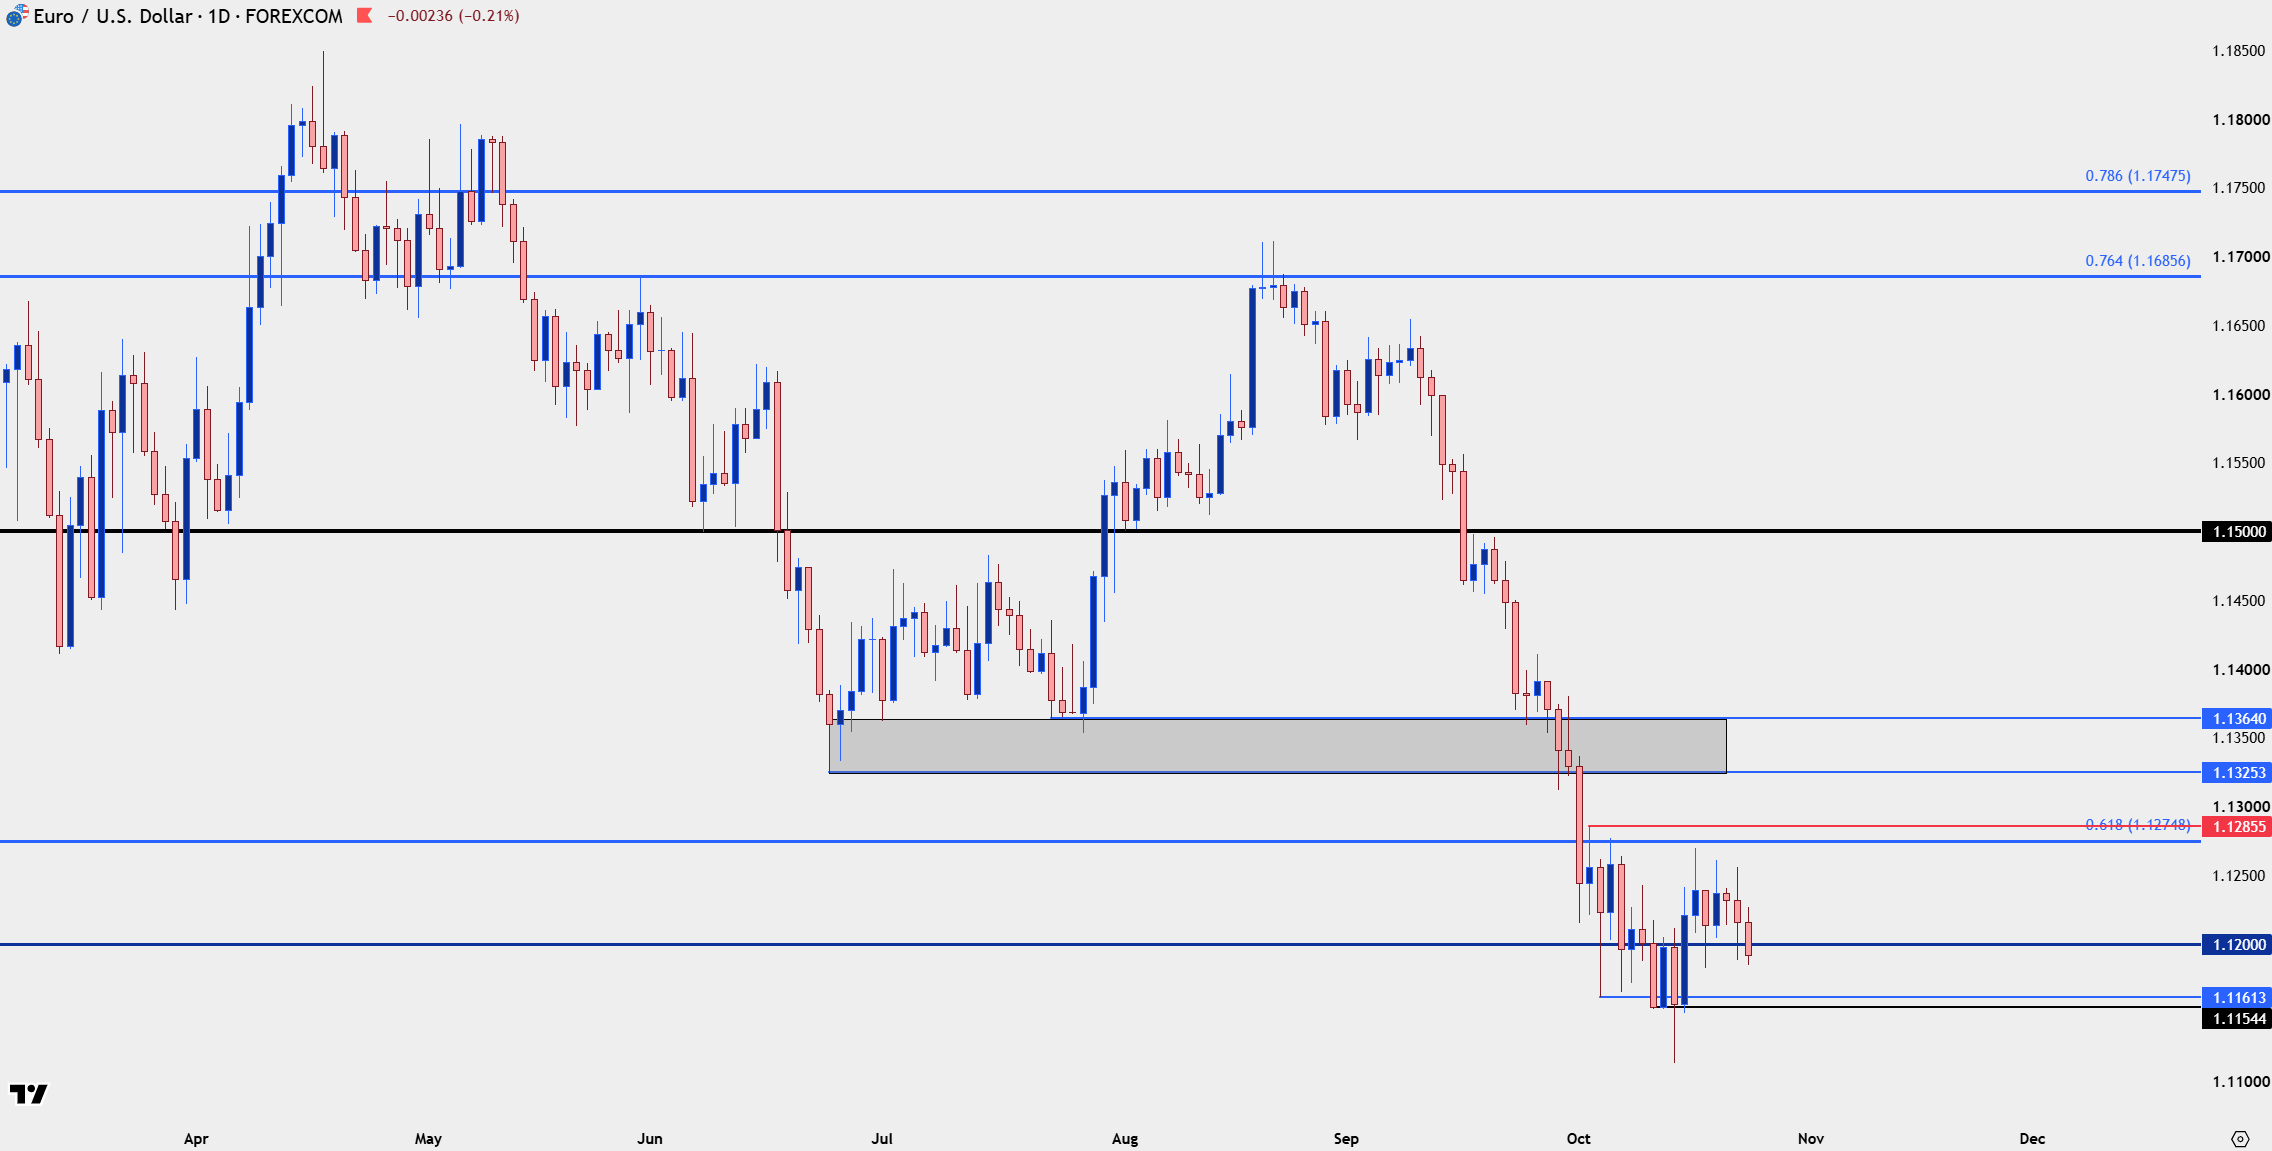
Chart prepared by James Stanley; data derived from Tradingview
GBP/USD
For USD-weakness, I still prefer GBP/USD and the pair continued the rally from key support in the prior week to re-test the 1.3400 handle. For next week, there’s higher-low support potential at both 1.3337 and then the 1.3275-1.3300 zone.
GBP/USD Daily Chart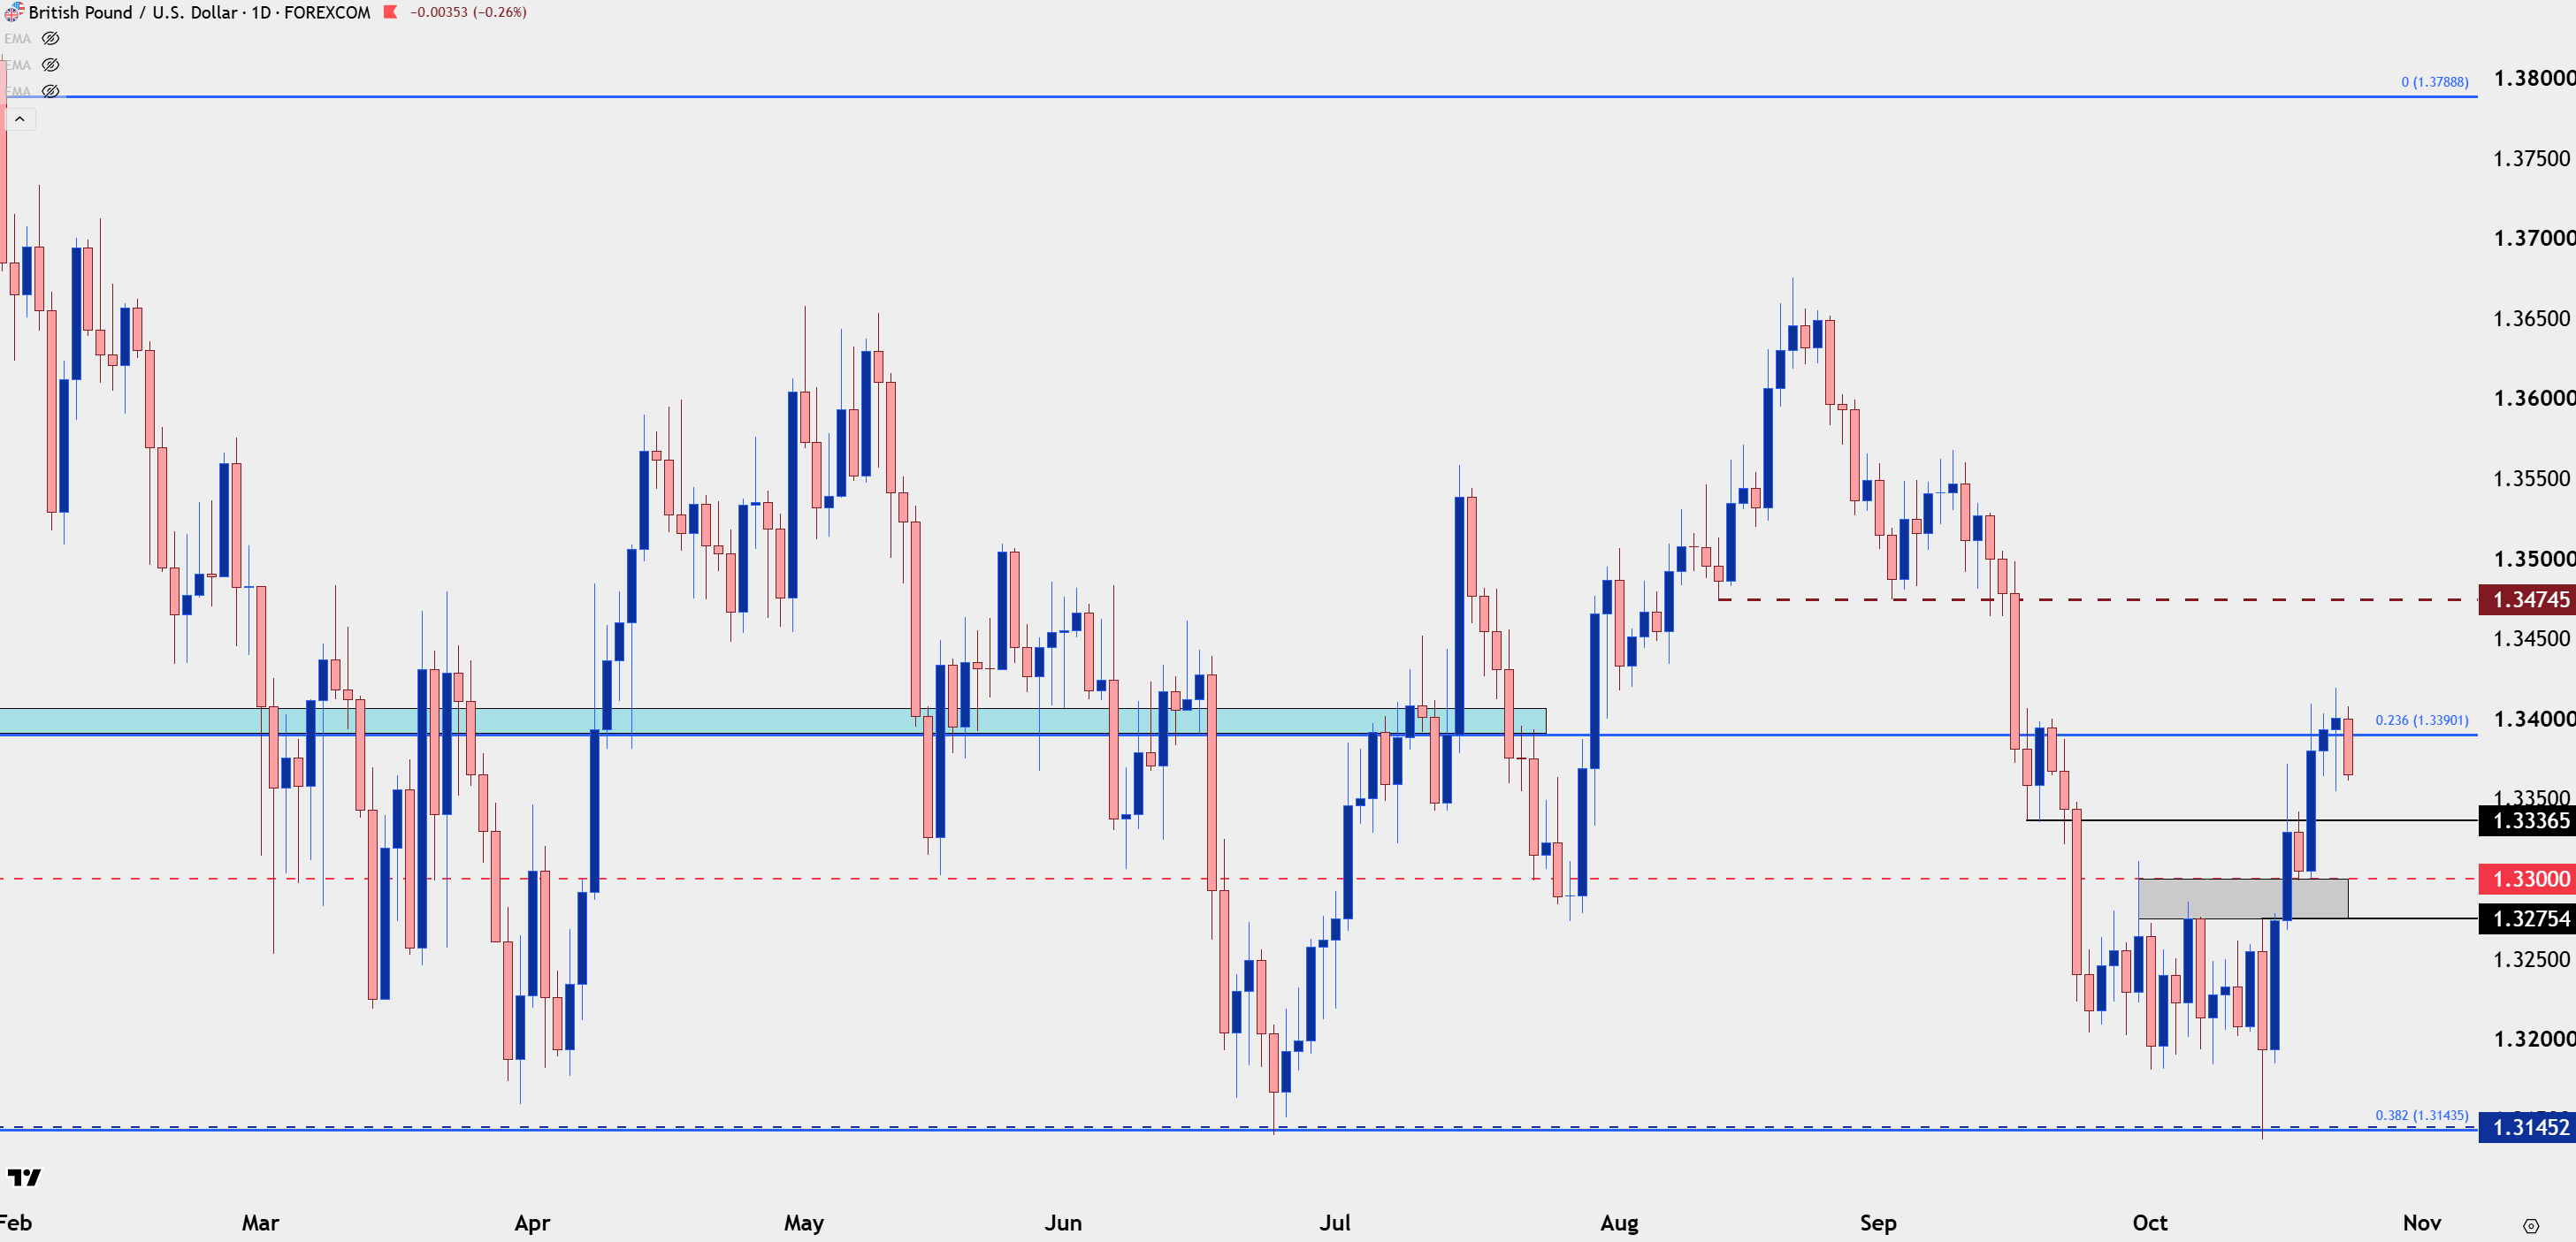
Chart prepared by James Stanley; data derived from Tradingview
USD/JPY
So, this isn’t a major cause of concern yet – but, it could fast become one. The USD/JPY carry trade has been a big source of global leverage as institutions have, for years, been able to borrow funds cheaply in Japan and then invest elsewhere, with the aim of taking advantage of the rate disparity between the economies. The problem, is that when getting a loan from a Japanese bank, those institutions are in essence long Yen, because the loan is in JPY. So, one natural way of addressing that risk is by hedging Yen in the market place by selling JPY and buying another currency, such as the USD.
This is one of the reasons that USD/JPY remains more than 50% above early-2021 values.
The problem is that this creates a very crowded trade, and when there’s a hint or whiff of change, the exit door is only so wide and an exodus can create a sizable price move. But also of issue and this was something we saw back in 2024, is that if the expectation is for rates to narrow between the economies, the markets that have been pushed by that leverage can also see capital flight.
This is why for a three-week period stocks sold off with aggression in July of 2024 and into August, even though the market was pricing in Fed cuts to start a month later. This produced the third-highest ever reading in the VIX index largely on the basis of that volatility, and I covered this in the StoneX video that was released on Friday.
The AI Bubble Link with USD/JPY
At this point, USD/JPY is still holding support structure so, again, this isn’t necessarily a doom-and-gloom thing yet. But what was noticeable last week is the way that prices fell on Thursday, and the fact that price on Friday technically set a fresh monthly low. It happened alongside an equity sell-off, giving the appearance that some of that leverage was starting to come out of these rich valuations in AI and tech stocks. This could potentially be the early stages of change, and it’s worth watching next week as an episode of carry unwind can have massive consequence, and not just in the FX market.
USD/JPY Daily Chart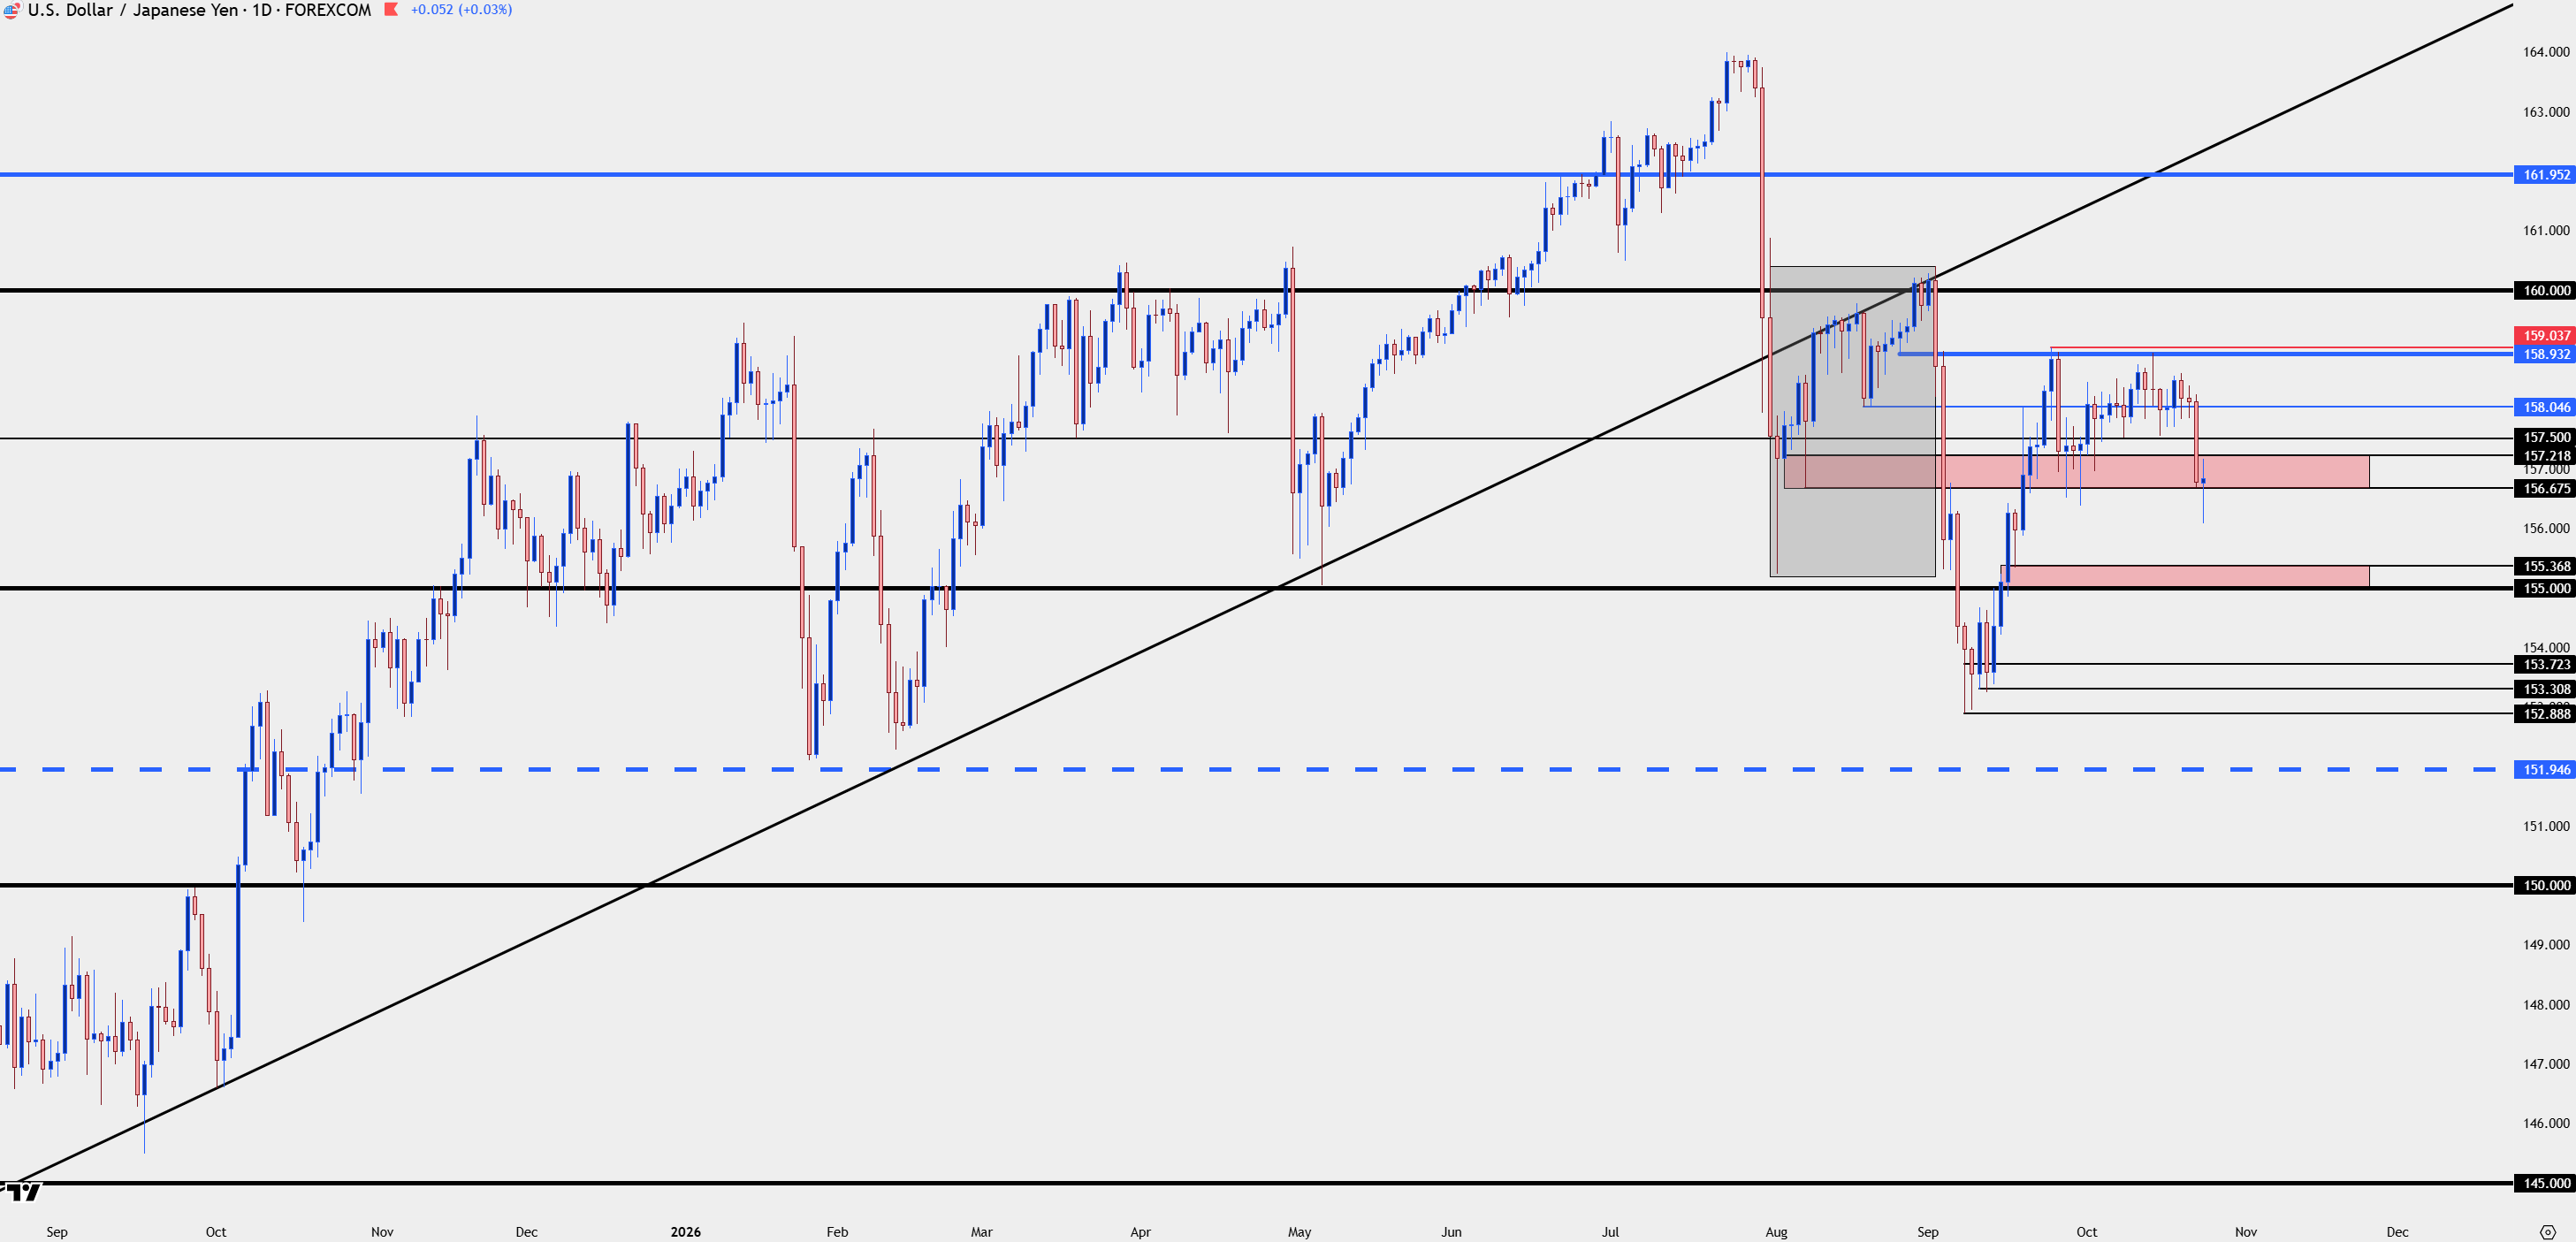
Chart prepared by James Stanley; data derived from Tradingview
USD/CAD
To be sure, there is still an argument on the long side of USD/JPY as price is clinging to an important support level of 156.68. But for USD-stength scenarios next week, USD/CAD may hold more attraction given where price pulled up for support most recently.
The 1.4000 level has come back into play and this has been a feast to famine backdrop, where a strong and aggressive bullish rally has pulled back quickly over the past couple of weeks.
USD/CAD Daily Chart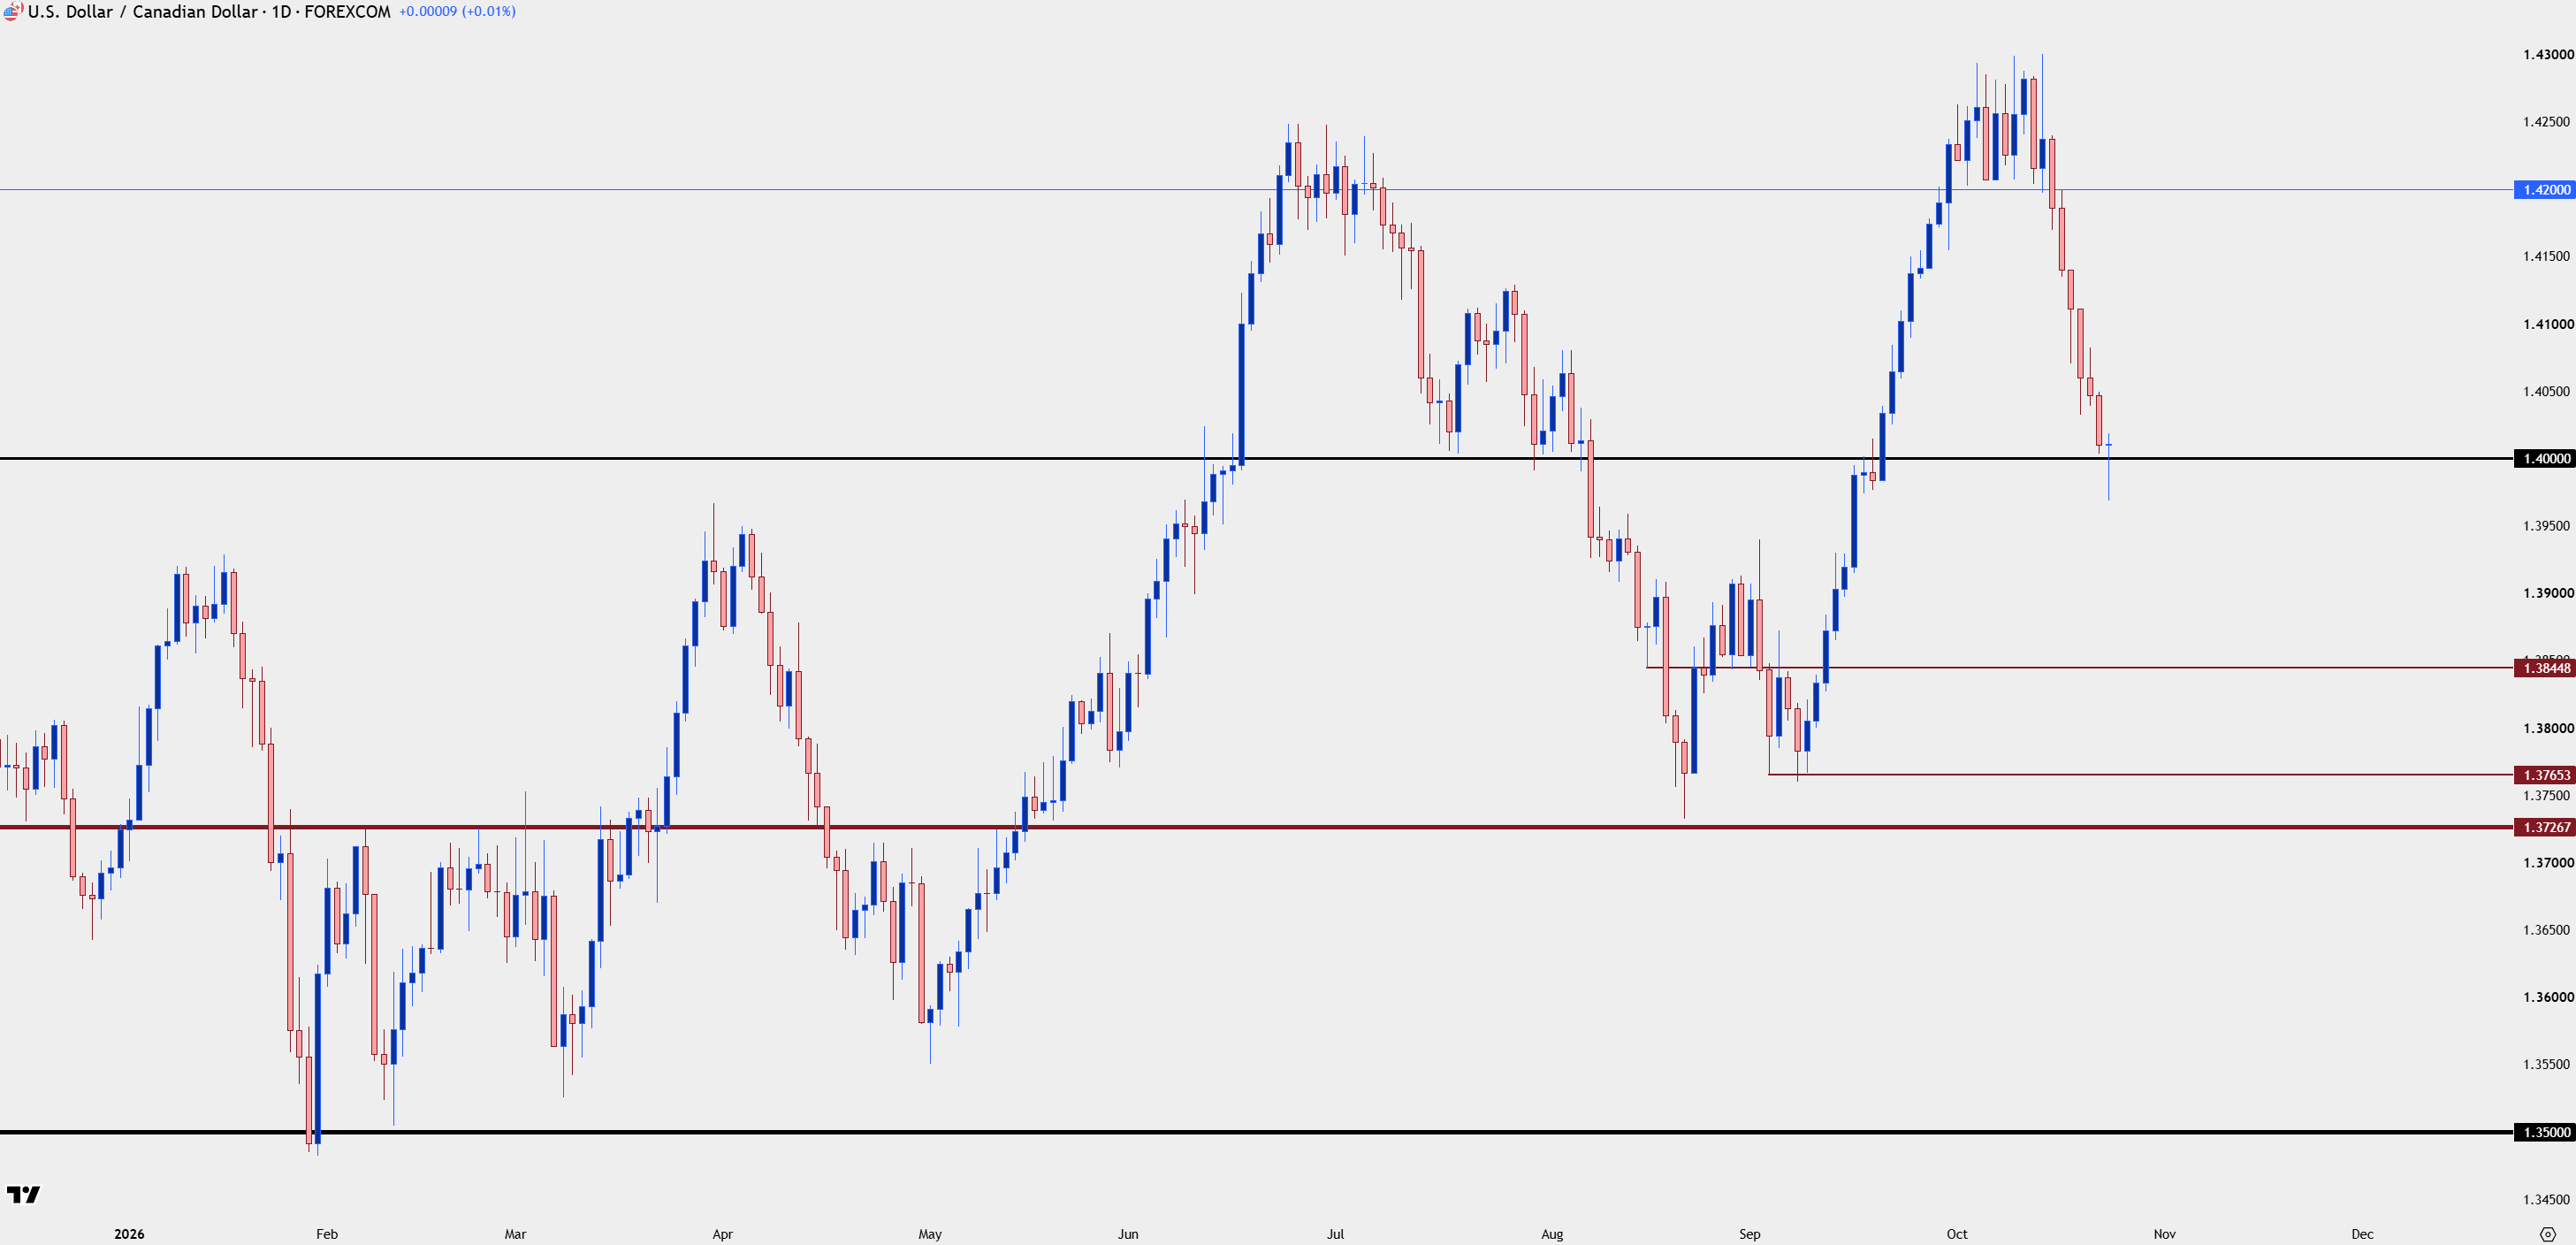
Chart prepared by James Stanley; data derived from Tradingview
--- written by James Stanley, Senior Market Analyst, Global Macro
Latest market news











Web Trader platform
Our sophisticated web-based platform is packed with features.
Open an account today
Experience award-winning platforms with fast and secure execution.
Economic calendar
Related articles

Nasdaq 100 Forecast: NDX slips ahead of Fed Chair Warsh’s speech
U.S. stocks are edging lower on Friday, giving back some of yesterday's gains after Nvidia's strong outlook revived the tech trade. The focus has now shifted firmly to Fed Chair Kevin Warsh's Jackson Hole speech, with investors looking for more clarity on the outlook for interest rates.


EUR/USD forecast: All eyes on Warsh at Jackson Hole - Forex Friday
For much of this week, the EUR/USD has been edging lower with the US dollar regaining some ground after last week’s sell-off that was triggered, in part, by the bond market worries. Investors have been unwilling to bet further against the US dollar so far this week ahead of Kevin Warsh’s keynote speech at the Jackson Hole summit, due later today.


S&P 500 Forecast: SPX after Nvidia revives confidence in the AI trade
U.S. stocks are heading higher on Thursday, with technology leading the move after Nvidia's stronger-than-expected outlook revived confidence in the AI trade.