


USD/CAD Eyes Pullback as CAD/JPY Decouples from Crude Oil, AUD/CAD Stabilises
USD/CAD shows signs of a pullback, AUD/CAD holds above key support, and CAD/JPY rallies on yen weakness despite subdued crude oil prices.
Written by
Matt Simpson
Market Analyst
Canadian dollar sentiment remains weak, with futures traders extending net-short exposure to a 29-week high. Yet while positioning continues to favour CAD weakness, the charts suggest momentum may be shifting. USD/CAD is showing early signs of a pullback, AUD/CAD is defending key support within its uptrend, and CAD/JPY's latest rally appears driven more by yen weakness than Canadian dollar strength.
View related analysis:
- AUD/USD Outlook 2026: Key Drivers for the Australian Dollar in Q3
- Canadian Dollar Outlook: AUD/CAD Eyes Parity as USD/CAD Stretches Higher
- Australian Dollar Outlook: AUD/USD Shows Early Signs of a Swing Low
- Gold Price Rebound? Futures Positioning Signals Support Above 4,000
- FX Futures Positioning: GBP Shorts Hit Records as USD Rally Slows | COT Report
USD/CAD Pullback Signals Emerge While AUD/CAD Holds Support and CAD/JPY Defies Weak Crude Oil
Canadian Dolar (CAD) Futures Positioning | COT Report
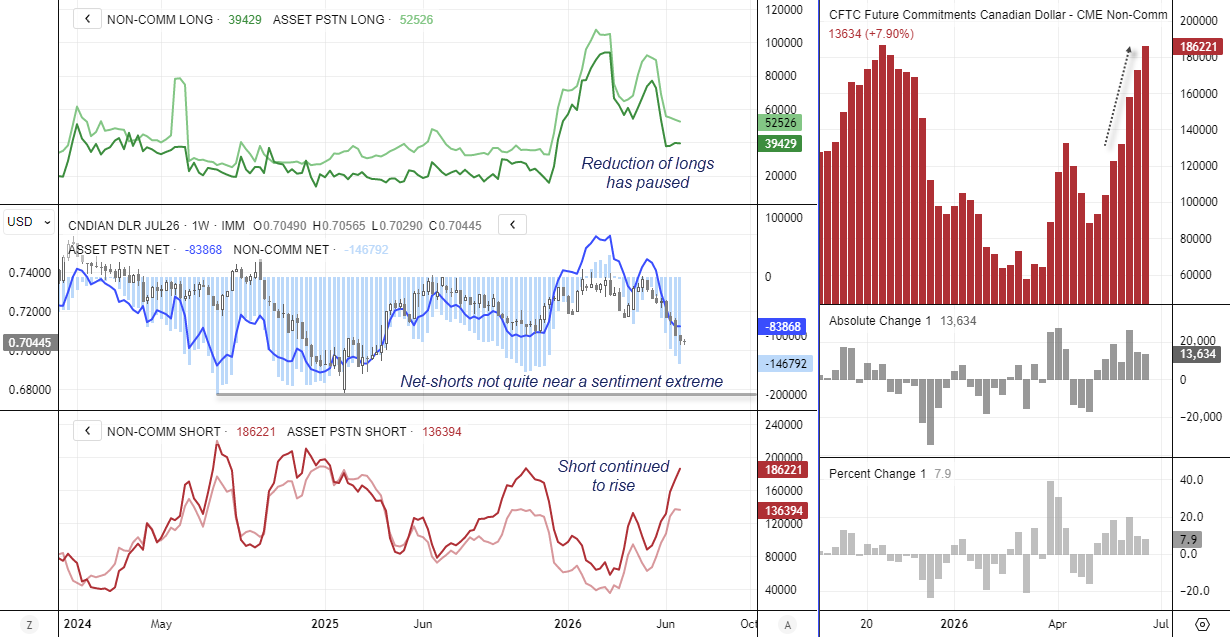
Bears have continued to pile into the Canadian dollar futures market, with large speculators and asset managers pushing their net-short exposure to a 29-week high. This has primarily been driven by an influx of fresh gross shorts over recent weeks, while longs were trimmed earlier and have since remained relatively flat.
With little appetite to buy the Canadian dollar as short exposure continues to rise, net-short positioning could extend further as sentiment is not yet at a historical extreme. Large speculators currently hold a net-short position of -147k contracts, compared with the peak bearish reading of around -191k contracts in 2024.
That said, price action on both the daily and weekly timeframes suggests the trend may be pausing. Whether this develops into a modest pullback or a larger reversal will likely depend on this week's US non-farm payrolls report. For now, however, USD/CAD appears to be stalling beneath resistance while bearish Canadian dollar positioning continues to build.
Source: ICE, TradingView
For traders wanting a deeper understanding of futures positioning, I’ve also published a guide on how to read and interpret weekly COT data in forex markets.
USD/CAD Technical Analysis: US Dollar vs Canadian Dollar
Bullish Momentum Begins to Fade
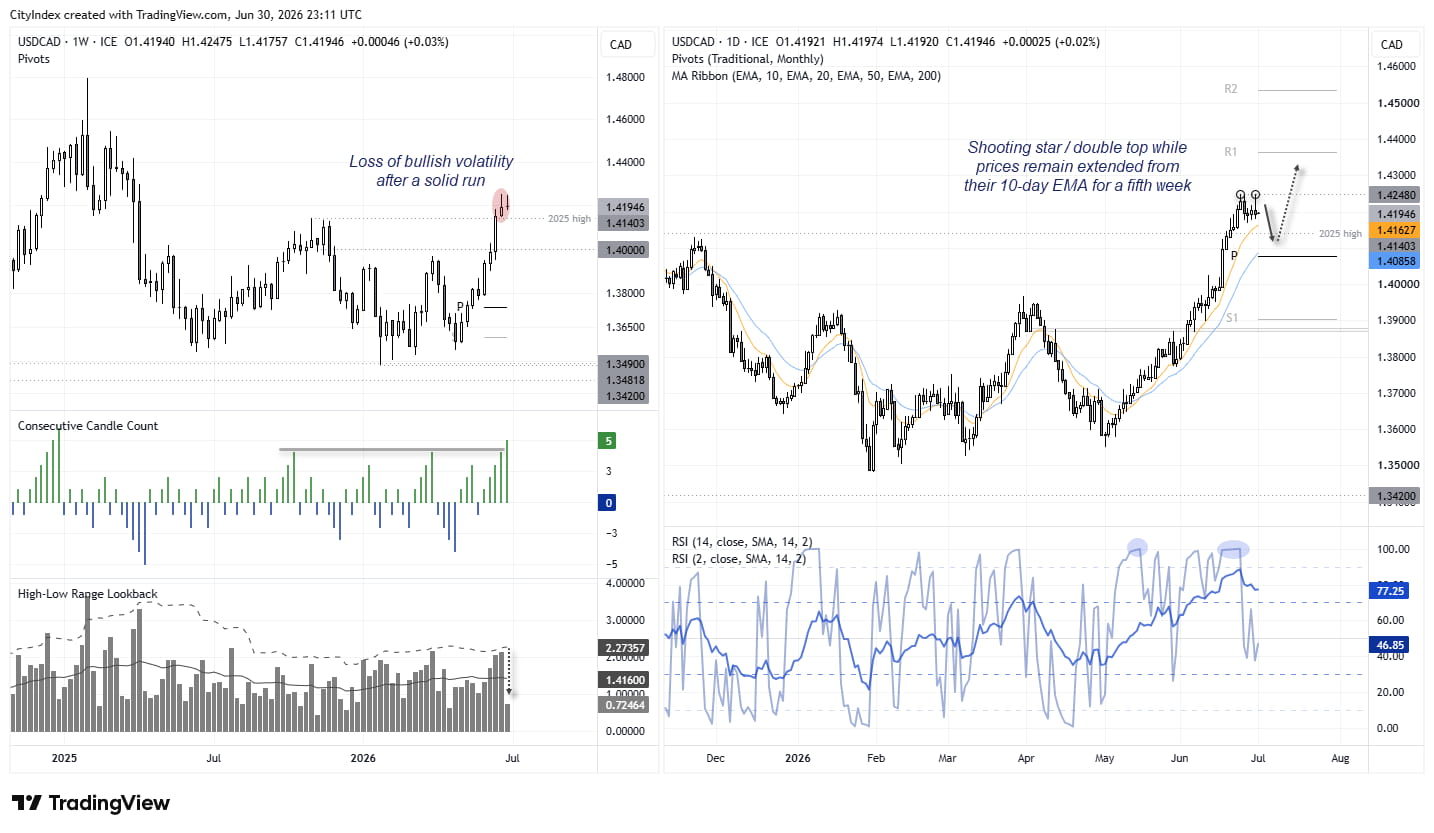
The loonie rose for a fourth consecutive week by Friday's close. While that doesn't guarantee it won't extend the streak to a fifth week, it hasn't managed five consecutive weekly gains since December 2024. With USD/CAD having rallied more than 5% from its June low in what has largely been a straight line, it could be argued the move is becoming stretched. Moreover, last week's range was the smallest in 10 weeks, with just over half of it consisting of an upper wick, leaving a small shooting star candle on the weekly chart.

USD/CAD Daily Chart Hints at a Near-Term Pullback
The daily USD/CAD chart continues to show a strong uptrend with only minor pullbacks, although prices have traded above the 10-day EMA for the past five weeks. The daily RSI was pinned near 100 on several occasions, underscoring the strength of the bullish momentum. However, the 14-day RSI has now begun to turn lower from overbought territory.
Note Tuesday's shooting star candle, whose high stalled at last week's high to form a potential double top. Prices remain close enough to the cycle highs within a strong uptrend to warrant caution against another push higher. However, I suspect these are the early signs of at least a minor pullback. Yesterday's bullish engulfing candles on AUD/USD and NZD/USD, alongside continued weakness in the US Dollar Index, also strengthen the case for a near-term pullback in USD/CAD—even if it only extends to the 10-day EMA or the 2025 high monthly pivot point.
Source: ICE, TradingView
AUD/CAD Technical Analysis: Australian Dollar vs Canadian Dollar
Weekly uptrend remains intact despite pullback risk
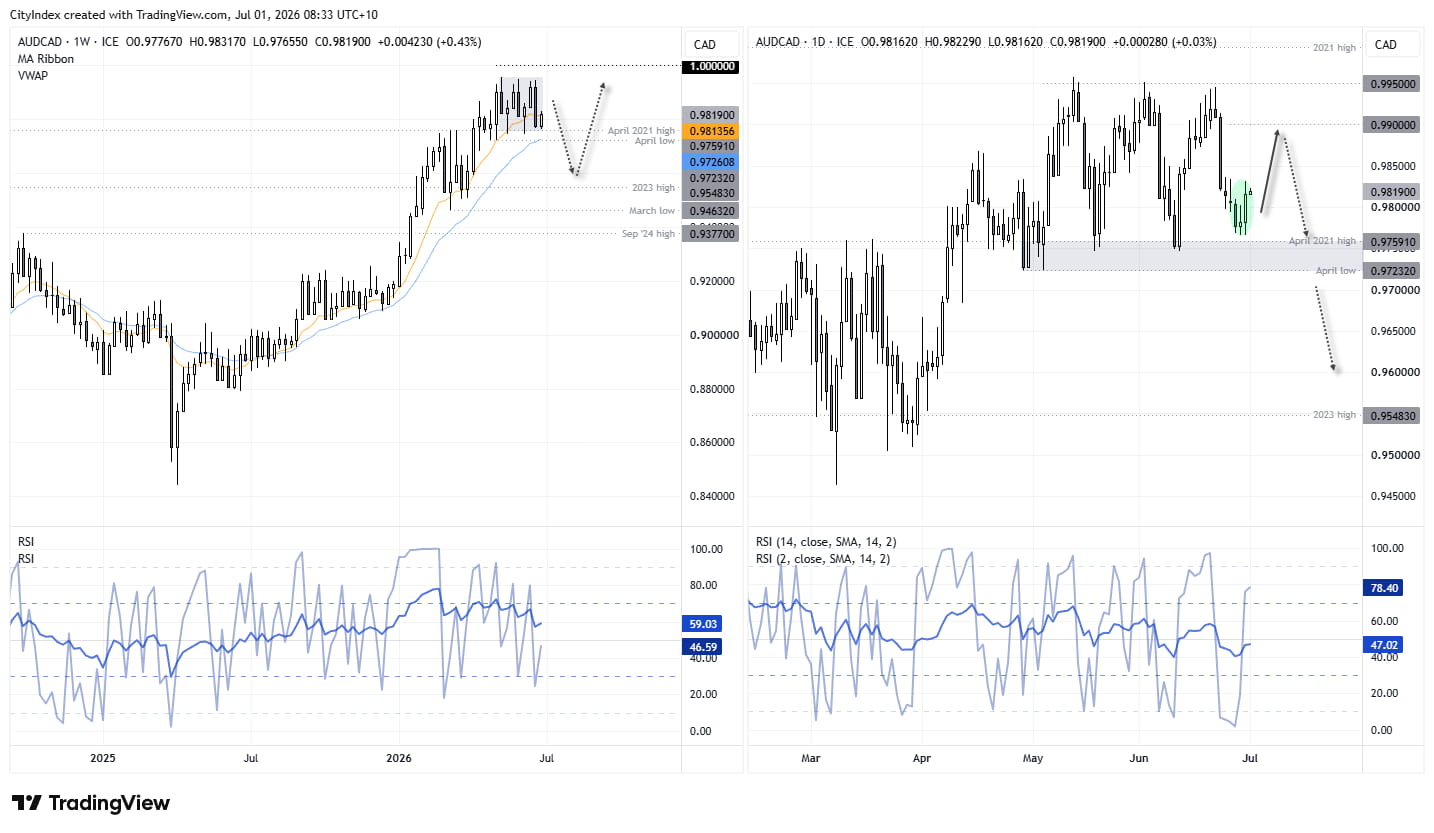
The weekly shows a solid uptrend on AUD/CAD, and one that could go on to test parity. Yet the outlook over the near term is still toying with the idea of a deeper pullback, given last week’s bearish engulfing candle. For me, the bigger question is whether bulls can keep prices above April low and within its sideways range before continuing higher. As a break beneath is could signal a larger counter trend move is underway, brining thew 96 handle, 2023 high (0.9848) and March low (0.9462) into focus.
For now, I suspect it will hold. Besides, bulls left their mark on Tuesday with a bullish engulfing candle above the April 2021 high. It also formed part of a 3-day reversal pattern (Morning Star Formation).
April low remains the key level for bulls
Fow now, bulls may be seeking dips within Tuesday’s range in anticipation of a leg higher within its sideways range, with 99 making a potential upside target. A break above the swing highs ~0.9950 brings the 2021 high and parity into focus – which could be an obvious level for a shakeout and increased volatility.
The April low seems significant, so bulls may also seek evidence of a swing low around it for a potential bounce. While a break beneath it invalidates my near-term bullish bias and suggests a deeper countertrend move is underway.
Source: ICE, TradingView

CAD/JPY Technical Analysis: Canadian Dollar vs Japanese Yen
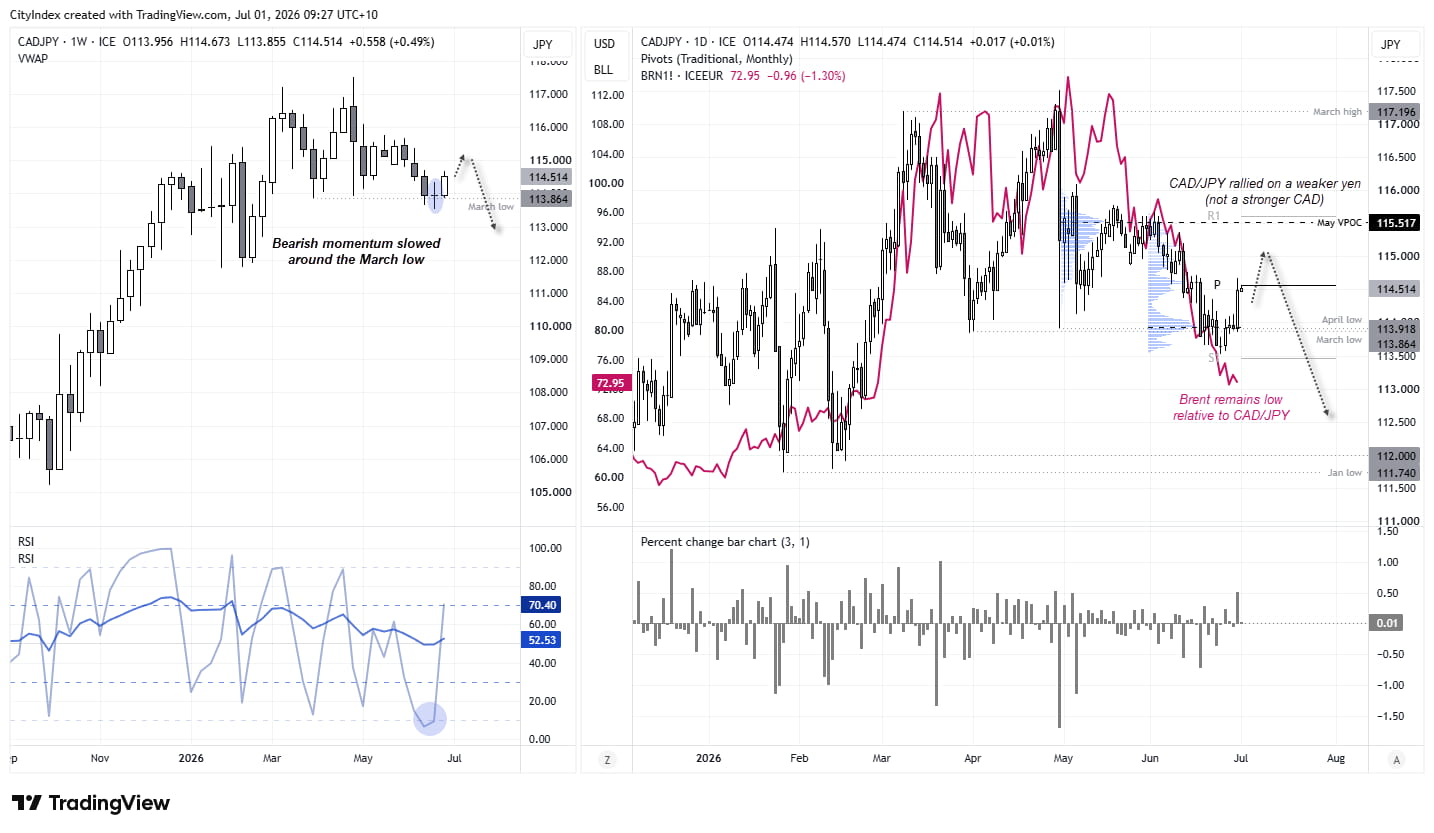
A broadly weaker Japanese yen allowed CAD/JPY to post its strongest daily gain in two months on Tuesday. Yet this was clearly a case of yen weakness rather than Canadian dollar strength. Still, last week's doji warned that bearish momentum was waning, while the weekly RSI (2) was oversold and the RSI (14) held above 50. However, with crude oil prices remaining subdued and therefore detached from the recent upswing in CAD/JPY, I suspect the pair's upside could be limited, with bears waiting to fade rallies into resistance.
Furthermore, should markets be treated to weak US data, it would significantly increase the odds of an MOF intervention to support the yen. Given the Canadian dollar's broader weakness elsewhere, CAD/JPY would be my preferred short in a stronger yen environment while crude oil prices remain subdued.
Source: ICE, TradingView
View the full economic calendar
-- Written by Matt Simpson
Follow Matt on Twitter @cLeverEdge
How to trade with City Index
You can trade with City Index by following these four easy steps:
- Open an account, or log in if you’re already a customer
• Open an account in the UK
• Open an account in Australia
• Open an account in Singapore
- Search for the market you want to trade in our award-winning platform
- Choose your position and size, and your stop and limit levels
- Place the trade
Related tags:







Web Trader platform
Our sophisticated web-based platform is packed with features.
Open an account today
Experience award-winning platforms with fast and secure execution.
Economic calendar
Related articles

Euro Short-term Outlook: EUR/USD Pullback Nears Pivotal Uptrend Support 8 28 2026
Warsh's comments accelerated the EUR/USD selloff, raising the stakes as buyers look to stabilize the broader recovery.


Gold and S&P 500 analysis: What now after Warsh’s hawkish speech?
The dollar surged across the board after the Fed Chair Kevin Warsh surprised with a hawkish-leaning speech at the Jackson Hole summit. All the bearish dollar bets that had been accumulated since last Friday on the back of data weakness and bond market troubles had to be squared and that triggered a short squeeze rally for the dollar. Gold and silver dropped, as a result, as too did bitcoin, while US indices were giving back earlier gains.


EUR/USD forecast: All eyes on Warsh at Jackson Hole - Forex Friday
For much of this week, the EUR/USD has been edging lower with the US dollar regaining some ground after last week’s sell-off that was triggered, in part, by the bond market worries. Investors have been unwilling to bet further against the US dollar so far this week ahead of Kevin Warsh’s keynote speech at the Jackson Hole summit, due later today.