


British Pound Outlook: GBP/USD, GBP/AUD Face UK Jobs Test
Sterling faces a UK jobs test as GBP/USD and GBP/AUD show signs of vulnerability despite more supportive BoE rate expectations.
Written by
Matt Simpson
Market Analyst
The interest rate backdrop has swung in sterling’s favour this year, with markets moving from pricing further BoE easing towards the prospect of renewed tightening. Yet GBP/USD and GBP/AUD are showing signs of vulnerability ahead of UK employment data, which could test whether that shift in rate expectations is justified.
View related analysis:
GBP/USD, GBP/AUD Face UK Jobs Test as BoE Rate Bets Shift
BoE Rate Expectations Swing in Sterling’s Favour
The interest rate outlook has swung in sterling’s favour this year, with money markets moving from pricing further Bank of England easing to the prospect of renewed tightening.
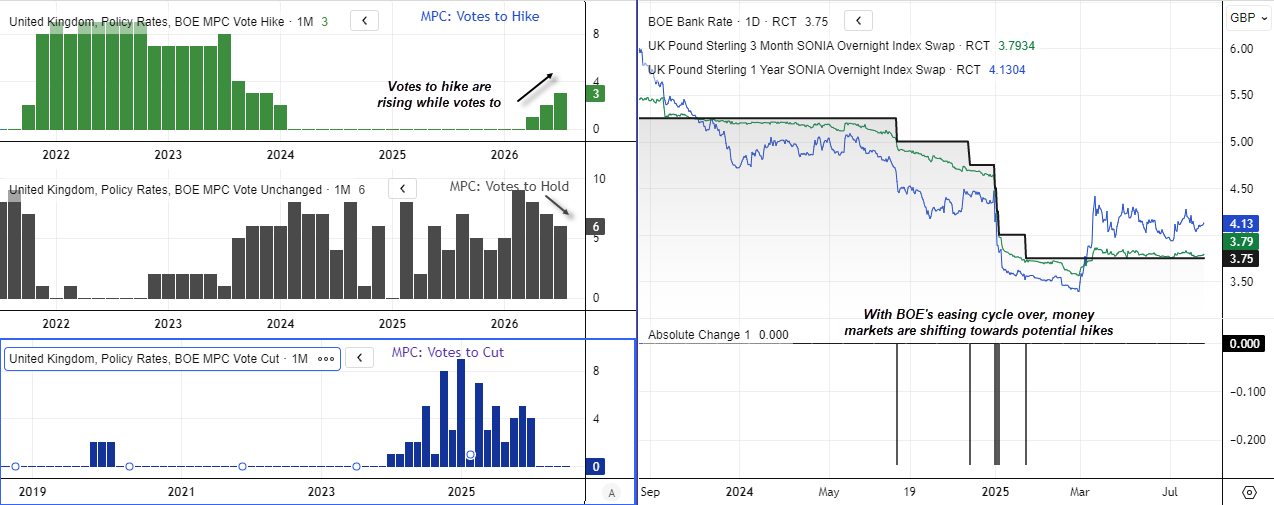
The Bank of England’s cash rate sits at 3.75%, with 3-month SONIA at 3.79% signalling little urgency for an immediate policy change. However, 1-year SONIA is notably higher at 4.13%, pointing to expectations for higher rates over the coming year.
That marks a sharp shift from earlier this year, when markets were positioned for further easing. The shift is also evident within the MPC, with three members voting to raise rates at the latest meeting, up from none earlier this year. Six voted to hold and none backed a cut.
Source: BOE, LSEG
UK Jobs Data Could Test Sterling’s Rate Support
With 1-year SONIA now holding around 4.0–4.2%, the interest rate backdrop has become more supportive for sterling, even if policymakers are expected to remain patient in the near term.
Yet this also leaves the pound vulnerable if incoming data fail to justify those expectations. The UK labour market remains a potential weak spot, with softer employment or wage figures potentially challenging the shift in SONIA pricing and weighing on sterling.

GBP/USD Technical Analysis: British Pound vs US Dollar
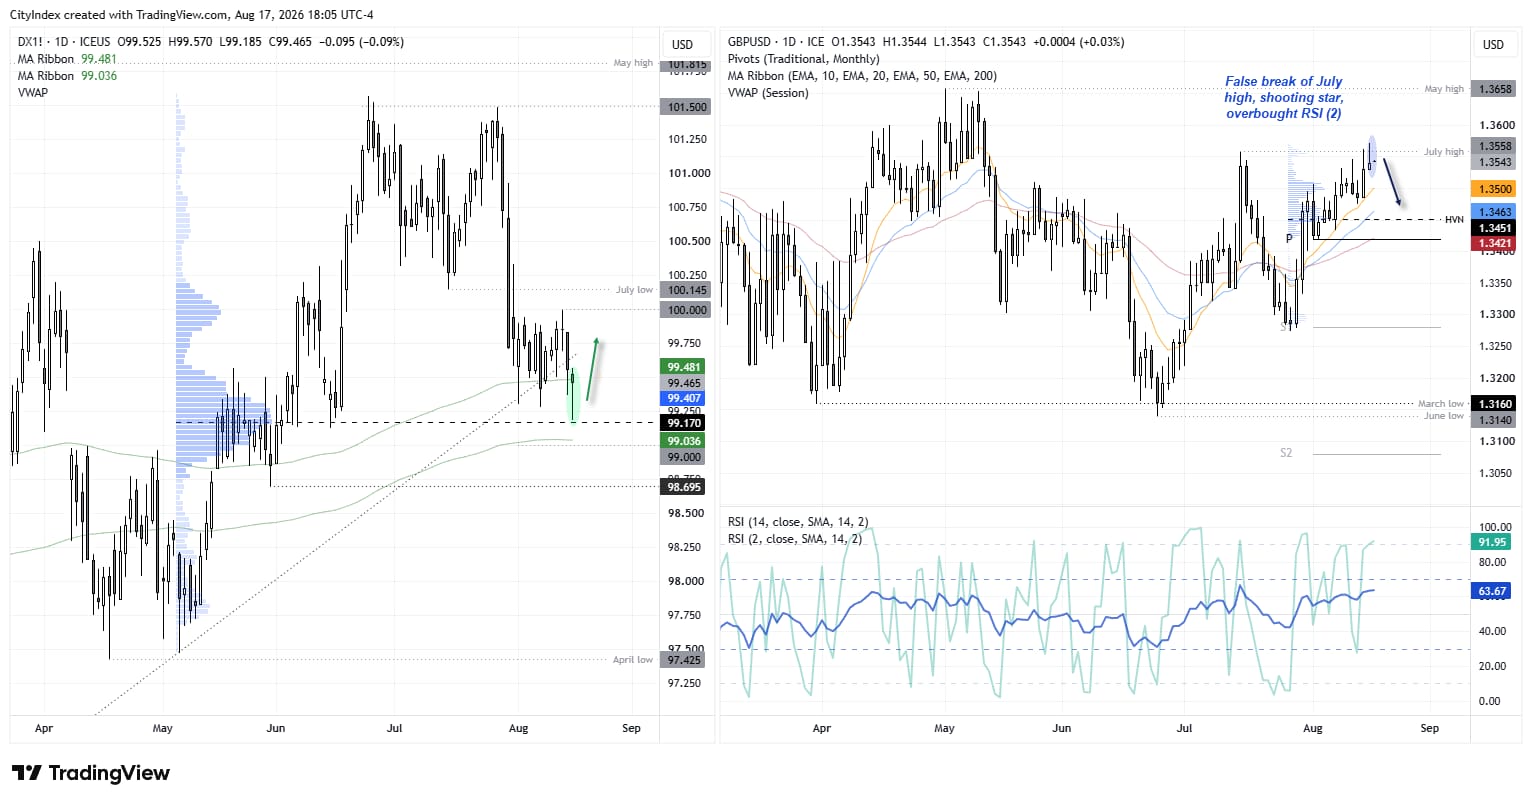
Today’s employment report could come at an interesting juncture for GBP/USD if it comes in weak. A shooting star candle formed on Monday, with a false, intraday break of the June high. With the US dollar index holding above support despite bearish sentiment towards it, I am on guard for a countertrend bounce for the US dollar.
I am not seeking a particularly large bearish move, but with price action showing bearish clues with the US dollar at support, a pullback could be on the cards. Note that the 50-day EMA is near the monthly pivot point just above 1.34. Though a high-volume node also sits at 1.3451 for potential support.
Source: ICE, TradingView
GBP/AUD Technical Analysis: British Pound vs Australian Dollar
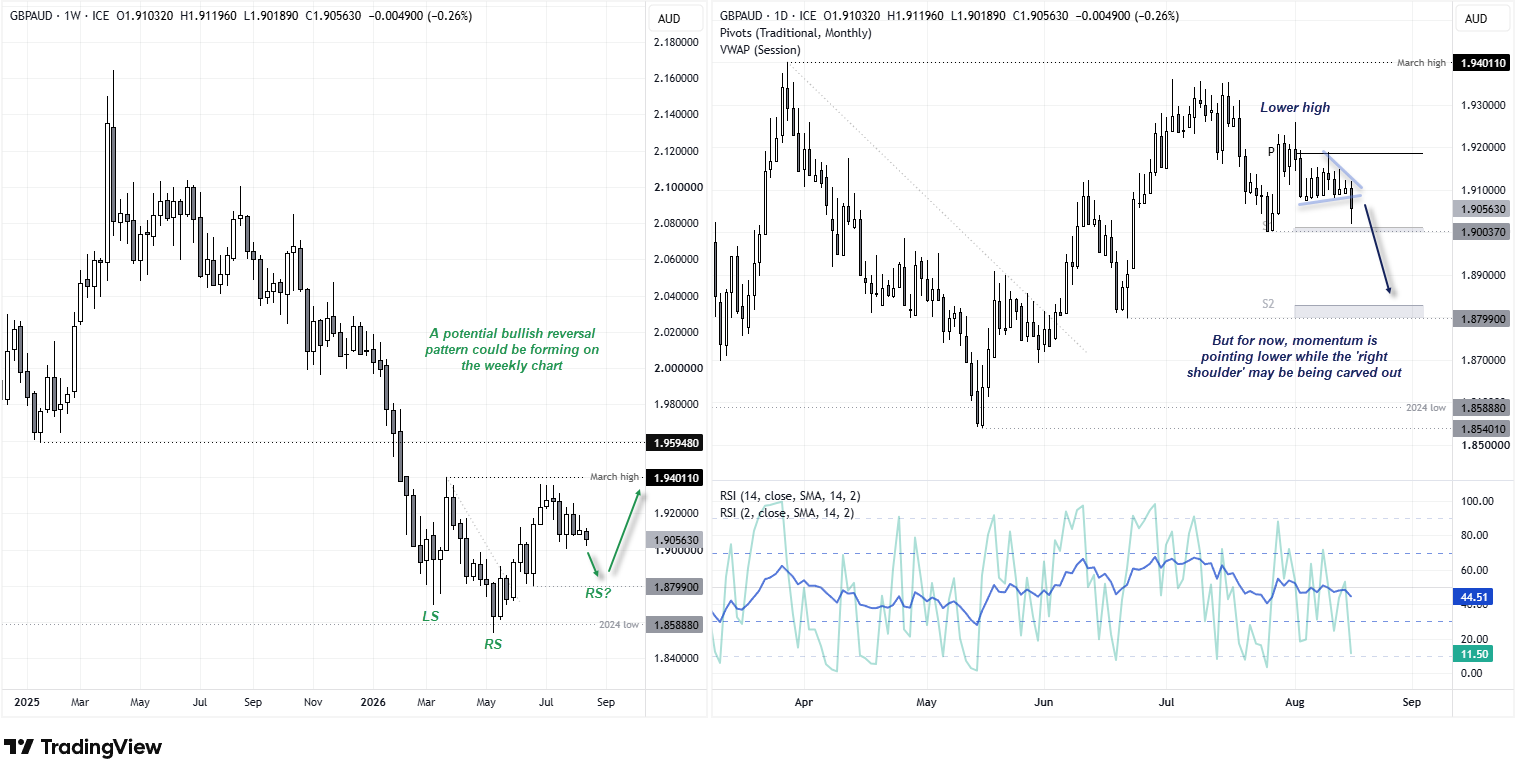
I have been patiently watching the tight consolidation for GBP/AUD in hope that the market tips its hand. And Monday’s bearish breakout may have done just that. The daily chart on the right shows prices are trading within a tightening compression pattern around 1.91, though bears clearly took control to send GBP/AUD down to a 14-week low. While the July low, monthly S1 pivot and 1.90 handle are providing support for now, a break beneath it could open up a run for the 1.89 handle and monthly S2 pivot, near the 1.880 low. And a weak employment report could be a potential trigger for its next leg lower. Conversely, a surprise upside set of jobs figures could held the British pound recover on the back of refreshed BOE hike bets. But for now, my bias is to the downside.
GBP/AUD Weekly Chart Hints at a Potential Bullish Reversal
Further out, we also have a potential bullish reversal pattern to monitor on the weekly timeframe. It appears that an inverted head and shoulders reversal could be forming, which could mean the current pullback is part of the right shoulder. If we find that a prominent swing low forms above 1.88 on the daily chart, we can reconsider the potential for the ‘right shoulder’ to have formed as part of the H&S pattern. For now, I am focusing on how prices react around 1.90.
Source: ICE, TradingView
View the full economic calendar
-- Written by Matt Simpson
Follow Matt on Twitter @cLeverEdge
How to trade with City Index
You can trade with City Index by following these four easy steps:
- Open an account, or log in if you’re already a customer
• Open an account in the UK
• Open an account in Australia
• Open an account in Singapore
- Search for the market you want to trade in our award-winning platform
- Choose your position and size, and your stop and limit levels
- Place the trade
Related tags:







Web Trader platform
Our sophisticated web-based platform is packed with features.
Open an account today
Experience award-winning platforms with fast and secure execution.
Economic calendar
Related articles

Gold Falters at Resistance, Grappling With PCE, Month-End Flows and Jackson Hole
Gold has pulled back from resistance after sticky PCE data, with month-end flows and Jackson Hole now shaping the near-term outlook.

AUD/USD Nears 72c as AU and US CPI, Jackson Hole Loom
AUD/USD is closing in on 72c as Australian and US inflation reports collide with Jackson Hole, setting the stage for a potentially volatile end to the week.

ASX 200 Outlook: Jackson Hole Puts Monday Volatility in Focus
ASX 200 volatility tends to rise after Jackson Hole, while sector correlations highlight the clearest support, resistance and leadership signals.