


Gold Price Outlook: Speed Bump Seems Unlikely to Deter Dip Mentality
Gold has wobbled after its breakout, but bullish positioning and options signals suggest dip buying could remain supportive.
Written by
Matt Simpson
Market Analyst
Throughout July, I had been noting the repeated failed attempts from gold bears to sustain a break below 4,000. And when a level won’t budge, the market has a tendency to eventually go the other way.
Last Tuesday, August 4, I outlined a case for a breakout, arguing that price action, options pricing and futures sentiment all hinted at quiet accumulation. Maybe I got lucky with the timing, but the breakout on August 5 was spectacular, to say the least, with gold rising 5% to mark its best day since February and its second-best day in ten years.
While I suspect gold bulls have more planned, price action on Thursday shows prices have wobbled at their cycle high, hinting at the first bump in the road.
View related analysis:
- Gold Price Outlook: Can Quiet Accumulation Trigger a Breakout?
- ASX 200 Outlook: Potential Bull Flag Forms Beneath Record Highs
- US Dollar Bounce Looks Vulnerable, EUR/USD Respects Resistance for Now
- Japanese Yen Outlook: US CPI, Intervention Risks Put USD/JPY Bulls on Notice
- FX Futures Positioning: US Dollar Longs Plunged, Yen Shorts Slashed
Gold Wobbles, but ‘Dip’ Mentality Could Remain
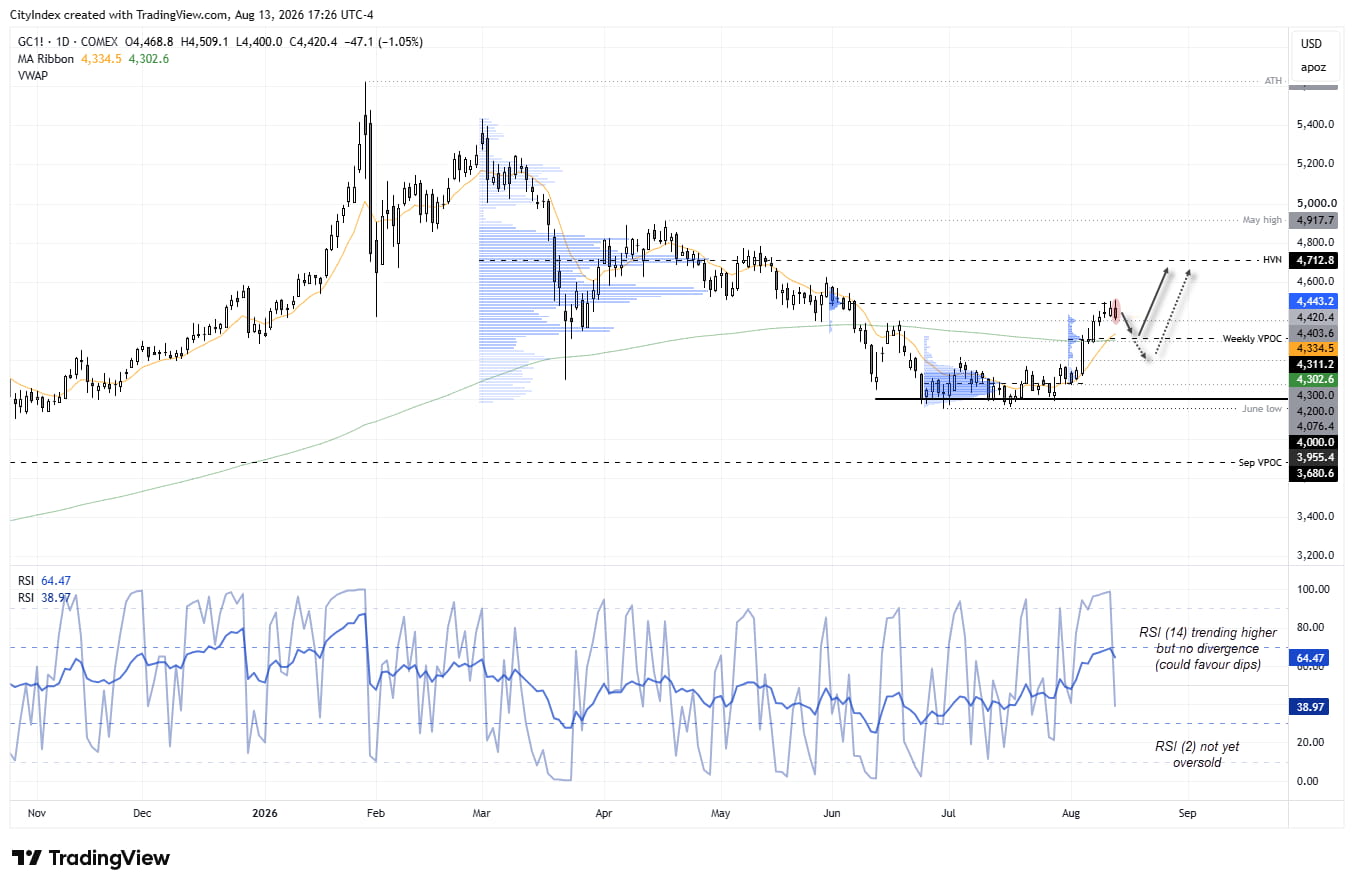
The daily chart shows a solid rally from 4,000 support, although resistance was met around a prior weekly VPOC (volume point of control), just below 4,500. A bearish outside day engulfed Tuesday’s small doji and Wednesday’s small bullish candle, but so far, support has held around 4,400, close to the weekly VPOC at 4,404.
A break beneath this area would bring the 200-day EMA into focus near 4,300, along with the lower end of the recent trading range. If we see bears take full control, the next level they could potentially target is around 4,200, near the recent range lows.
However, given the strength of the bullish range expansion after a prolonged period of consolidation above 4,000, my bias remains for a move towards 4,700, with 4,600 likely to provide interim resistance along the way should the rally continue. Moreover, futures and options sentiment also appears supportive of a “buy the dip” mentality among gold bulls, some of whom may be frustrated at having missed the initial burst higher.
Source: COMEX, TradingView
Gold Price Outlook: Futures Positioning and Options Signals
Gold Futures (GC) Positioning | COT Report
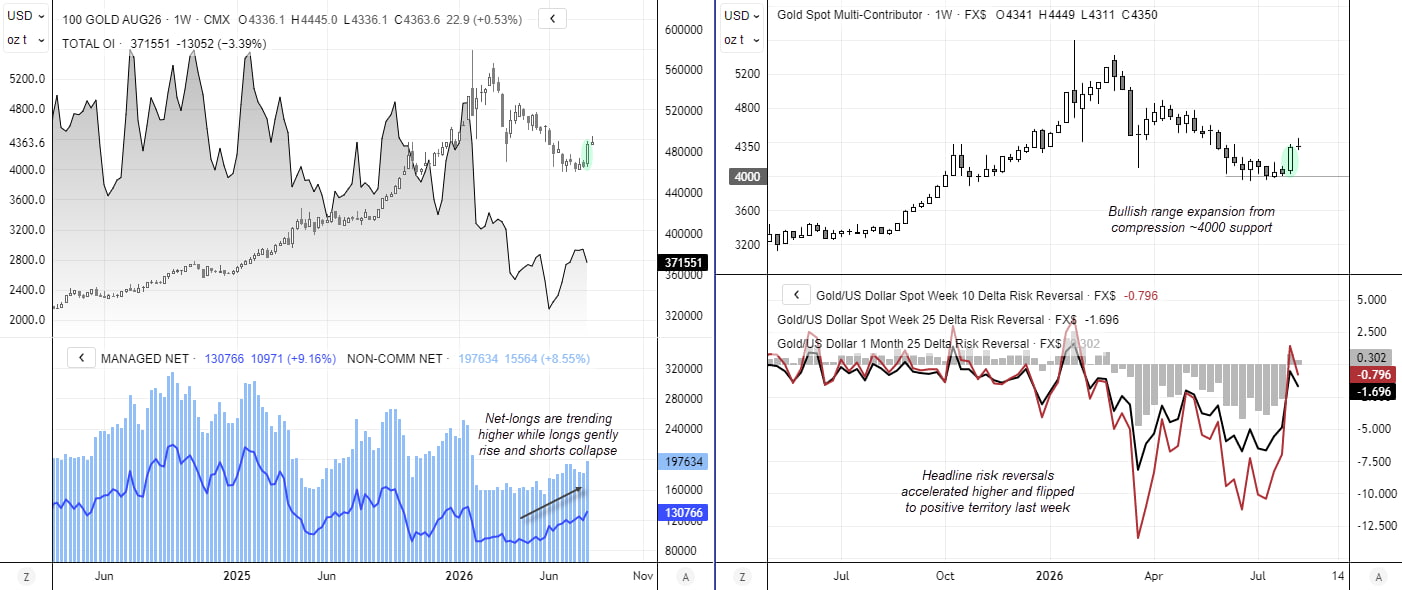
Net-long exposure has continued to trend higher to gold futures, among large speculators and managed funds managers. Recent data from the weekly Commitment of Traders (COT) report shows funds had a net-long exposure of 131k contracts, their most bullish level in more than six months. Large specs pushed their net-long exposure to a 6-month high just shy of 200k. While gross-longs have been trending gradually higher, it is the collapse of short bets that helped propel net-longs in recent weeks. And I suspect that will continue to be a supporting feature for higher gold prices, with a lack of bearish interest for now.
This content was created by an affiliate of FOREX.com and represents the views and opinions of the author/speakers, not the views and opinions of FOREX.com, StoneX Group Inc., or its subsidiaries. The content has not been independently reviewed by FOREX.com.
Gold Options Positioning Signals Cautious Bullishness
Two of the three risk reversals I track had flipped into positive territory last week, for the first time since mid-April. This showed that demand for calls outnumbers demand for puts. But we also saw the risk reversals accelerate from low levels ahead of the breakout to show options traders quickly moving away from downside protection relative to bullish bets. The fact it has dipped to negative territory this week is not enough to call for a major swing high in my books, but it does back up the potential for a minor pullback over the near term
Source: ICE, TradingView
View the full economic calendar
-- Written by Matt Simpson
Follow Matt on Twitter @cLeverEdge
How to trade with City Index
You can trade with City Index by following these four easy steps:
- Open an account, or log in if you’re already a customer
• Open an account in the UK
• Open an account in Australia
• Open an account in Singapore
- Search for the market you want to trade in our award-winning platform
- Choose your position and size, and your stop and limit levels
- Place the trade
Related tags:
Latest market news










Web Trader platform
Our sophisticated web-based platform is packed with features.
Open an account today
Experience award-winning platforms with fast and secure execution.
Economic calendar
Related articles

Gold and S&P 500 analysis: What now after Warsh’s hawkish speech?
The dollar surged across the board after the Fed Chair Kevin Warsh surprised with a hawkish-leaning speech at the Jackson Hole summit. All the bearish dollar bets that had been accumulated since last Friday on the back of data weakness and bond market troubles had to be squared and that triggered a short squeeze rally for the dollar. Gold and silver dropped, as a result, as too did bitcoin, while US indices were giving back earlier gains.


EUR/USD forecast: All eyes on Warsh at Jackson Hole - Forex Friday
For much of this week, the EUR/USD has been edging lower with the US dollar regaining some ground after last week’s sell-off that was triggered, in part, by the bond market worries. Investors have been unwilling to bet further against the US dollar so far this week ahead of Kevin Warsh’s keynote speech at the Jackson Hole summit, due later today.

Nasdaq 100 forecast: Tech stocks shine as Nvidia results underpin AI trade
Much of this week’s attention has been on Nvidia’s earnings, and the chipmaker delivered the sort of numbers of investors had been hoping for. US index futures initially wobbled before moving higher overnight, with the results providing a fresh lift to the AI trade