

USD/CAD shooting star puts September surge on notice
USD/CAD has printed a clear bearish reversal pattern after an extraordinary September surge, but confirmation may depend heavily on how US Treasury yields react to Friday’s payrolls report.
Written by
David Scutt
Market Analyst
- USD/CAD surged more than five big figures in September
- ATR stretch sits in the 97th historical percentile
- Front-end US yields increasingly influence USD/CAD movements
- Payrolls could determine whether Thursday’s reversal signal sticks
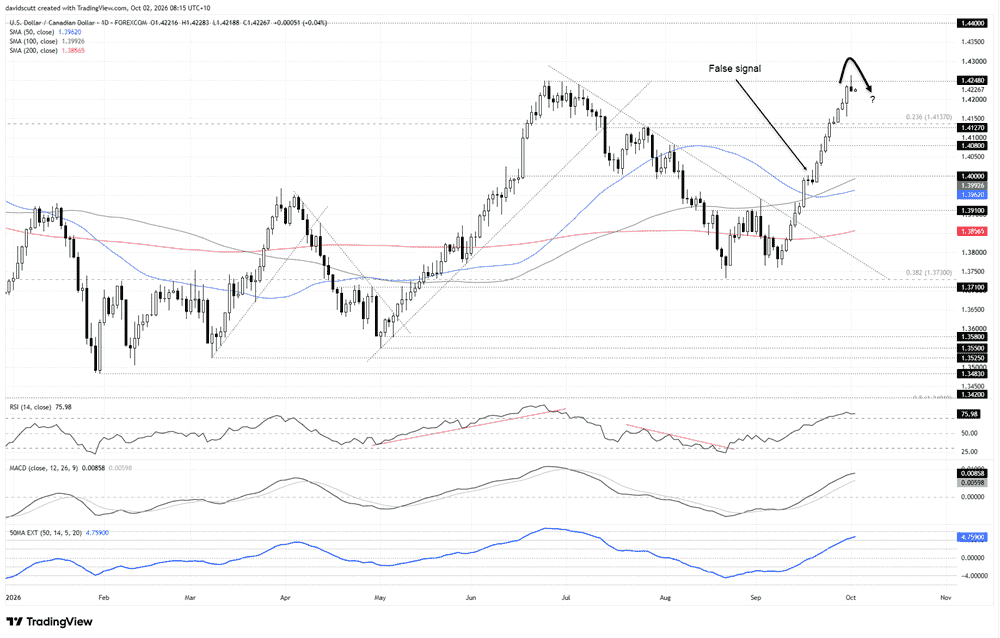
USD/CAD went on an incredible bullish run in September, surging more than five full big figures. However, after a false break above key resistance on Thursday, we’ve seen a clear bearish reversal pattern print.
With the pair very stretched by historical standards, it suggests any reversal could have legs if it plays out. However, confirmation is still needed. And with USD/CAD showing a close relationship with front-end US Treasury yields, Friday’s US non-farm payrolls report looms large as a potential fundamental catalyst that could determine whether the signal sinks or swims.
USD/CAD reaches rare levels of extension
Source: TradingView
You can see the scale of the bullish trend seen in September on the daily chart above, which saw USD/CAD break multiple resistance levels and reclaim its key medium and longer-term moving averages. However, looking at the oscillators, it’s clear the strength of the move has left the pair stretched, with RSI (14) sitting above 75 and MACD continuing to track higher.
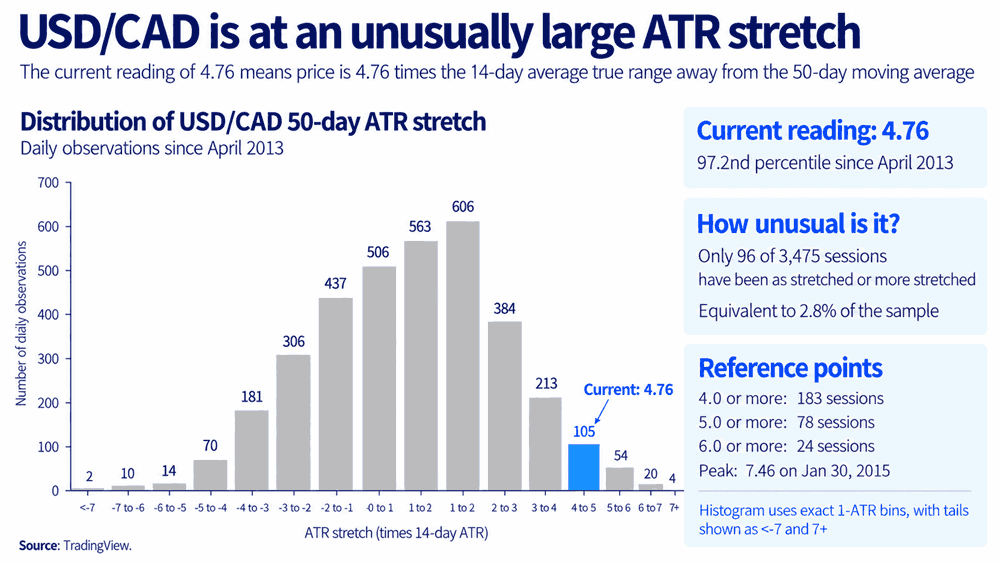
The ATR 50 stretch indicator, which measures how far price sits from its 50-day moving average in multiples of the 14-day average true range, is now at historically extreme levels. At 4.76 times, the reading sits in the 97th percentile of all observations in a dataset going back to April 2013.
Source: TradingView
But just because USD/CAD is stretched and historically rare does not mean an imminent reversal is coming. Looking at previous episodes when the pair reached similar levels of extension, there was no clear or consistent pattern in price action over the following five, 20 or 60 sessions.
US remain key driver
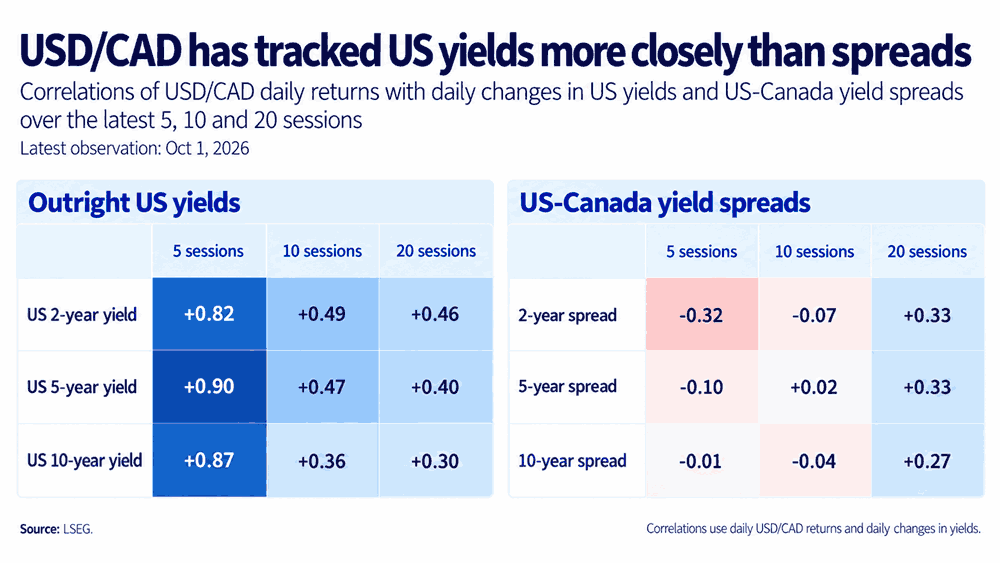
What we do know is that movements at the front of the US Treasury curve, which are heavily influenced by the Fed monetary policy outlook, have become increasingly influential on USD/CAD recently.
Source: LSEG
Correlations with US 2, 5 and 10-year yields have ranged from +0.82 to +0.90 over the past week, far stronger than what had been seen over the past fortnight and month, hinting it’s the US interest rate outlook rather than Canada’s that has been helping drive the pair higher.
Relative US-Canada yield spreads across those same tenors have shown little to no meaningful relationship with movements in the pair over the same windows.
We have to be careful about reading too much into such a short timeframe. But looking at the US dollar’s performance more broadly in September, the extreme rise in front-end Treasury yields was undeniably a factor behind its outperformance against most G10 FX names.
Payrolls could make or break reversal signal
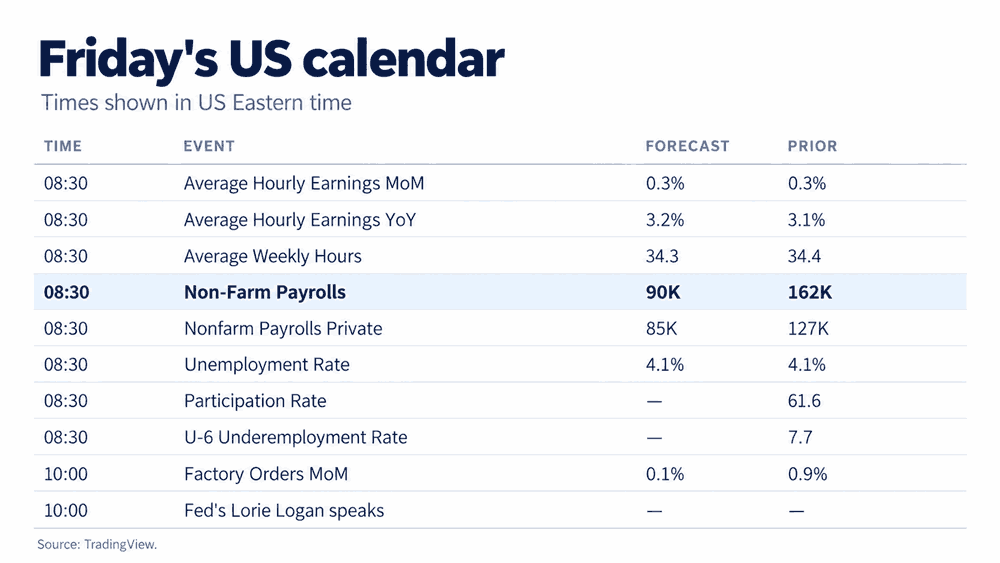
Given the strength of the relationship between USD/CAD and front-end Treasury yields, market interpretation of Friday’s payrolls report may be crucial in determining whether the reversal signal that printed on Thursday is confirmed or turns out to be another nothing burger, as we’ve seen previously in the middle of September, when another shooting star candle ultimately failed to deliver.
Source: TradingView
In the lead-up to the payrolls report, all the supplementary labour market data has been tough as teak, with ADP private sector payrolls blowing past forecasts, Challenger job layoffs in September falling to multi-year lows for the month, and jobless claims printing at multi-month lows last week.
While the payrolls report has not been the most reliable indicator recently, that points to the potential for an upside surprise. As always though, more broadly it comes down to the unemployment rate to ultimately determine the implications for monetary policy.
While the vast majority of Fed members have continued to suggest it’s the price stability side of its dual mandate that it’s prioritising right now given persistently elevated inflation, recent speeches from influential Fed members John Williams from the New York Fed and Philip Jefferson, the vice chair of the FOMC, suggest it may take a super-hot payrolls print, potentially alongside signs of accelerating wage pressures and a drop in unemployment, to get markets back on the scent of a potential follow-up rate hike in October.
Market-implied probabilities are now sitting around 25%, down from more than 50% earlier this week.
USD/CAD technical levels to watch
After failing to sustain the push above resistance at 1.4248 on Thursday, the subsequent reversal delivered a shooting star candle on the daily chart, putting downside levels in play.
Momentum indicators still point to a strong bullish trend, although RSI (14) has started to roll over slightly after pushing relentlessly higher through much of September. That’s nowhere near enough on its own to suggest the move is finished, but alongside the shooting star and extreme stretch, it’s something worth keeping in mind.
Should the reversal signal be confirmed, the first downside area of note is a support zone comprising the 23.6% Fibonacci retracement of the 2021 to 2025 low-high, along with horizontal support at 1.4127. Below there, 1.4080 and 1.4000 come into view, with the latter also now in close proximity to both the 50 and 100-day moving averages.
Of course, without confirmation, it’s undeniable the overall trend is still bullish. So if we were to see a resumption of the move above 1.4248 that sticks, levels to watch overhead include 1.4400, which acted as resistance in early 2025, along with 1.4543, the double top set in March 2025.
Given the proximity of the price to 1.4248, it looms as the level to keep in mind when assessing and building trade setups.
Latest market news










Web Trader platform
Our sophisticated web-based platform is packed with features.
Open an account today
Experience award-winning platforms with fast and secure execution.
Economic calendar
Related articles

Gold and S&P 500 analysis: What now after Warsh’s hawkish speech?
The dollar surged across the board after the Fed Chair Kevin Warsh surprised with a hawkish-leaning speech at the Jackson Hole summit. All the bearish dollar bets that had been accumulated since last Friday on the back of data weakness and bond market troubles had to be squared and that triggered a short squeeze rally for the dollar. Gold and silver dropped, as a result, as too did bitcoin, while US indices were giving back earlier gains.


EUR/USD forecast: All eyes on Warsh at Jackson Hole - Forex Friday
For much of this week, the EUR/USD has been edging lower with the US dollar regaining some ground after last week’s sell-off that was triggered, in part, by the bond market worries. Investors have been unwilling to bet further against the US dollar so far this week ahead of Kevin Warsh’s keynote speech at the Jackson Hole summit, due later today.

Bitcoin Forecast: BTC/USD Back to $80K Ahead of Warsh’s Jackson Hole Speech
After surging over $15,000 in the past 10 days alone, there is risk of a near-term pullback if Warsh says anything remotely hawkish at Jackson Hole - what are the levels to watch from here?
