

Gold Price Outlook: XAU/USD Resistance at $4200 Sets Up for NFP
It was a strong sell-off to start the week in gold and despite a Tuesday bounce, sellers are continuing to push following a resistance hit at the $4200 level.
Written by
James Stanley
Sr. Strategist
Gold Talking Points:
- As yields surged gold tanked to start the week, and despite a softer-than-expected Core PCE report XAU/USD bears have continued to hit pullbacks.
- This sets the stage for NFP on Friday and, in gold, perhaps the bigger question is whether sellers can force a break below $4100 and a re-test of the hardened support from June and July at the $4k level.
Gold prices put in a sizable drop on Monday and this comes after the metal had previously held up fairly well despite Treasury yields surging along the curve over the past couple of weeks. While last week saw gold hold above the FOMC low, that price was taken out aggressively to start this week and, so far, sellers have swatted down rallies below that price.
On a shorter-term basis, this had built a bear flag formation on shorter time frames and sellers have pushed below the formation, opening the door for a re-test of the lows which are then followed by the $4100 level that was setting resistance back in July, before the breakout.
Gold Two-Hour Price Chart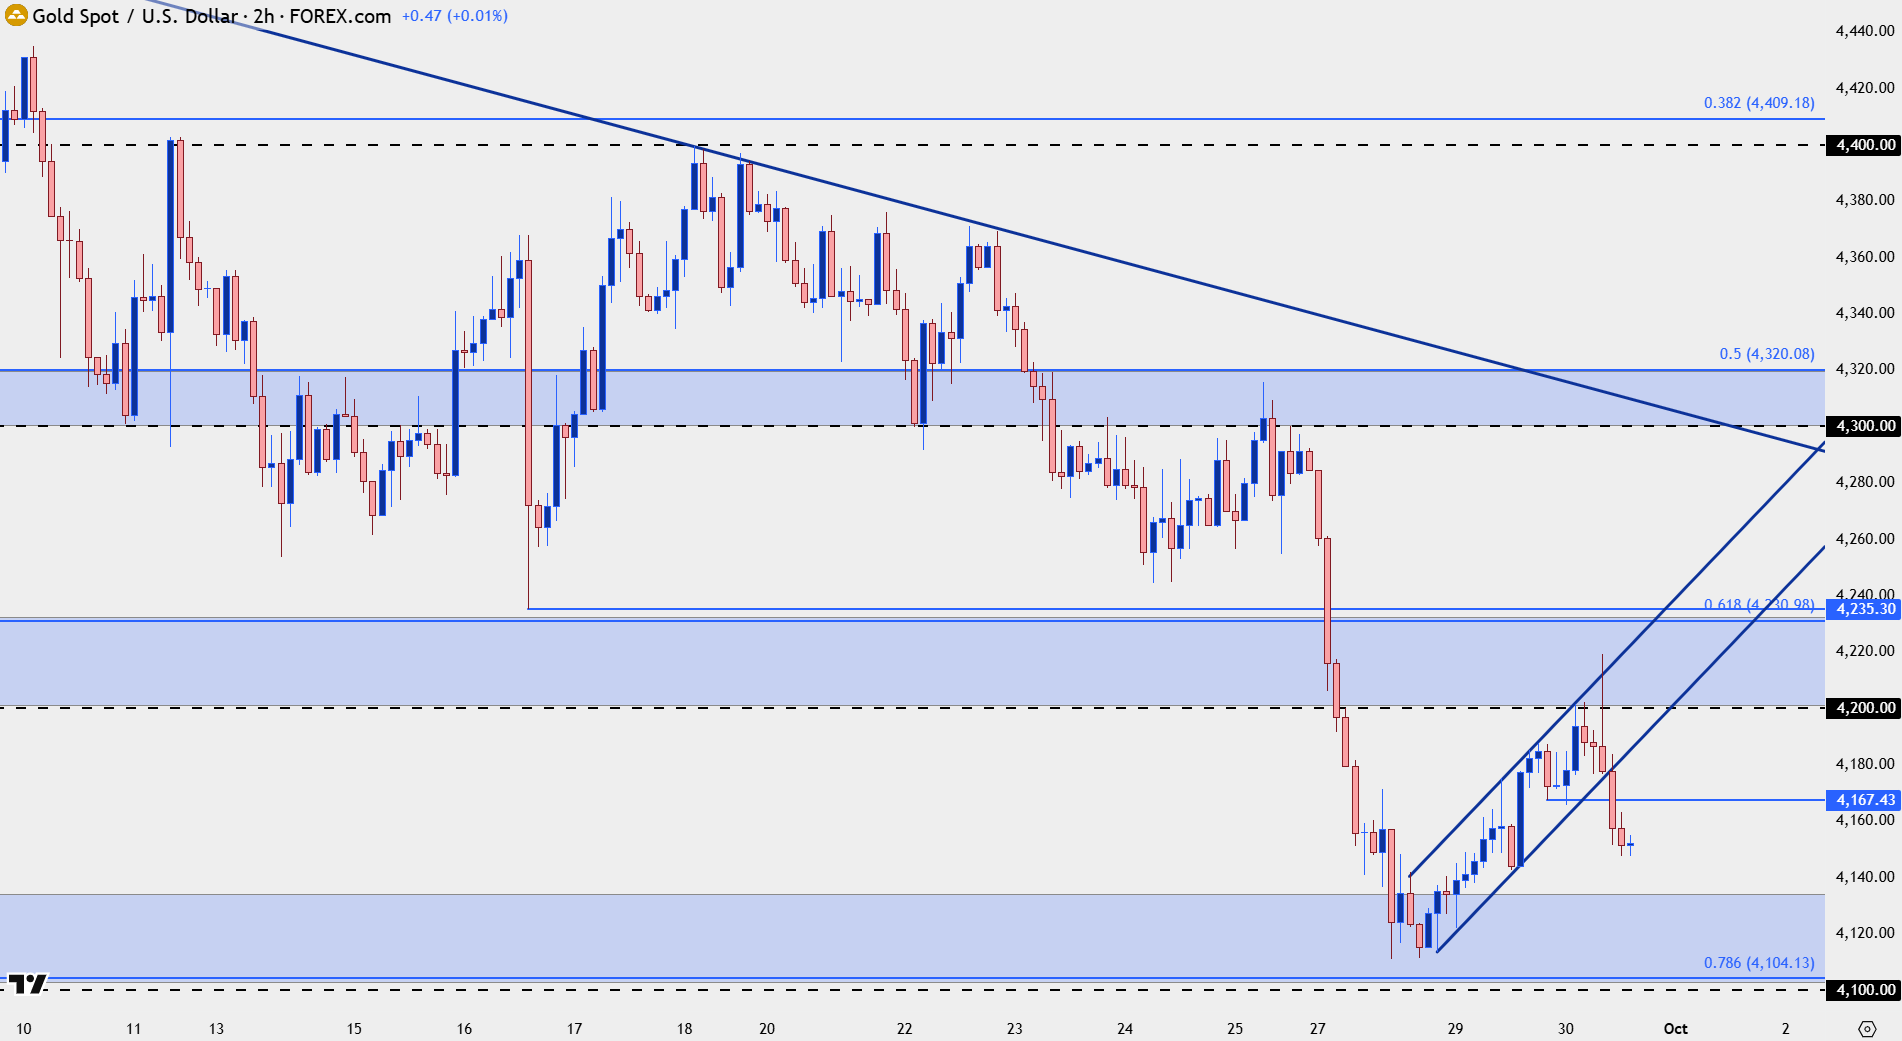
Chart prepared by James Stanley; data derived from Tradingview
Gold Descending Triangle Break
From the daily, we can see the descending triangle formation that had built ahead of the weekly open. That’s a bearish formation and the sell-off on Monday took out that support as price ran down to a fresh monthly low.
This further highlights bearish control and opens the door for sellers to take another swing-lower, with that $4k level standing out as the next spot of support underneath the $4100 zone.
Gold Daily Chart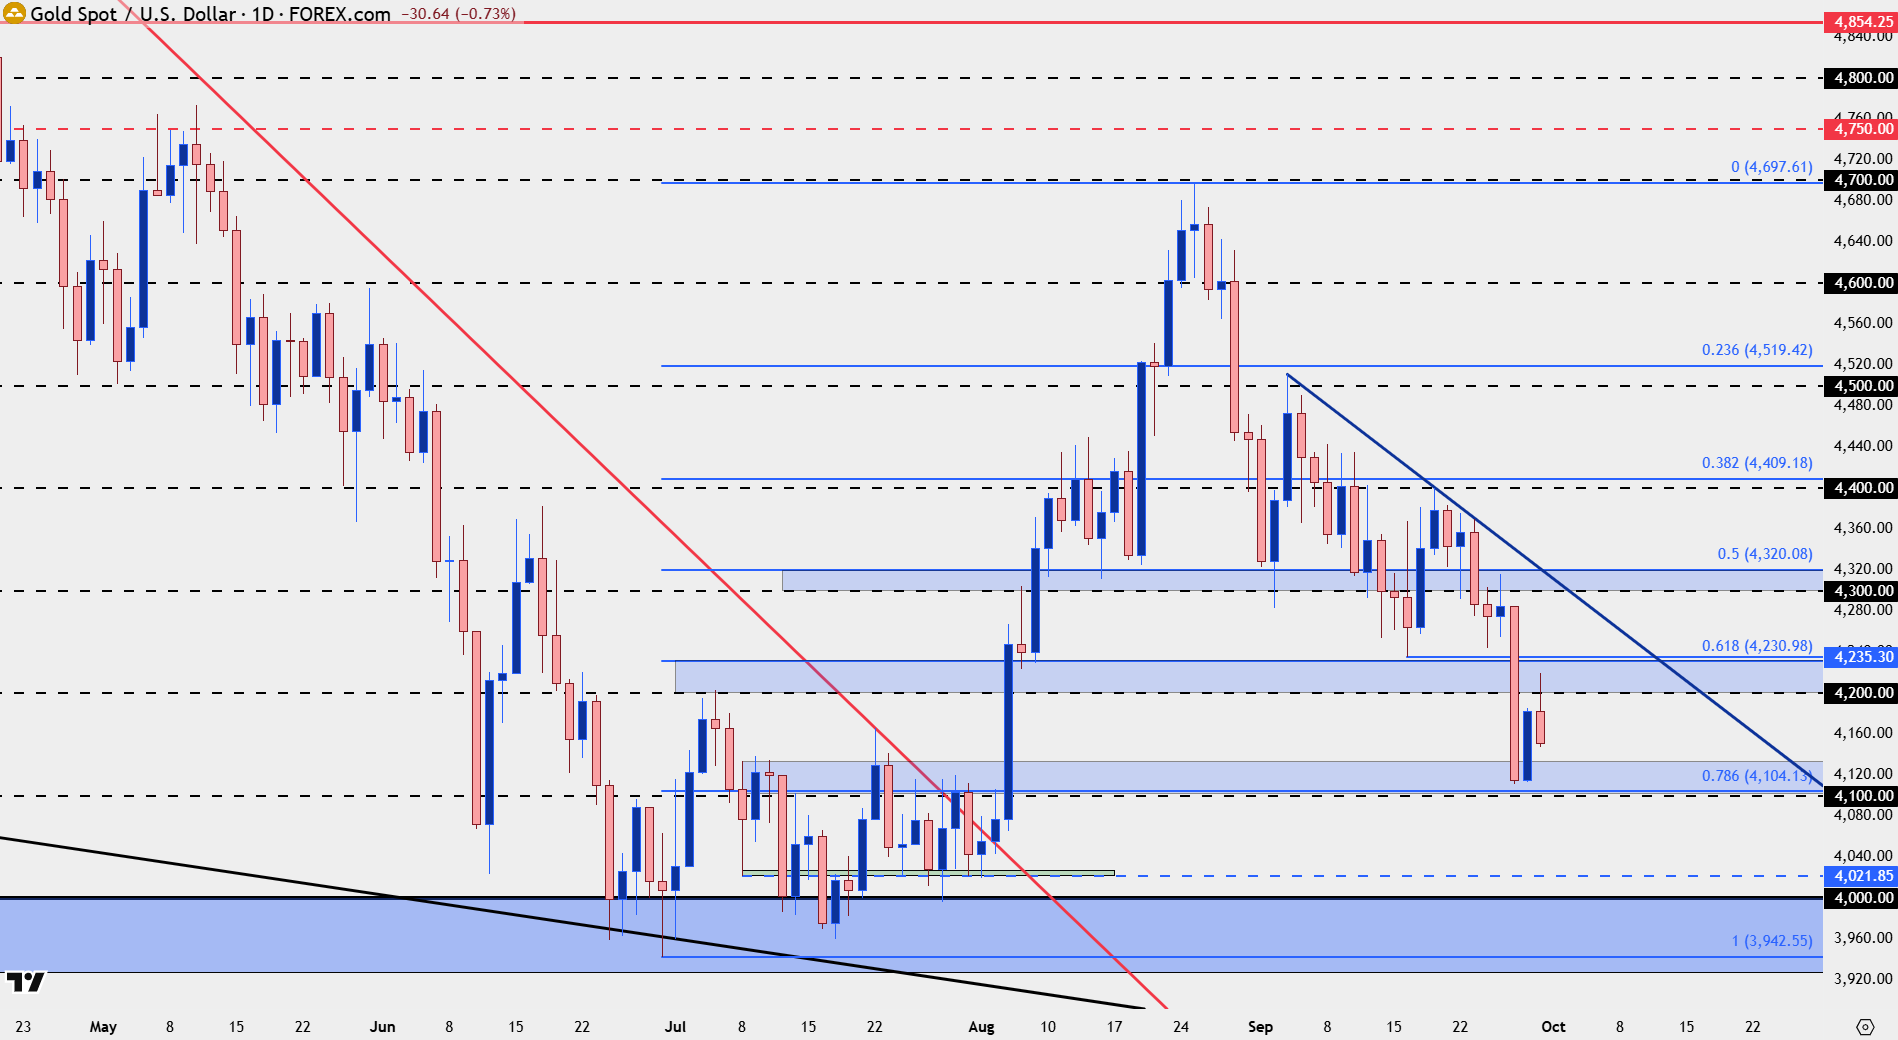
Chart prepared by James Stanley; data derived from Tradingview
Gold Big Picture: The $4k Line in the Sand
While the fundamental backdrop remains unfavorable for gold, the same could be said back in June or earlier in the year, as inflation expectations were flaring on the back of higher oil prices. That then drove rate expectations and that’s what brings us to our current backdrop, where we have both surging Treasury yields and hawkish expectations around the FOMC.
But, really, it was the support hold at the $4k level that coalesces the shorter and longer-term views, as that short-term weakness simply allowed for longer-term accumulation and from the weekly chart, we can see how incredibly important that $4k level remains to be.
This has a few different connotations: For bears with shorter-term strategies, this means that expecting a higher-low, at least on the first few breakdowns and tests near $4k, would probably be pretty prudent. If we do finally see the $4k level get taken out, that opens the door for $3500, and then $2790.
But – if we do see a higher-low above $4k, similar to what showed after the June FOMC meeting – followed by a build of lows and wicks on the weekly chart at that $4k handle – there could soon be a reversal to entertain.
Gold Weekly Chart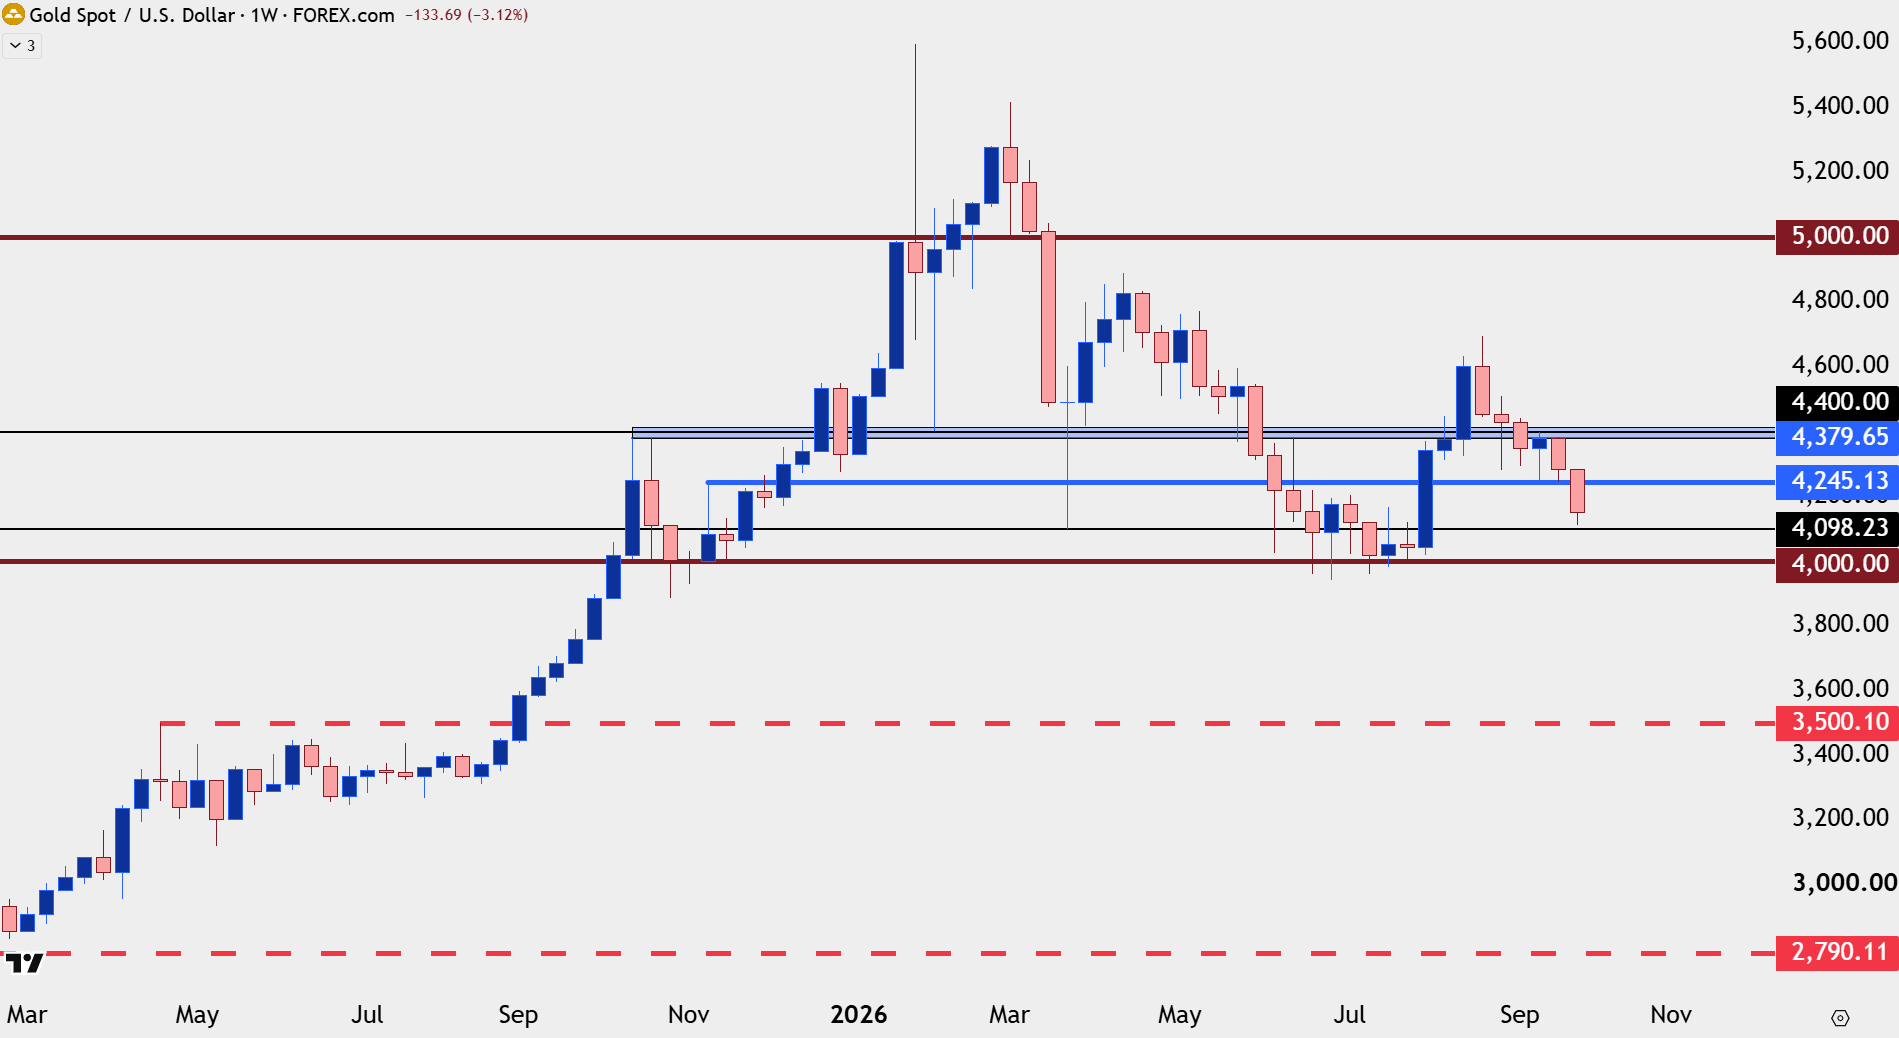
Chart prepared by James Stanley; data derived from Tradingview
--- written by James Stanley, Senior Market Analyst, Global Macro
Related tags:
Latest market news











Web Trader platform
Our sophisticated web-based platform is packed with features.
Open an account today
Experience award-winning platforms with fast and secure execution.
Economic calendar
Related articles

Gold and S&P 500 analysis: What now after Warsh’s hawkish speech?
The dollar surged across the board after the Fed Chair Kevin Warsh surprised with a hawkish-leaning speech at the Jackson Hole summit. All the bearish dollar bets that had been accumulated since last Friday on the back of data weakness and bond market troubles had to be squared and that triggered a short squeeze rally for the dollar. Gold and silver dropped, as a result, as too did bitcoin, while US indices were giving back earlier gains.


Gold Falters at Resistance, Grappling With PCE, Month-End Flows and Jackson Hole
Gold has pulled back from resistance after sticky PCE data, with month-end flows and Jackson Hole now shaping the near-term outlook.


Gold forecast: XAU/USD retreats along with dollar debasement trade
Gold was down nearly 1.5% on the session, with US indices and Bitcoin also struggling. Is this a mere pause before more gains are seen, or have we already seen the end of the recent bullish advance?