

Japanese Yen Outlook: EUR/JPY and GBP/JPY Outbid USD/JPY
The Japanese yen starts the week mixed, with EUR/JPY and GBP/JPY showing bullish potential while USD/JPY remains stuck in a rut.
Written by
Matt Simpson
Market Analyst
The Japanese yen began the week with a mixed performance, weakening against the euro, British pound and New Zealand dollar while holding up better against the Australian and Canadian dollars. However, technical setups suggest EUR/JPY and GBP/JPY offer greater bullish potential than the rangebound USD/JPY, although a weekly shooting star on GBP/JPY warrants caution. With no clear divergence between Fed and BOJ policy expectations to drive the US dollar against the yen, traders may find more compelling opportunities in the European crosses.
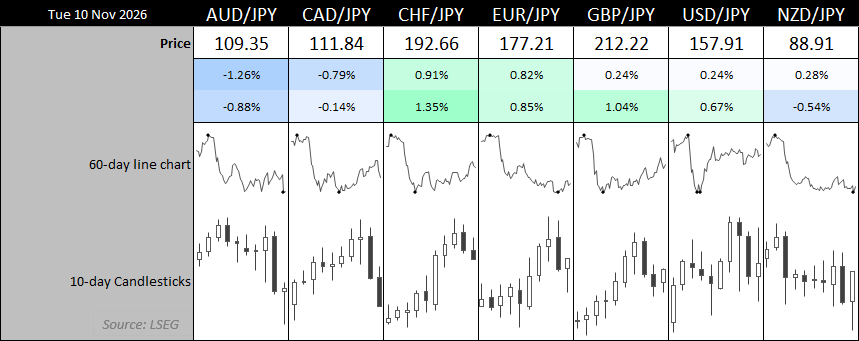
EUR/JPY and GBP/JPY Show Bullish Potential as USD/JPY Lacks Direction
USD/JPY Lacks Direction as Fed and BOJ Divergence Fades
The most constructive feature for USD/JPY bulls is that prices continue to hold above the 200-day EMA. Beyond that, there is not much more to it. Traders currently lack a clear divergence theme between the Fed and BOJ to drive a sustained breakout, making USD/JPY better suited to shorter intraday timeframes than traders seeking moves in excess of 100 pips.
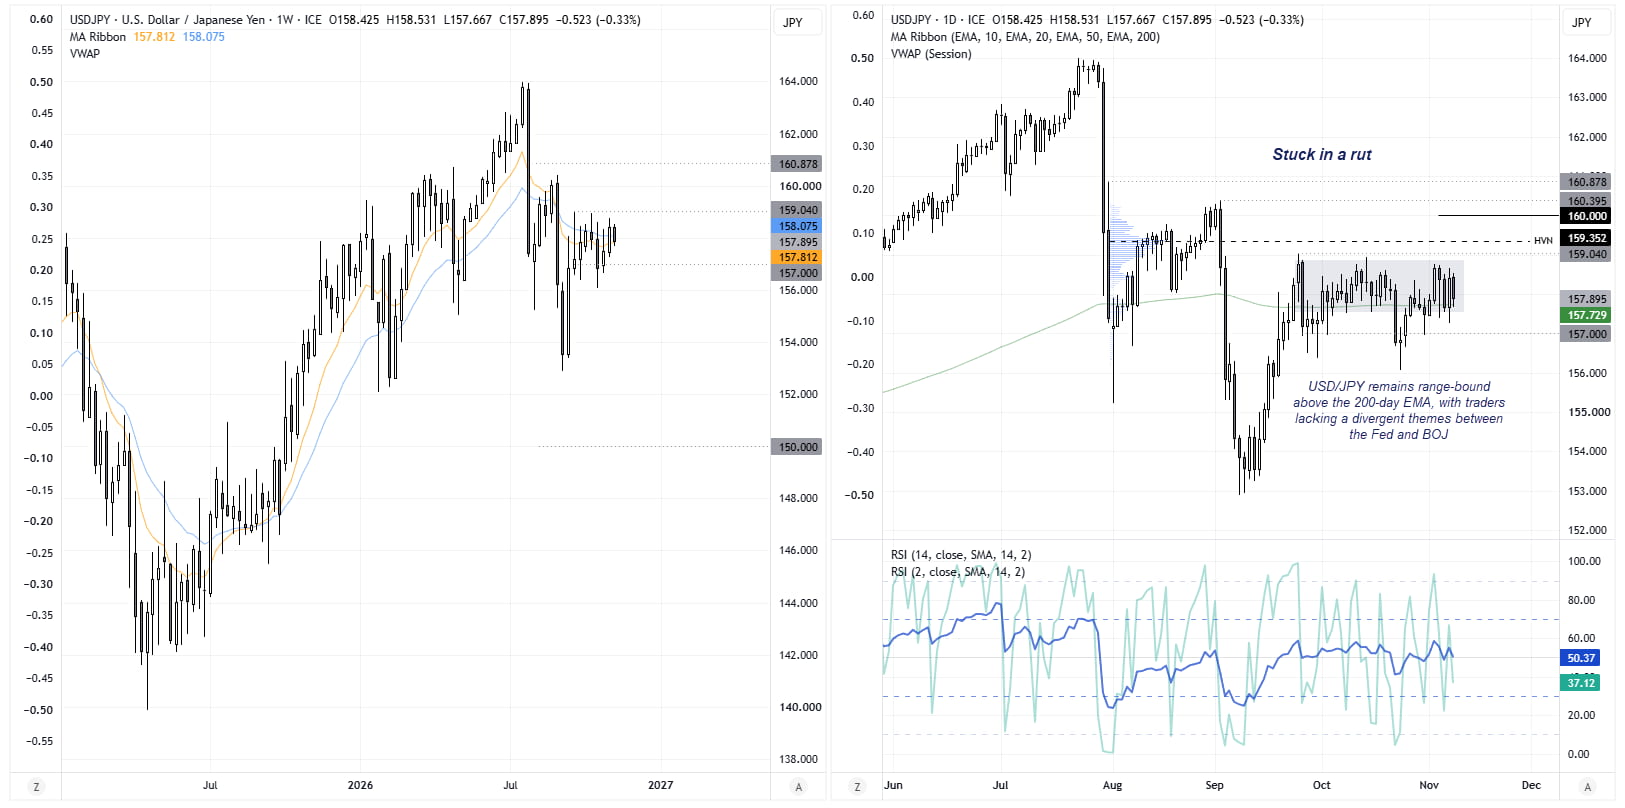
Source: ICE, TradingView
EUR/JPY Falling Wedge Keeps 181.55 in Sight
I first highlighted the potential falling wedge on EUR/JPY at the end of October, outlining my bias for an upside break – assuming prices could hold above the recent swing lows. After forming a double bottom around 175, momentum did indeed turn higher. A long-legged doji around 178 marked the beginning of a pullback, but Monday’s bullish engulfing candle snapped a two-day correction and suggests the bullish wedge pattern remains in play.
If successful, the falling wedge projects an upside target near its base at 181.55 for EUR/JPY.
Bulls could seek dips within Monday’s range in the hope of improving the potential reward-to-risk ratio for moves towards 178, 179 and 180. However, prices could still retrace towards the November 2025 low around 175.70 without necessarily invalidating the wedge formation.
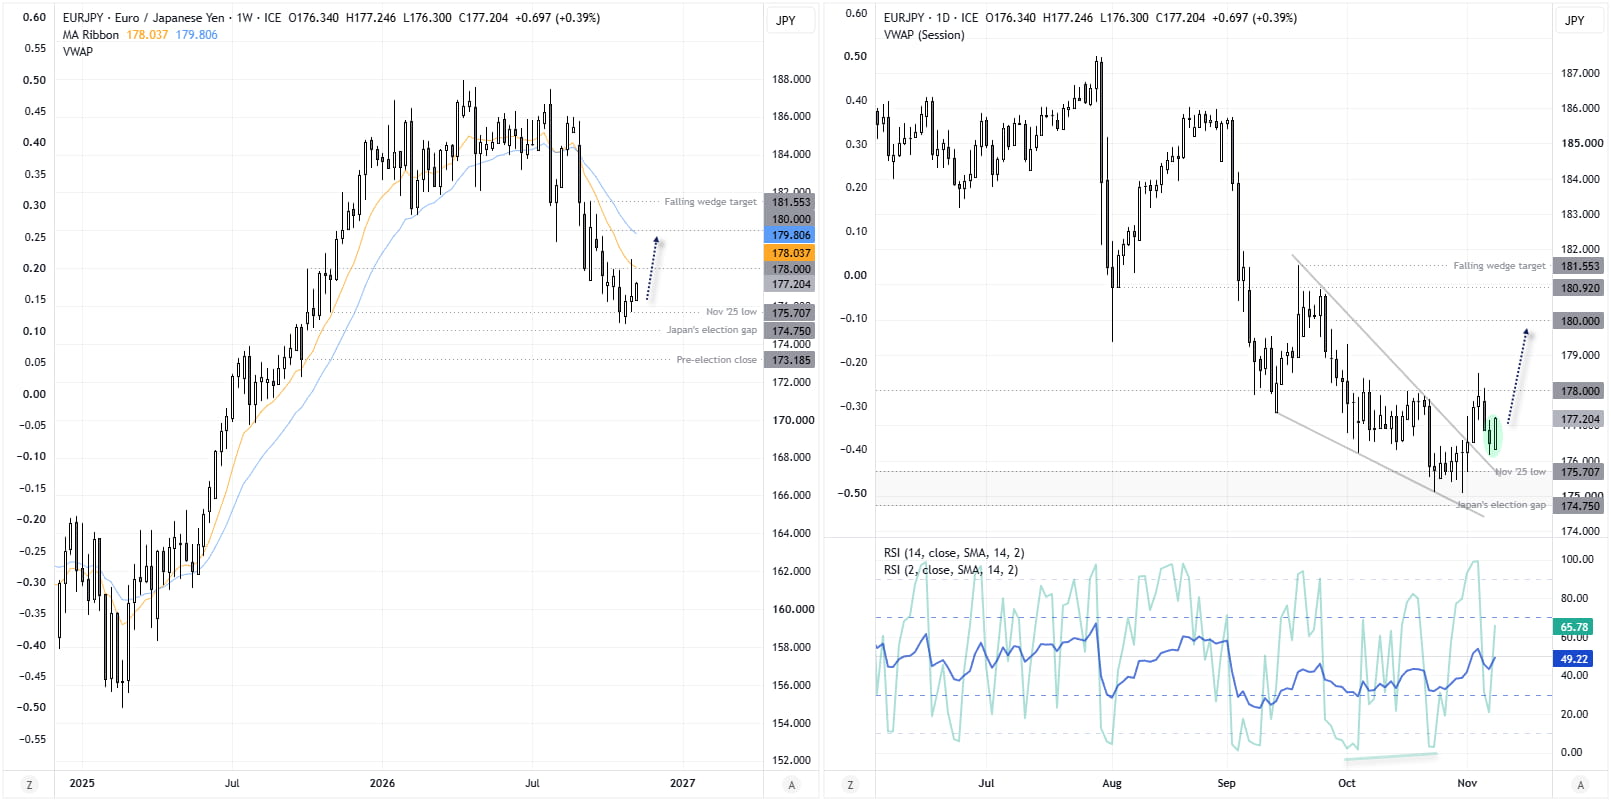
Source: ICE, TradingView
This content was created by an affiliate of FOREX.com and represents the views and opinions of the author/speakers, not the views and opinions of FOREX.com, StoneX Group Inc., or its subsidiaries. The content has not been independently reviewed by FOREX.com.
GBP/JPY: Pound Bulls Face a Shooting Star Warning
An interesting setup may be emerging on GBP/JPY, though there are some contrasting clues. The daily chart shows the British pound grinding higher against the Japanese yen with a series of higher highs and lows, although the occasional two-day pullback has seen prices slam lower. But given the recent two-day pullback has already been snapped, and Monday’s bullish bar held above the 200-day EMA, perhaps the correction is over.
The part that makes me wary is the shooting star candle on the weekly chart. A break above 214 would ease those concerns and favour bullish continuation on the daily chart. However, a break below 211.20 (near the 20-day EMA and recent swing lows) would strengthen the case for last week’s shooting star being a bearish reversal, invalidate the near-term bullish bias and bring 210 into focus for bears.
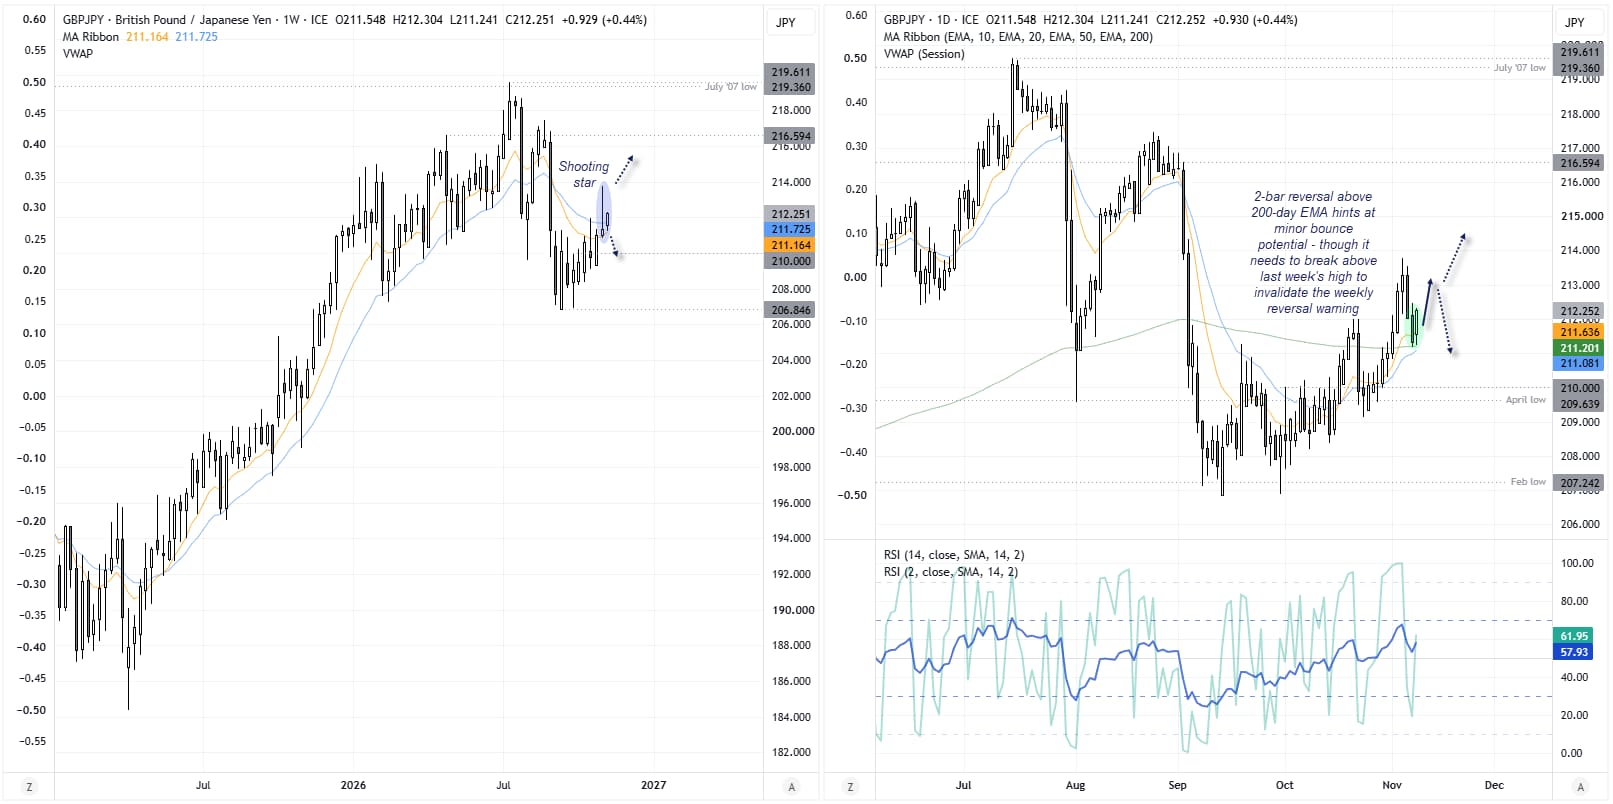
Source: ICE, TradingView
Latest market news










Web Trader platform
Our sophisticated web-based platform is packed with features.
Open an account today
Experience award-winning platforms with fast and secure execution.
Economic calendar
Related articles

USD/JPY Weekly Outlook: AI earnings could overshadow the Fed and BoJ
AI sentiment has become a major driver of US Treasury yields and USD/JPY. With Microsoft, Alphabet and Amazon reporting this week, central bank decisions may have competition for traders' attention.


Gold and S&P 500 analysis: What now after Warsh’s hawkish speech?
The dollar surged across the board after the Fed Chair Kevin Warsh surprised with a hawkish-leaning speech at the Jackson Hole summit. All the bearish dollar bets that had been accumulated since last Friday on the back of data weakness and bond market troubles had to be squared and that triggered a short squeeze rally for the dollar. Gold and silver dropped, as a result, as too did bitcoin, while US indices were giving back earlier gains.


EUR/USD forecast: All eyes on Warsh at Jackson Hole - Forex Friday
For much of this week, the EUR/USD has been edging lower with the US dollar regaining some ground after last week’s sell-off that was triggered, in part, by the bond market worries. Investors have been unwilling to bet further against the US dollar so far this week ahead of Kevin Warsh’s keynote speech at the Jackson Hole summit, due later today.