

S&P 500 forecast: Technical Tuesday | September 1, 2026
Risk appetite has been hurt today with global stocks, gold, bonds and bitcoin all falling. On the ascendency were the usual suspects: Oil and the US dollar amid further escalating tensions between the US and Iran. Stock investors are cementing hawkish Fed expectations to an extent that it is starting to hurt their appetite for risk. Also unnerving investors is the continued rise in global bond yields – which kind of goes hand in hand with oil prices.
Written by
Fawad Razaqzada
Market Analyst
Risk appetite has been hurt today with global stocks, gold, bonds and bitcoin all falling. On the ascendency were the usual suspects: Oil and the US dollar amid further escalating tensions between the US and Iran. Stock investors are cementing hawkish Fed expectations to an extent that it is starting to hurt their appetite for risk. Also unnerving investors is the continued rise in global bond yields – which kind of goes hand in hand with oil prices. Against this backdrop, the near-term risks to our S&P 500 forecast remains tilted to the downside.
Before discussing the macro risks further, let’s have a quick look at the chart of the S&P 500 first.
Technical S&P 500 forecast and key levels to watch
From a technical analysis point of view, the S&P 500 forecast is yet to turn bearish despite some not-so-strong price action in the last few days. But is it about to succumb to rising macro risks?
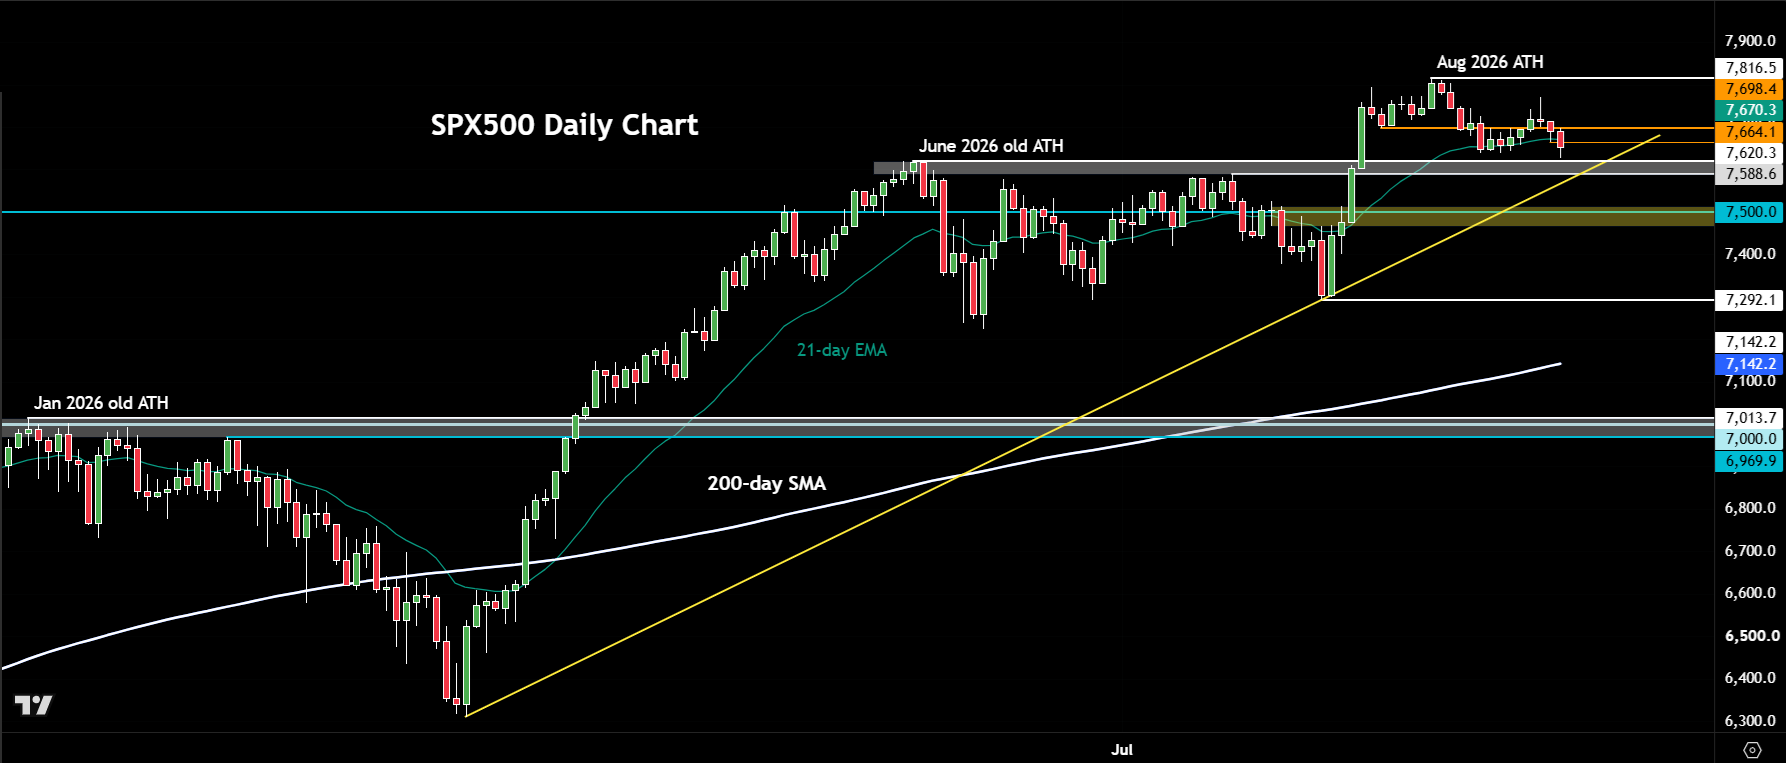
We have seen our US SP 500 index, which is derived from the underlying S&P 500 futures, make a lower high at 7771, relative to its all-time high at 7816 that was hit in mid-August. That has left traders wondering whether we will now see a proper correction.
Well, a lot now depends on the key support zone that is approaching between 7588 to 7620. Here, the index had made its previous all-time high in June, which led to a period of consolidation before the index broke out. Once resistance, will we see this zone turn into support now? If not, and we go below it, then that would be a bearish technical development. in that scenario, we could see some follow-up technical selling towards 7500 next. Below that the July low of 7292 would then come into focus.
On the upside, resistance is seen around 7664, marking Monday’s low. Above that, 7698 is the next resistance. That level held yesterday, leading to the latest drop.
For now, there are some tentative bearish signals but with the larger bullish structure still intact, it is far too early to declare the end of the bullish S&P 500 forecast from a technical analysis point of view. But that could change soon.
Rising oil prices reignite inflation worries
Higher oil prices are threatening to reignite inflation, raising the risks of righter monetary policy. Fed Chair Kevin Warsh’s hawkish Jackson Hole speech has already put a September rate hike firmly back on the table. This is reflected in the global bond markers selling off, sending yields higher across the curve.
In the US, the 10-year bond yield has climbed to a fresh 19-month high and is now only a couple of basis points below its highest level since 2007.
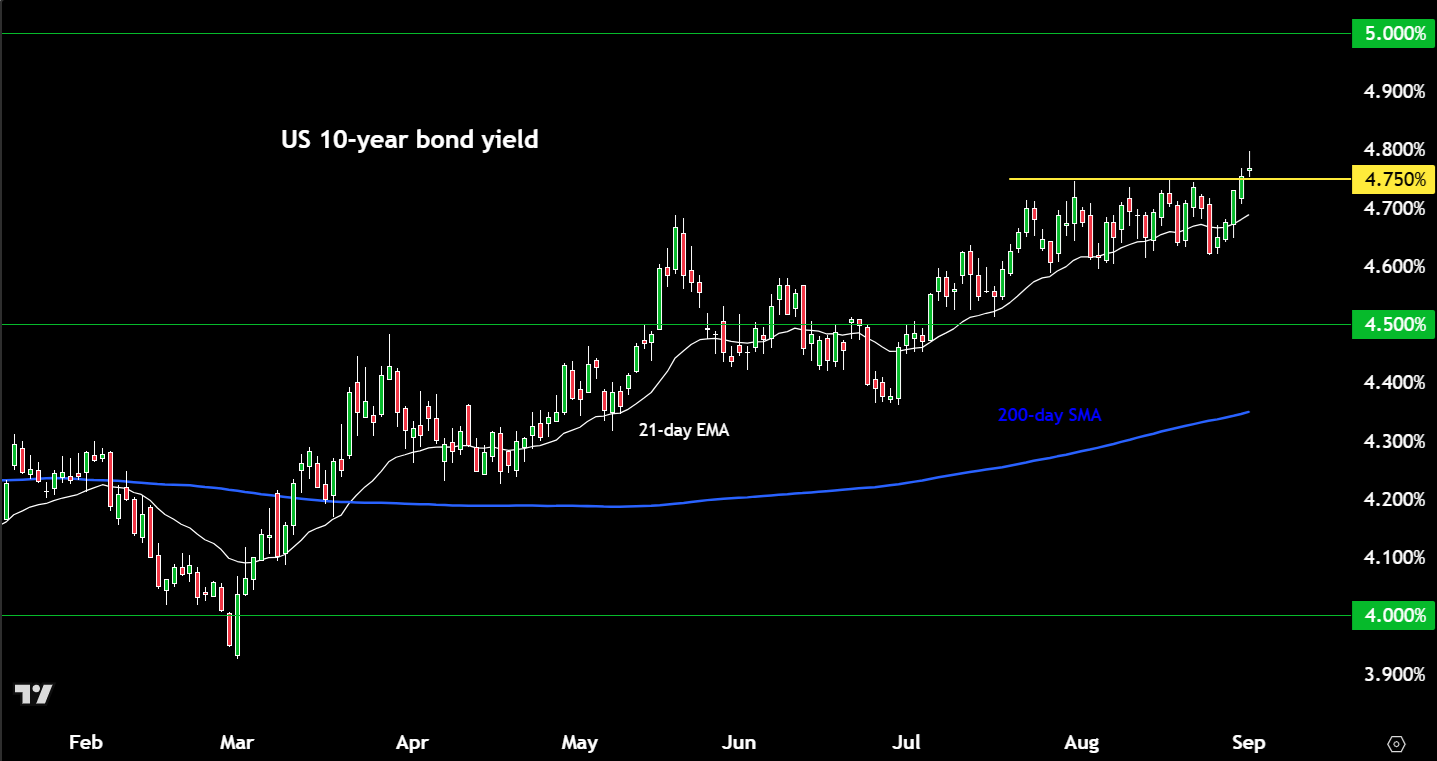
A classis ascending triangle breakout is what we have just seen. Usually, this sort of a breakout precedes further gains.
The 30-year yield has also pushed through recent highs, while Japan’s 30-year yield has broken above 4.18%, a record.
It was only two weeks ago that the US Treasury announced measures aimed at supporting the bond market, yet yields have continued to climb. The market increasingly appears willing to test the authorities’ tolerance for higher borrowing costs. With US debt now above $40tn, a sustained move in the 10-year yield towards 5% would have meaningful fiscal consequences.
With yields on the rise, this is increasing the opportunity cost of holding stocks and putting particular pressure on higher-valued, long-duration sectors such as technology.
Jobs and CPI hold the key
The question now is whether incoming US data can further cement expectations of a September rate hike. Markets have one more payrolls report, due on Friday, and one more CPI release, due next week, before the September 16 FOMC meeting, alongside several secondary indicators this week.
The payrolls report on Friday will be particularly important. With the Fed increasingly data dependent, the market is likely to react sharply to any meaningful surprise. Ahead of that, the focus will be on oil prices and bond markets for fresh signals. Any further gains in either of those markets could weigh on equity markets.
-- Written by Fawad Razaqzada, Market Analyst
Follow Fawad on Twitter @Trader_F_R
Latest market news









Web Trader platform
Our sophisticated web-based platform is packed with features.
Open an account today
Experience award-winning platforms with fast and secure execution.
Economic calendar
Related articles

EUR/USD, AUD/USD, Gold Weekly Technical Outlook 8 31 2026
Sr. Technical Strategist Michael Boutros highlights the levels that matter on the Euro, Aussie and Gold this week.


Canadian Dollar Forecast: USD/CAD Weekly Reversal Puts Yearly Uptrend Back in Focus 8 29 2026
USD/CAD has staged its strongest weekly advance since June, shifting the focus to whether a more durable low is finally taking shape.

USD/JPY weekly outlook: Payrolls may challenge the Fed’s hawkish reset
USD/JPY has finally woken from its slumber. Payrolls now loom as the key test of whether the latest hawkish repricing sticks or sinks.
