

US Dollar Price Action Setups: USD/JPY, EUR/USD, GBP/USD, AUD/USD, Gold
It was a quiet week in the US Dollar despite a busy economic calendar and a soft raft of US data, but perhaps more important is what didn’t happen and what this says about what could be around the next corner.
Written by
James Stanley
Sr. Strategist
US Dollar Talking Points:
- CPI, PPI and Retail Sales all came in soft for the US and odds for a September rate hike slid from a coin flip down to 30% by the end of the week.
- Offsetting some of that data was a series of hawkish Fed comments including Beth Hammack saying that she thought rates should be raised right now, despite the fact that she did not vote for a rate hike two months ago when CPI was at 4.2% against this week’s 3.4% reading.
- Perhaps more pertinent to US Dollar price action is the larger USD/JPY carry trade, which has so far held up as buyers have jumped on pullbacks and tests of support.
If you were to solely look at the US Dollar weekly chart you might think that nothing really happened this week, as the currency is working on a gravestone doji-like formation highlighting continued indecision, with sellers seemingly disinterested in pushing a downside break of last week’s low. But, really, there were several drivers on the matter from the Wednesday release of CPI and the Thursday release of PPI to go along with the Friday drop of Retail Sales and U of M Consumer Sentiment.
And while each of those data points matter in the grand scheme, it was perhaps what didn’t happen even in light of all of those data points that looms largest as we wind into the end of the week.
The USD/JPY carry trade remains a crowded backdrop. And like we saw on NFP last Friday, the whiff of weakness in the US could compel greater unwind of that trade after the dual intervention that showed up two weeks ago.
And there was even hints of that this week, as CPI or PPI or Retail Sales produced pullbacks that, so far, have been an open door for bulls to add positions. I had looked into the matter previously and given where we’re at, it seems that US data is going to be the most important push point to the matter. Even circulating rumors of a Japanese rate hike in September did little to excite carry unwind themes, and I’ll look at that in greater detail below.
USD/JPY Hourly Chart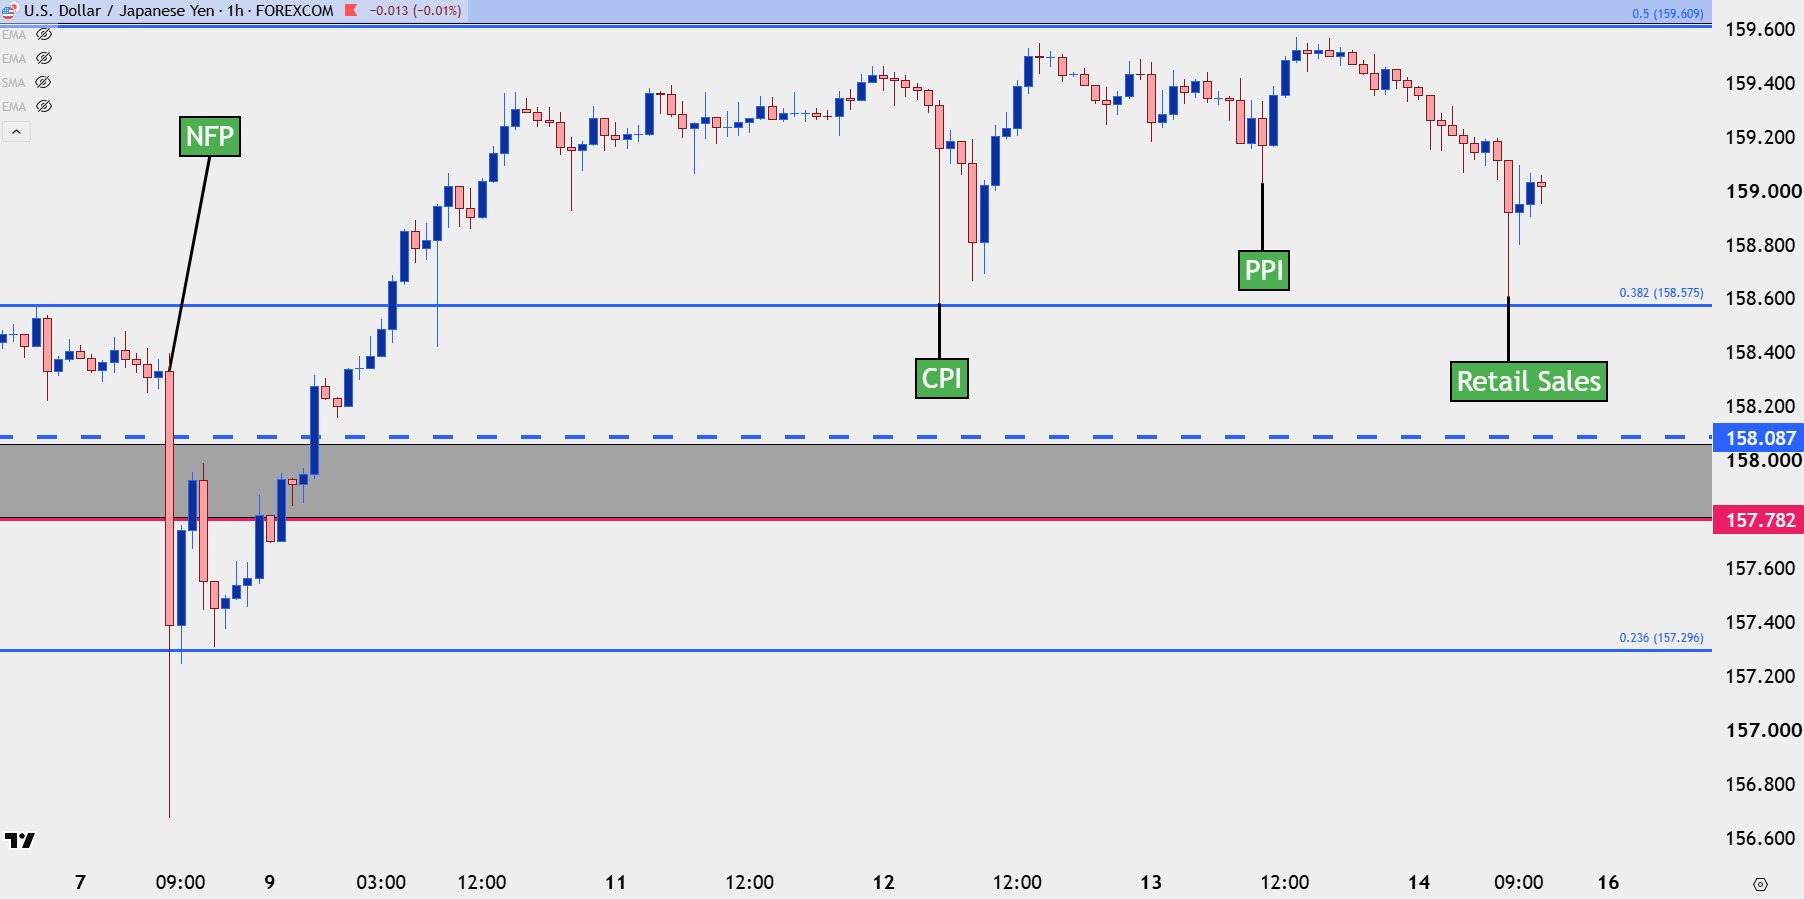
Chart prepared by James Stanley; data derived from Tradingview
USD
The DXY basket had a quick flare of strength up to the 100 handle but that’s about where buyers were stalled out, and as we wind into the end of the week, it’s the same support around 99.50 that’s in-play.
I remain of the mind that the USD will largely be driven by USD/JPY flows and that’s one reason why I think bearish stances in the greenback are perhaps most attractive in the near-term. But, the other reason aligns with what’s showing in price action behind other major pairs that I’ll look at below.
For USD-strength to take hold and for buyers to challenge prior resistance, it seems as though we’ll need USD/JPY to charge back above 160.00 and make a run at the prior highs of 164. That would mean that the dual intervention and the efforts from both the Bank of Japan and the US Treasury Department will have failed, and that seems a difficult scenario to incorporate as a base case at this point.
US Dollar Weekly Price Chart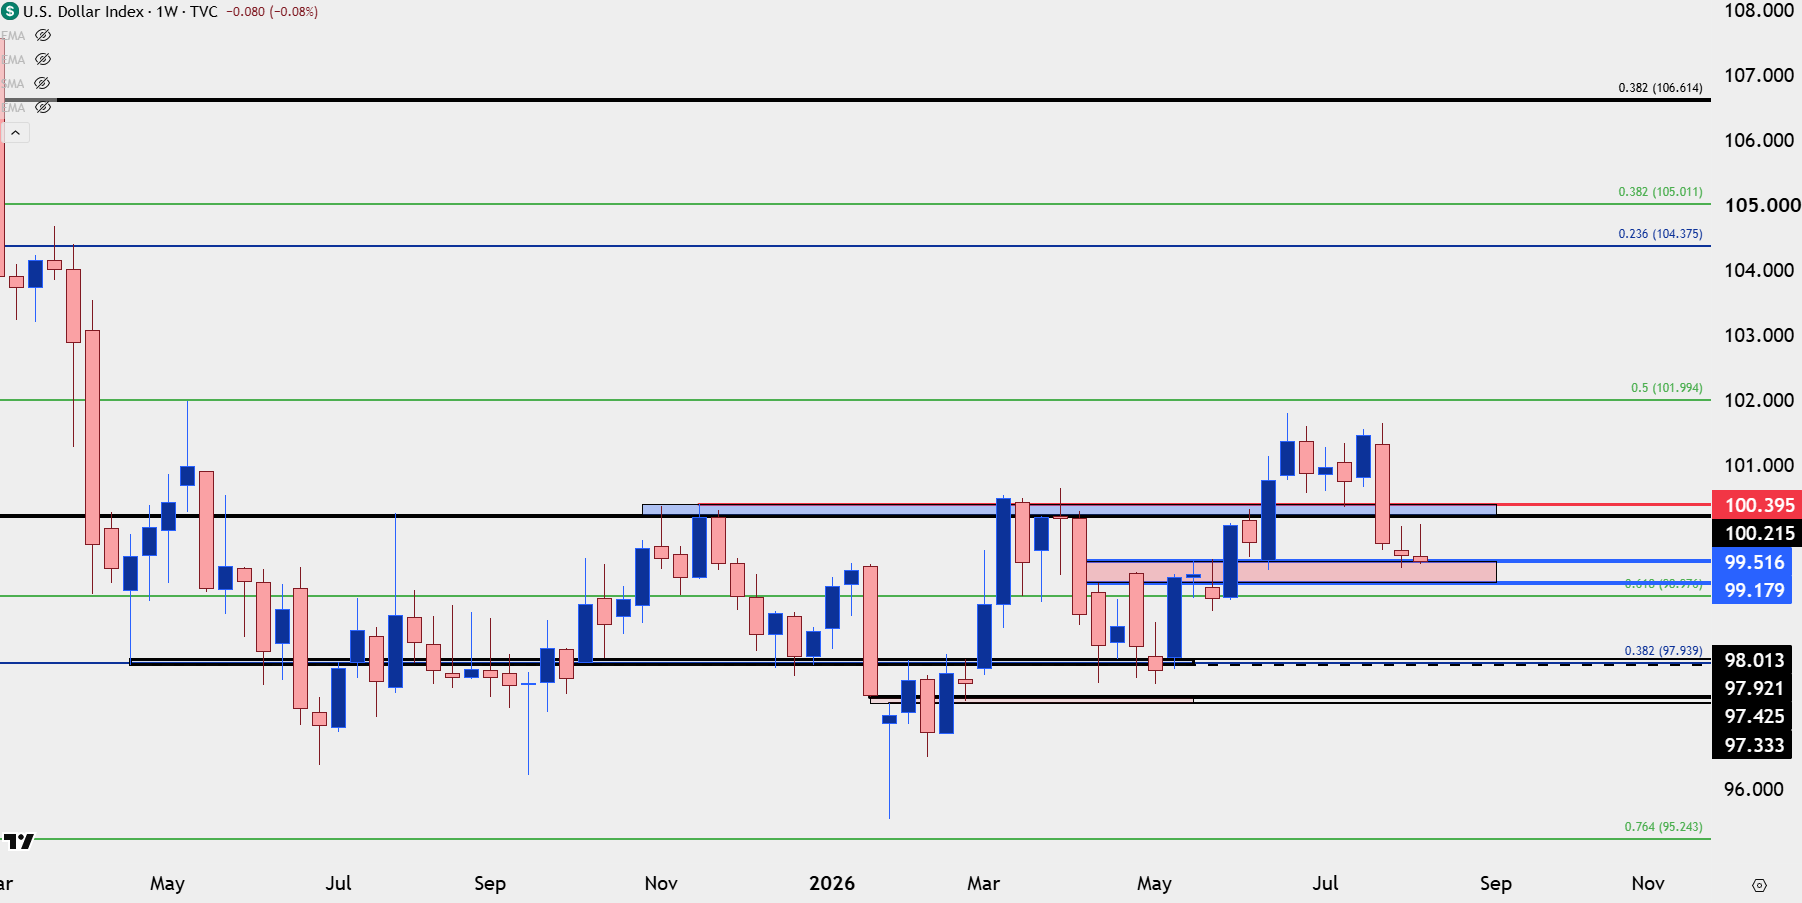
Chart prepared by James Stanley; data derived from Tradingview
USD/JPY
This is still the big one and I think the major takeaway from this week is just how observant market participants have been to this shift at the Fed. For a bank that shied away from tightening when inflation was higher in 2021 and moved into rate cuts even as inflation was above target in 2024 and 2025, they sure do seem concerned about CPI today.
Despite softening in both CPI and PPI this week, rates markets are still harboring the expectation that the Fed will hike into the end of the year, and this serves to not only keep the carry on the long side of the pair, it tamps down fear from longs that an inevitable shift may be on the horizon.
On the other side of the pair, circulating rumors that the Bank of Japan will be hiking rates in September seemed to do little, and this is understandable if we look at the inflation picture for Japan which most recently saw headline inflation come in at 1.7%. The BoJ has the same 2% inflation target as of the US so, while the US has been holding rates as CPI crested above 4% and remains above 3%, the BoJ is now talking up hikes despite the fact that their mandate hasn’t even been met.
This is clearly in response to Scott Bessent’s comments that the only way to fix the issue was for Japan to hike rates, but markets seem unconvinced and I think the below chart illustrates as to why.
From a price action perspective, USD/JPY looks like a market that wants to test a breakout given the elongated underside wicks, which illustrate increasing aggression from buyers to pullbacks. This, of course, sets the stage for a 160 test but it’s the spot above that, around 160.60, which really stands out for resistance potential if we do get a test above the big figure for next week.
USD/JPY Daily Price Chart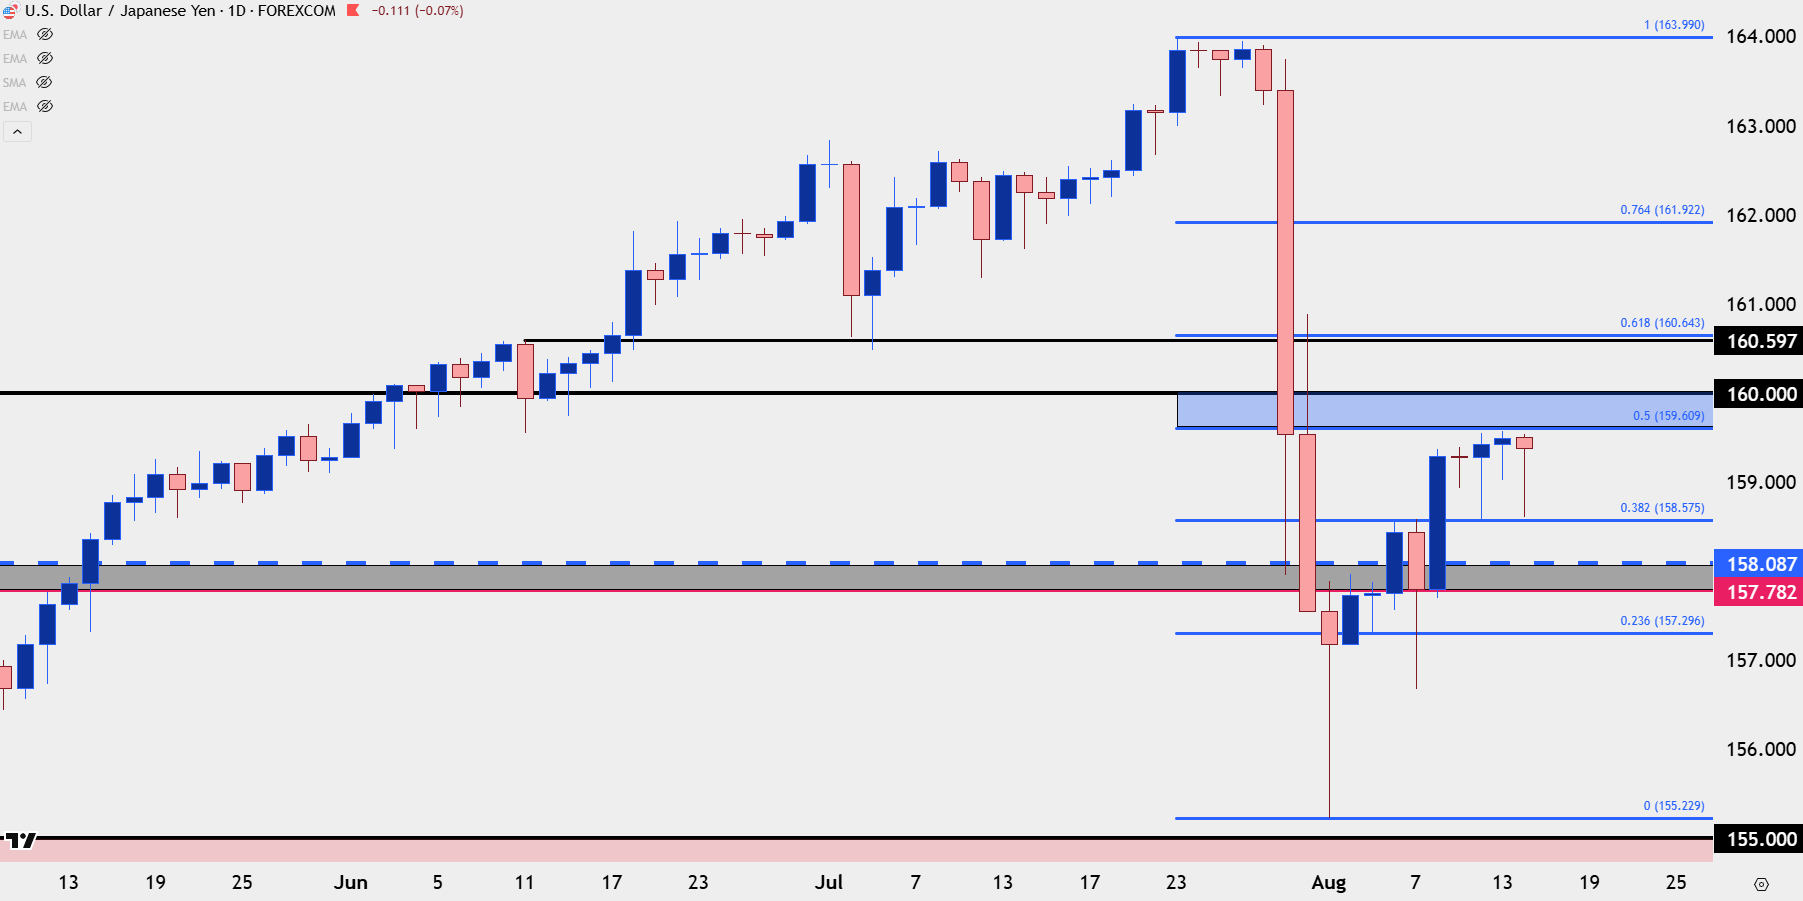
Chart prepared by James Stanley; data derived from Tradingview
EUR/USD
Given the fireworks elsewhere EUR/USD has been rather quiet. But – it has continued to observe support and resistance structure so despite the lacking volatility there have been clean moves on either side of the EUR/USD market.
Last Friday saw resistance at a familiar spot of 1.1576. This week saw support at a familiar spot of 1.1515. And then again on Friday, the pair tested a fresh high while holding at resistance of 1.1576.
For this to breakout it would seem that a larger sell-off in USD/JPY would be needed and like we saw two weeks ago, there’s certainly the possibility where a breakdown of the Yen carry trade could drive USD-weakness elsewhere. After all, that’s what pushed EUR/USD above 1.1500. So, if we do see USD/JPY test 160 next week that opens the door for support potential in EUR/USD.
EUR/USD Daily Price Chart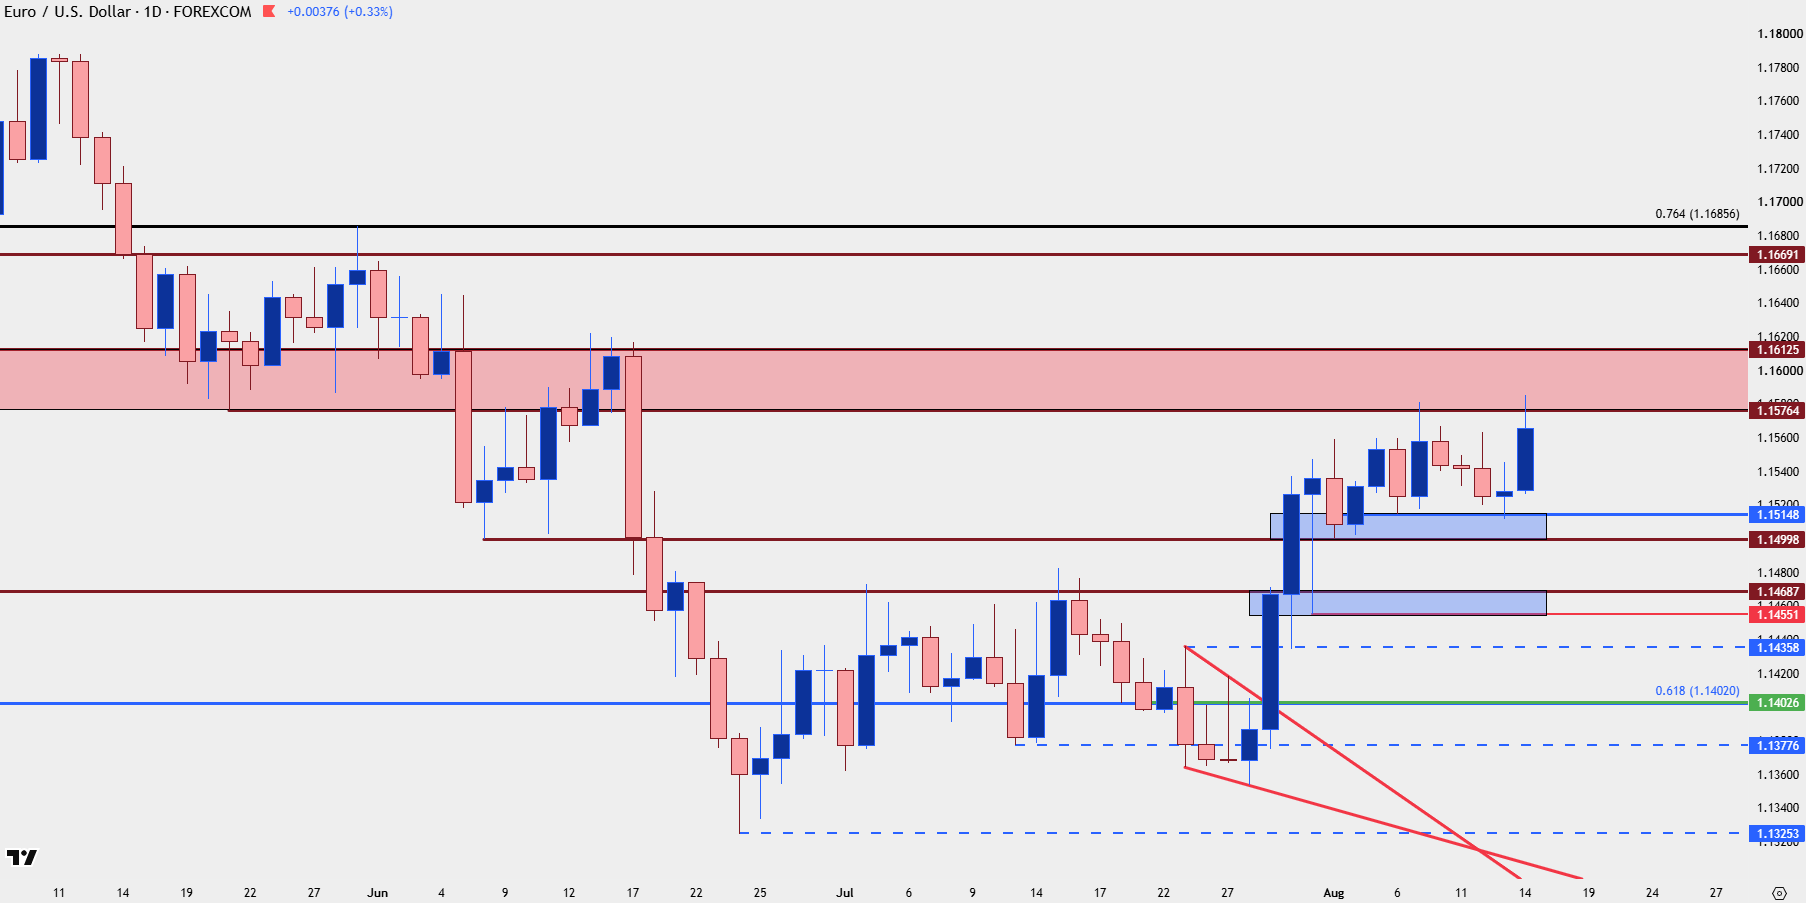
Chart prepared by James Stanley; data derived from Tradingview
GBP/USD
Earlier in the week I looked at GBP/USD as a potentially more attractive USD-weakness setup, and I think there’s something to that as we wind into the end of the week. The pair was showing an ascending triangle a few days ago and bulls have responded by pushing up to fresh highs, and it’s the higher-lows that stand out for bullish continuation strategies.
For next week, it’s the 1.3500 level that now presents as support potential. Bulls have been getting more and more comfortable above the big figure and the past week’s support came in just below that, so if the next iteration of support can show at or around the big figure, it can be seen as another higher-low with an open door to test for fresh highs beyond the 1.3558 level.
GBP/USD Daily Price Chart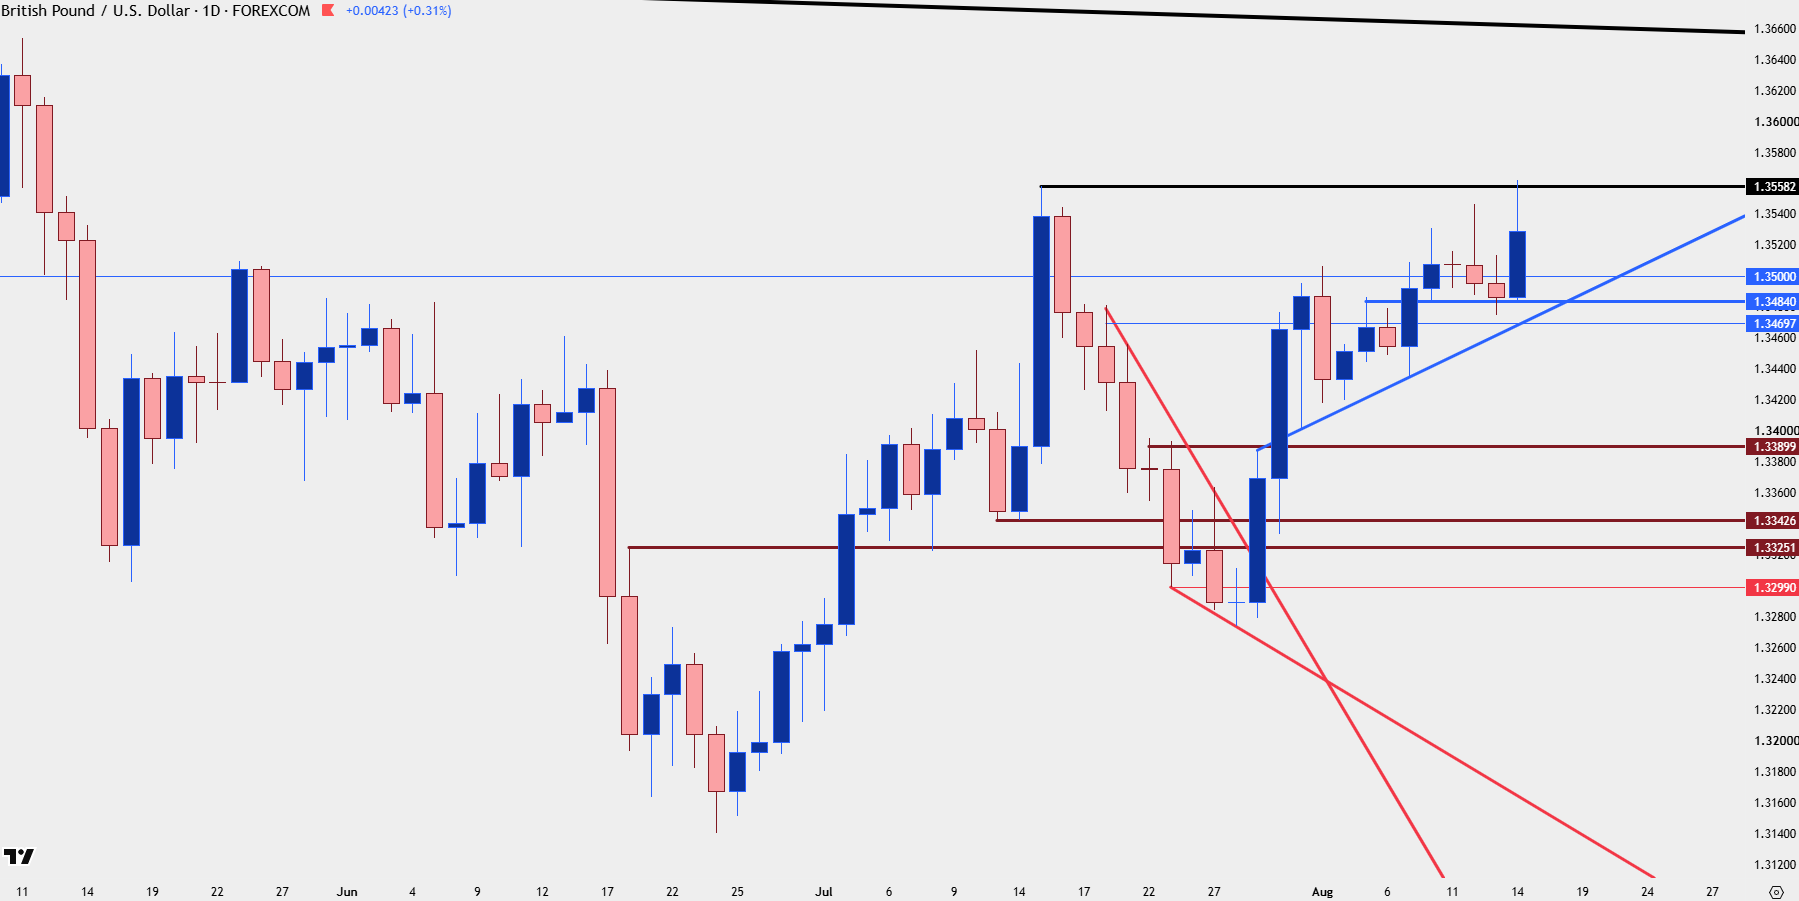
Chart prepared by James Stanley; data derived from Tradingview
AUD/USD
AUD/USD was another pair looked at earlier in the week, as a big resistance zone was back in-play ahead of an RBA rate decision. While the pair has technically set a fresh two month high buyers haven’t exactly been able to break away at this point, owed in part to that USD support and the USD/JPY rally into the end of the week.
But – given the higher-lows that have posted this remains another market of interest for next week particularly for USD-weakness strategies.
And for those that do want to look for shorter-term USD strength, the resistance zone in-play could remain of interest and on Wednesday I looked at how short-term reversals can be approached even against the larger backdrop of a bullish trend.
AUD/USD Daily Chart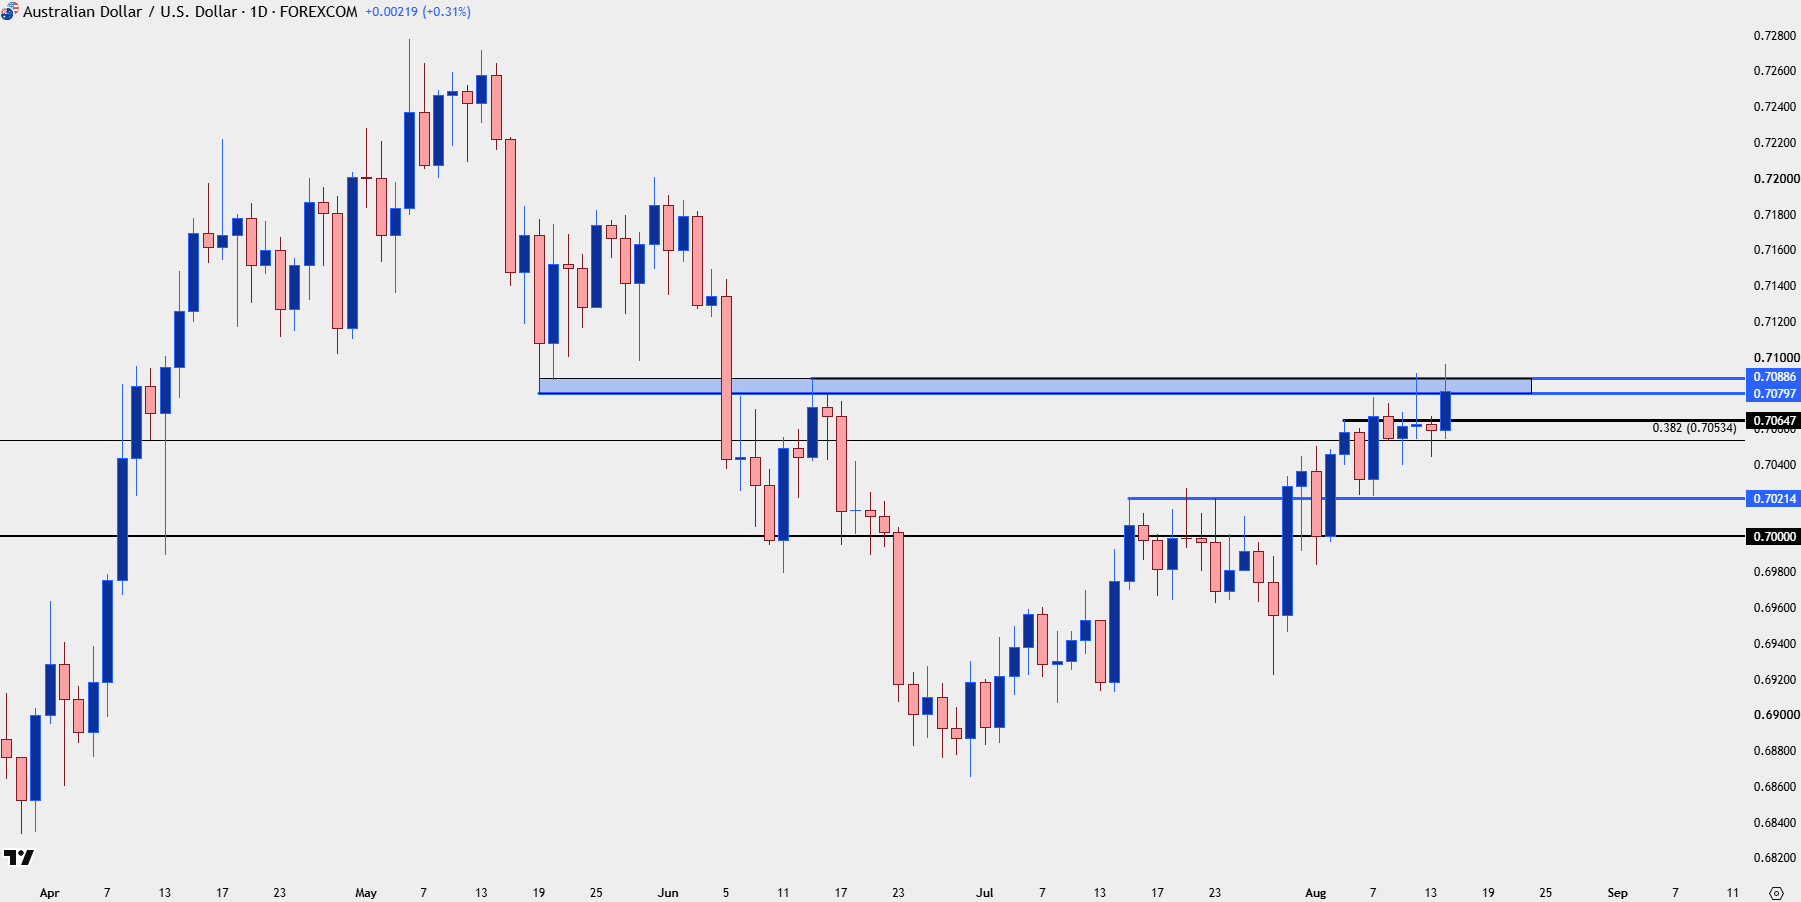
Chart prepared by James Stanley; data derived from Tradingview
Gold (XAU/USD)
I wanted to include gold this week because of all the macro markets that I follow, this is the one with the greatest trend potential. And as I’ve said a few times before, I think gold has an interesting way of trying to look around that next corner.
When we had the FOMC rate decision and the BoJ intervention two weeks ago, the fundamental backdrop was setting up for strength in gold. That showed up a week later with an aggressive breakout, following months of support at or around the $4k marker. And over the past week, despite a clear backdrop for bulls to take profits, gold held higher-low support above the $4300 level and as we go into next week, they retain a bit of control on the matter.
Gold Daily Price Chart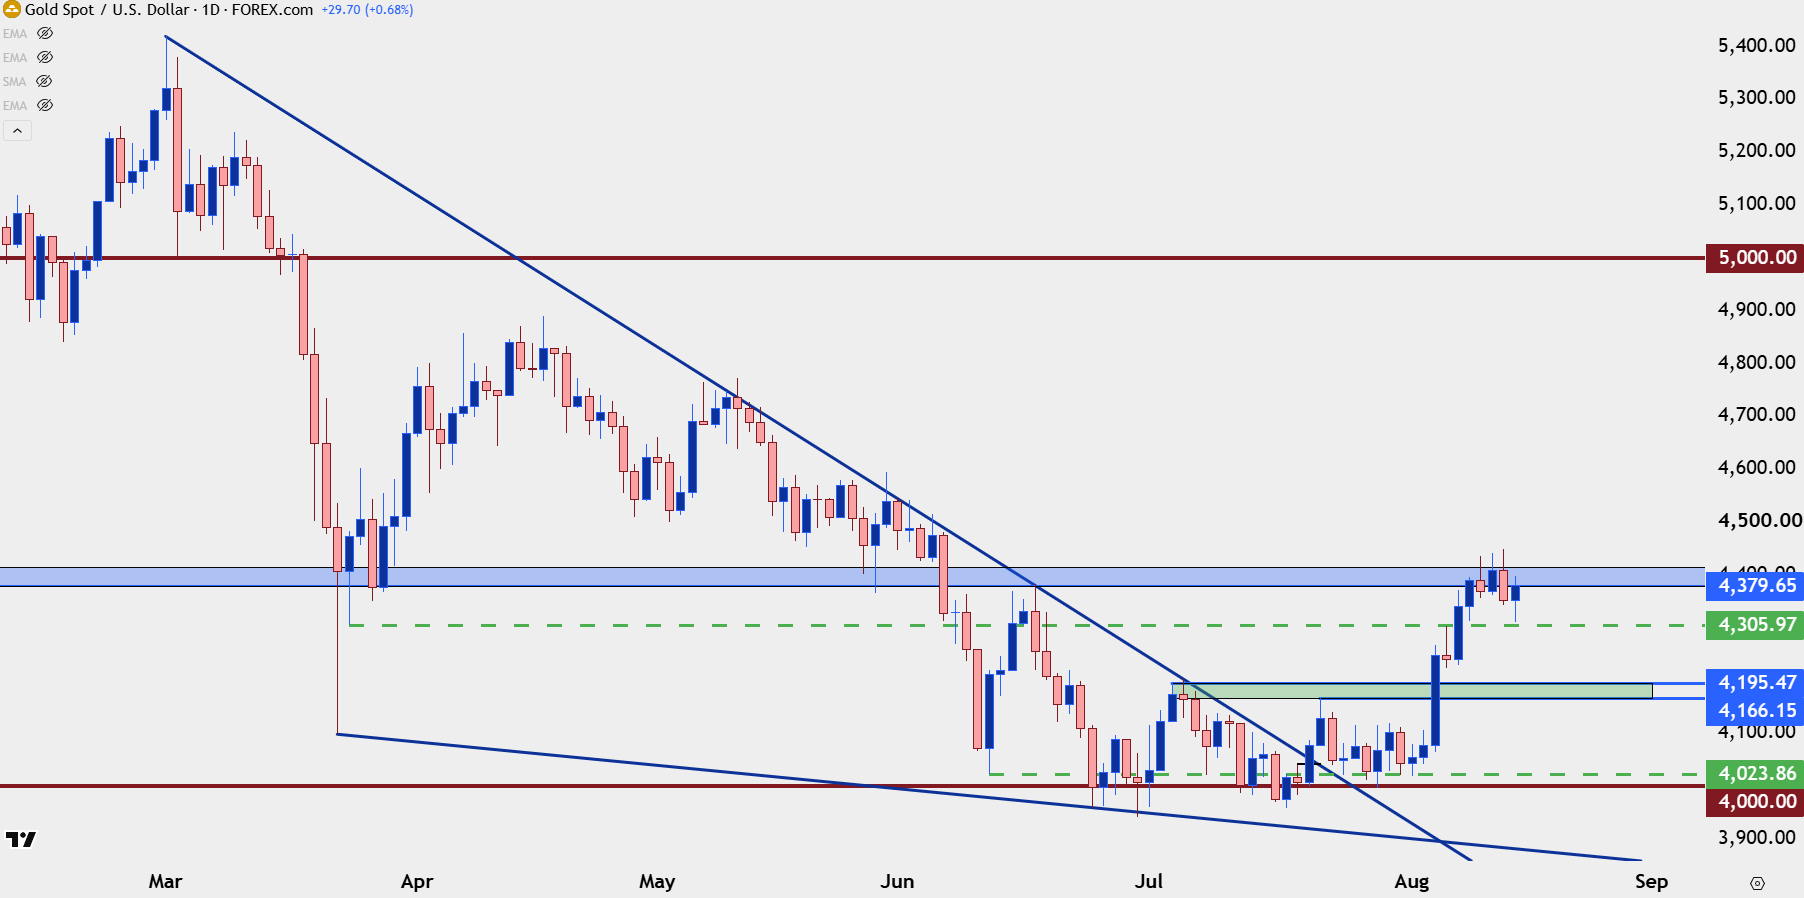
Chart prepared by James Stanley; data derived from Tradingview
--- written by James Stanley, Senior Market Analyst, Global Macro







Web Trader platform
Our sophisticated web-based platform is packed with features.
Open an account today
Experience award-winning platforms with fast and secure execution.
Economic calendar
Related articles

Euro Short-term Outlook: EUR/USD Pullback Nears Pivotal Uptrend Support 8 28 2026
Warsh's comments accelerated the EUR/USD selloff, raising the stakes as buyers look to stabilize the broader recovery.


Gold and S&P 500 analysis: What now after Warsh’s hawkish speech?
The dollar surged across the board after the Fed Chair Kevin Warsh surprised with a hawkish-leaning speech at the Jackson Hole summit. All the bearish dollar bets that had been accumulated since last Friday on the back of data weakness and bond market troubles had to be squared and that triggered a short squeeze rally for the dollar. Gold and silver dropped, as a result, as too did bitcoin, while US indices were giving back earlier gains.


Nasdaq 100 Forecast: NDX slips ahead of Fed Chair Warsh’s speech
U.S. stocks are edging lower on Friday, giving back some of yesterday's gains after Nvidia's strong outlook revived the tech trade. The focus has now shifted firmly to Fed Chair Kevin Warsh's Jackson Hole speech, with investors looking for more clarity on the outlook for interest rates.
