


US Dollar Short-term Outlook: USD Four-Week Rally Stalls Below Key Resistance 10 8 2026
DXY is holding in a tight range beneath major resistance as traders await the next catalyst from inflation expectations and Fed repricing.
Written by
Michael Boutros
Sr. Technical Strategist
US Dollar Index Technical Outlook: USD Short-term Trade Levels
- DXY remains constructive after recovering sharply from the September low, but momentum has become increasingly stretched.
- The weekly opening range is holding just beneath a major technical ceiling, keeping the immediate focus on a breakout for directional guidance.
- A sustained push higher would strengthen the continuation case and expose additional resistance into the October trade.
- A break back below near-term support would raise the risk for a broader pullback before the larger advance can resume.
- Friday’s Michigan survey offers the next near-term catalyst, with particular attention on inflation expectations. CPI on tap next week.
- DXY Resistance 102.42 (key), 102.95/99, 103.49- Support 101.77/92 (key), 101.39, 101.02
The U.S. Dollar has shifted into consolidation after a strong September recovery, leaving buyers and sellers locked in a narrow battle just beneath a major technical ceiling. The immediate question is whether momentum can translate into a clean breakout or whether increasingly stretched conditions begin to force a deeper retracement. With the calendar relatively light into Friday, attention turns to the University of Michigan inflation-expectations component before next week’s CPI report takes center stage. A hotter inflation print could revive expectations for near-term Fed tightening, while another soft reading would reinforce the case for patience and potentially cap the greenback’s upside. Battle lines drawn on the DXY short-term technical charts.
US Dollar Index Price Chart – USD Daily
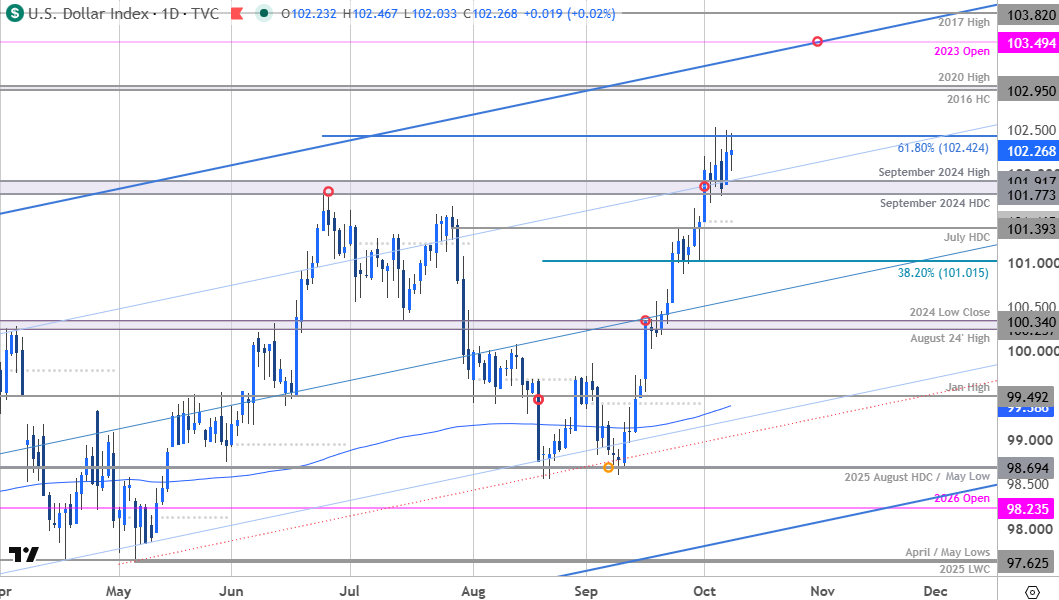
Chart Prepared by Michael Boutros, Sr. Technical Strategist; DXY on TradingView
Technical Outlook: In last month’s US Dollar Short-term Outlook we noted that DXY was approaching major technical support near the August lows and that, “From a trading standpoint, rallies would need to be limited to 99.49 IF price is heading lower on this stretch with a close below 98.68 needed to fuel the next leg of the decline.” The index registered an intraday low at 98.60 four-days later before rebounding sharply with a four-week rally extending nearly 4% off the September low.
The rally was halted this week at the 61.8% extension of the January advance at 102.42 with the weekly opening range taking shape just below. Daily RSI has remained in overbought territory since late-September and keeps the momentum profile in favor of the bulls for now, but price will need to mark a daily close above this pivot zone to fuel the next major leg of the advance.
US Dollar Index Price Chart – USD 240min
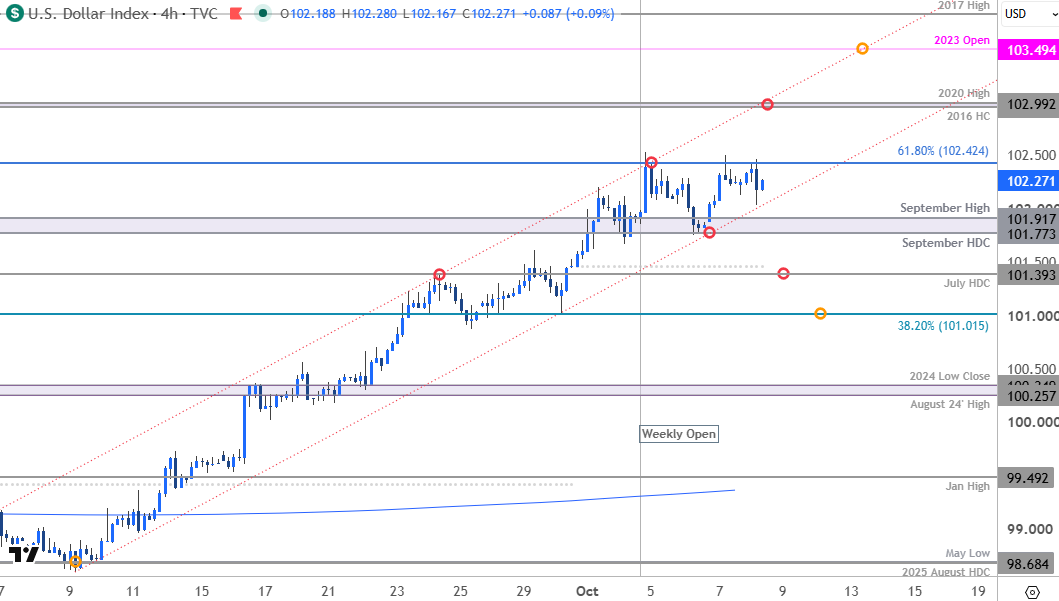
Chart Prepared by Michael Boutros, Sr. Technical Strategist; DXY on TradingView
Notes: A closer look at USD price action shows DXY trading within the confines of a narrow channel extending off the September low with the weekly range is set just above support at the September high-day close (HDC) / high at 101.77/92. A break / daily close below this threshold would threaten a larger pullback in the index with subsequent support seen at the July HDC and the October open at 101.39/46 and the 38.2% retracement of the August advance at 101.02. Both levels represent areas of interest for possible downside exhaustion / price inflection – look for a larger reaction there IF reached.
A topside breach / daily close above 102.42 is needed to mark uptrend resumption towards the 2016 high close (HC) and the 2020 high at 102.95/99. Subsequent resistance objectives are eyed at the 2023 yearly open at 103.49 and the 2017 swing high at 103.82.
Bottom line: The U.S. Dollar rally has extended into technical resistance with the weekly range intact just below. While the broader outlook remains constructive, the advance may be vulnerable below this level, and the immediate focus is on a breakout of this range for guidance. From a trading standpoint, losses would need to be limited to 101.77 IF price is heading higher on this stretch with a close above 102.42 needed to fuel the next leg higher in price.
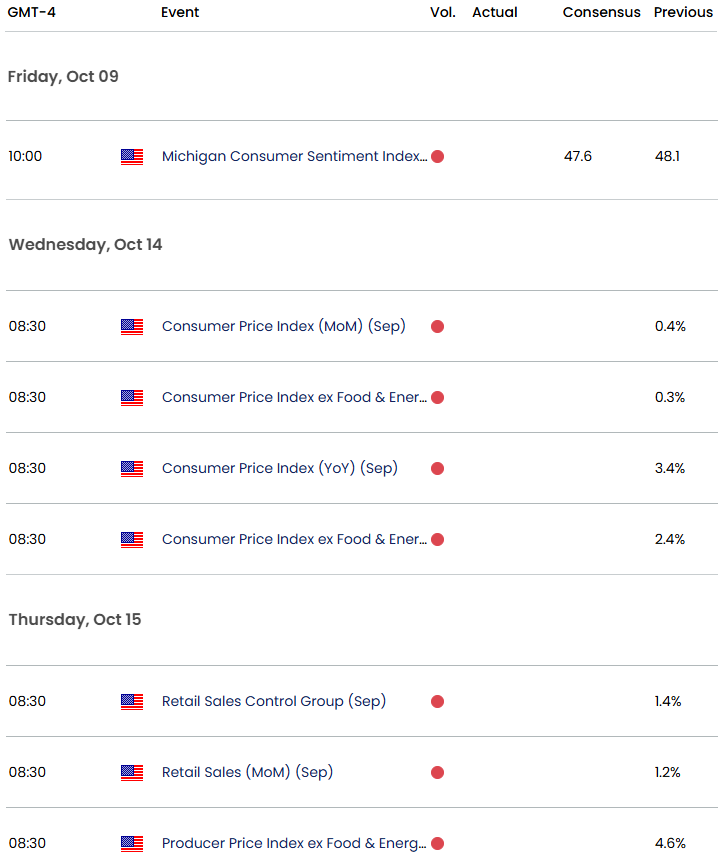
The economic calendar remains relatively light into the close of the week, with Friday’s University of Michigan Consumer Sentiment survey offering the next potential catalyst for the U.S. dollar. Traders will be focused on the inflation expectations component as markets assess whether price pressures are becoming more entrenched. The focus then shifts to next week’s September Consumer Price Index (CPI) report, which could prove critical in shaping the Fed’s policy outlook. Expectations for an October rate hike have now fallen below 20%, although markets continue to price more than an 85% probability of at least one additional increase before year-end. With recent inflation readings coming in softer than expected, a hotter CPI print could revive expectations for near-term tightening and fuel renewed dollar strength. Conversely, further evidence of moderating price pressures could reinforce expectations for a more patient Fed and limit the greenback’s upside potential. Stay nimble into the releases and watch the weekly close for guidance. Review my latest US Dollar Weekly Forecast for a closer look at the longer-term DXY technical trade levels.
Key US Economic Data Releases
Written by Michael Boutros, Senior Technical Strategist
Follow Michael on X @MBForex
Related tags:
Latest market news











Web Trader platform
Our sophisticated web-based platform is packed with features.
Open an account today
Experience award-winning platforms with fast and secure execution.
Economic calendar
Related articles

Nasdaq 100 Forecast: NDX slips ahead of Fed Chair Warsh’s speech
U.S. stocks are edging lower on Friday, giving back some of yesterday's gains after Nvidia's strong outlook revived the tech trade. The focus has now shifted firmly to Fed Chair Kevin Warsh's Jackson Hole speech, with investors looking for more clarity on the outlook for interest rates.


EUR/USD forecast: All eyes on Warsh at Jackson Hole - Forex Friday
For much of this week, the EUR/USD has been edging lower with the US dollar regaining some ground after last week’s sell-off that was triggered, in part, by the bond market worries. Investors have been unwilling to bet further against the US dollar so far this week ahead of Kevin Warsh’s keynote speech at the Jackson Hole summit, due later today.


Bitcoin Forecast: BTC/USD Back to $80K Ahead of Warsh’s Jackson Hole Speech
After surging over $15,000 in the past 10 days alone, there is risk of a near-term pullback if Warsh says anything remotely hawkish at Jackson Hole - what are the levels to watch from here?
