


Australian Dollar Forecast: AUD/USD Breaks Multi-Month Range, Hits 10-Month Low
Aussie bears are closing in on major technical support, with next week's Australian employment data raising the stakes for a pivotal reaction.
Written by
Michael Boutros
Sr. Technical Strategist
Australian Technical Forecast: AUD/USD Weekly Trade Levels
- AUD/USD fell for a fourth consecutive session on Friday, extending its weekly losing streak to three as weekly momentum dropped to its lowest level since April 2025.
- The break below the broader consolidation has shifted the technical outlook lower, with sellers now approaching a major support confluence.
- A decisive weekly close below this threshold would strengthen the bearish outlook and expose further downside objectives.
- Former support now defines initial resistance, with a sustained recovery above the September downtrend needed to suggest a more significant low is developing.
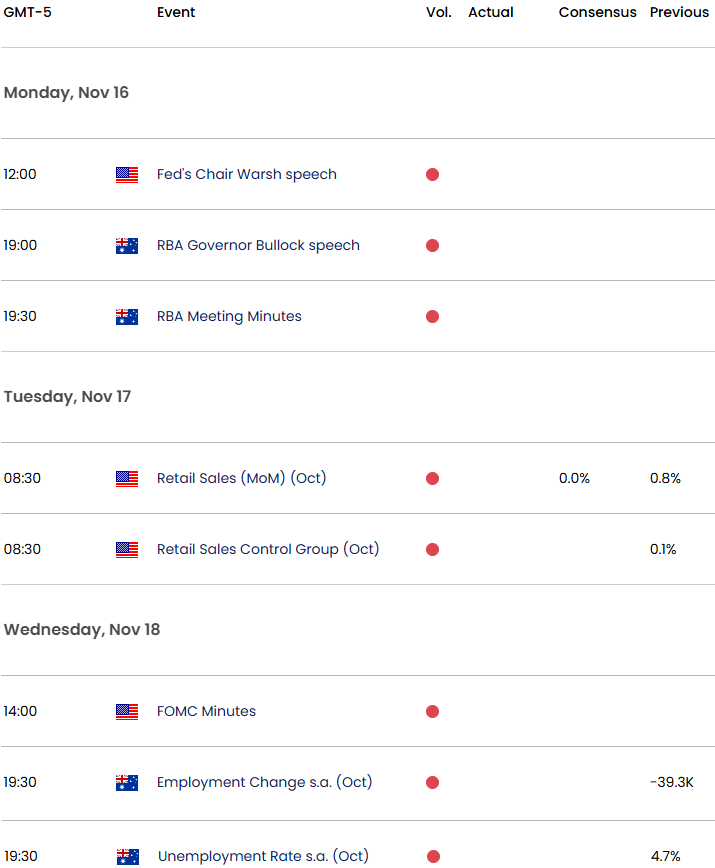
- Next week's RBA minutes and Australian employment report headline event risk, alongside U.S. retail sales and FOMC minutes.
- Resistance 6890/94, 6938/46 (key), 7032 - Support 6724/57 (key), 6674, 6596
The Australian Dollar enters mid-November under mounting selling pressure after the October recovery failed to gain traction, leaving AUD/USD increasingly vulnerable to a deeper correction. The latest decline has extended more than 6.4% off the September high and materially weakened the medium-term technical structure. Sellers are now approaching a significant support confluence where the immediate move lower could encounter renewed opposition. While the broader outlook continues to favor the bears, the proximity of this threshold raises the prospect of a near-term exhaustion low and potential recovery attempt. The next reaction will be particularly important in determining whether the recent technical deterioration develops into a more sustained decline toward year-end. Battle lines drawn on the AUD/USD weekly technical chart.
Australian Dollar Price Chart – AUD/USD Weekly
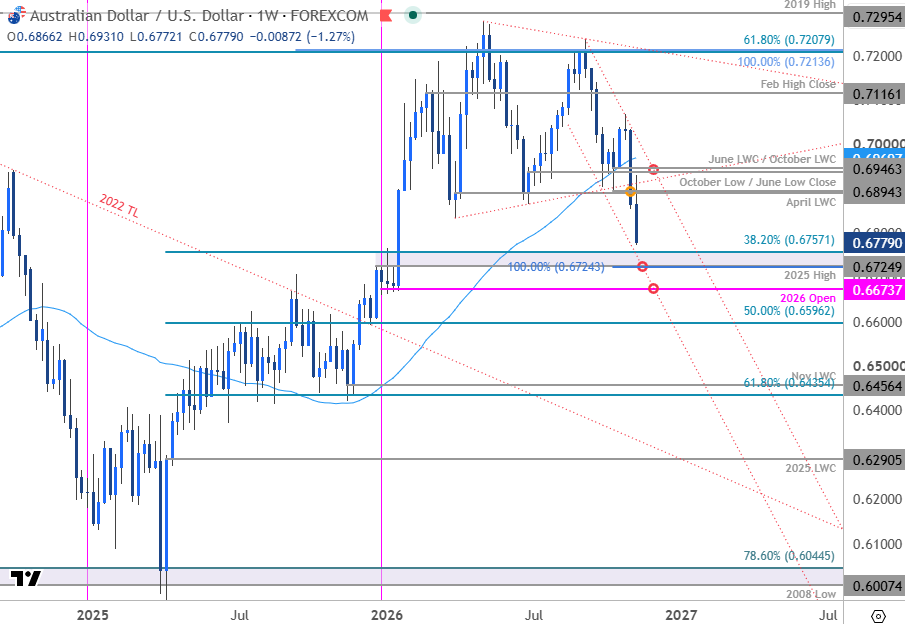
Chart Prepared by Michael Boutros, Sr. Technical Strategist; AUD/USD on TradingView
Technical Outlook: In last month’s Australian Dollar Forecast we noted that, AUD/USD had “rebounded off confluent support near the lower bounds of a multi-month consolidation pattern. From a trading standpoint, losses would need to be limited to 6938 IF price is heading higher on this stretch with a close above 7025 needed to keep the immediate recovery viable heading into the close of the month.” The recovery extended more than 2.5% off the October low and despite registering a close high at 7034, the bulls were unable to sustain the advance with the subsequent reversal posting a third consecutive weekly decline. Weekly RSI has now fallen to the lowest level since April 2025 and keeps the momentum profile in favor of the bears for now.
A decline of more than 4.1% from the October high has now broken below a multi-month consolidation structure with the bears now approaching a major technical confluence at 6725/57. This region is defined by the 100% extension of the September decline, the 2025 swing high, and the 38.2% retracement of the 2025 advance. Channel support converges on this threshold over the next few weeks. A break / weekly close below this pivot zone would be needed to fuel the next leg lower with subsequent support objectives seen at the 2026 yearly open at 6674 and the 50% retracement at 6596.
Weekly resistance is now eyed back at 6890/94- a region defined by the April low-week close, the October low, and the June low close. Key resistance / bearish invalidation is now lowered to the June / October low-week closes (LWC) at 6938/46. Note that the September trendline converges on this level into the open of December and a breach / weekly close above would be needed to suggest a more significant low is in place, and a larger reversal is underway. Subsequent resistance objectives eyed at the 200-day moving average (currently ~6970) and the October high-week close at 7032.
Bottom line: AUD/USD has broken a multi-month consolidation pattern with price falling to the lowest level since late-January. From a trading standpoint, rallies would need to be limited to 6894 IF price is heading lower on this stretch – look for a larger reaction on a test of the 6725/57 support zone with a weekly close below needed to fuel the next major leg of the decline.
AUD/USD event risk next week will center on the RBA minutes Tuesday and Australia’s October employment report Thursday. The minutes will offer further insight into the RBA’s recent 25-basis-point hike and the removal of its explicit tightening bias, while the labor data will test whether the Bank can justify keeping policy restrictive as the pair trades near a 10-month low. Strong employment data could challenge expectations that the November hike marked the end of the tightening cycle and help AUD/USD stabilize. U.S. retail sales and the FOMC minutes add dollar-side risk, with firm U.S. activity or a hawkish Fed read likely to keep pressure on the pair. Stay nimble into the releases and watch the weekly closes for guidance. Review my latest Australian Dollar Short-term Outlook for a closer look at the near-term AUD/USD technical trade levels.
Australia / US Economic Calendar
--- Written by Michael Boutros, Senior Technical Strategist
Follow Michael on X @MBForex
Latest market news











Web Trader platform
Our sophisticated web-based platform is packed with features.
Open an account today
Experience award-winning platforms with fast and secure execution.
Economic calendar
Related articles

USD/JPY Weekly Outlook: AI earnings could overshadow the Fed and BoJ
AI sentiment has become a major driver of US Treasury yields and USD/JPY. With Microsoft, Alphabet and Amazon reporting this week, central bank decisions may have competition for traders' attention.


EUR/USD forecast: All eyes on Warsh at Jackson Hole - Forex Friday
For much of this week, the EUR/USD has been edging lower with the US dollar regaining some ground after last week’s sell-off that was triggered, in part, by the bond market worries. Investors have been unwilling to bet further against the US dollar so far this week ahead of Kevin Warsh’s keynote speech at the Jackson Hole summit, due later today.


Bitcoin Forecast: BTC/USD Back to $80K Ahead of Warsh’s Jackson Hole Speech
After surging over $15,000 in the past 10 days alone, there is risk of a near-term pullback if Warsh says anything remotely hawkish at Jackson Hole - what are the levels to watch from here?
