

Gold Bounces from $4k – Are Bears Finished?
Gold has so far bounced from the $4k level following last week’s sell-off but whether a low is in-place will highly depend on how the Central Bank meetings remaining on the calendar for the rest of this week roll out.
Written by
James Stanley
Sr. Strategist
Gold Talking Points:
- Gold has shown an interesting response to FOMC rate meetings in the Kevin Warsh era and today brings the fourth such occurrence.
- While the Fed has leaned into hawkish policy in effort of reducing inflation gold has grinded on the $4k level with last week bringing the most recent test.
- While short-term hawkishness remains a bearish factor for gold, longer-term the question is whether we’ll see the loose and supportive central bank policies make their way back, and that’s likely a reason behind the prior support at the $4k level.
Gold has taken a hit since the August breakout, and from the chart below we can see where Fed meetings have played a role in the matter.
During Kevin Warsh’s first meeting atop the Fed on June 17th, markets were taken aback by just how hawkish the Fed seemed to be. For a Central Bank that ignored inflation in 2021 and instead said 6 or 7% CPI was ‘transitory’ and ‘supply chain related,’ suddenly, the Fed was acting as if a jump past 3% was a reason for alarm.
This prodded a rally in the US Dollar, as looked at in yesterday’s webinar, and that also showed a sell-off in gold prices that finally allowed for a $4k test.
But, a month and a half later at the July meeting, the Fed refrained from hiking and there were only three dissenting votes looking to hike rates that month. Notably, this was a non-quarterly meeting, meaning the bulk of the attention was on Kevin Warsh for the press conference. And despite taking a familiar hawkish refrain, markets seemed to see through that, as Warsh could have easily voted for a hike if he felt how he sounded. And, this time we saw a strong sell-off in the Dollar and shortly after, a massive rally in gold.
On the below daily chart I’ve applied a vertical line for each of Warsh’s first three rate decisions.
Gold Daily Chart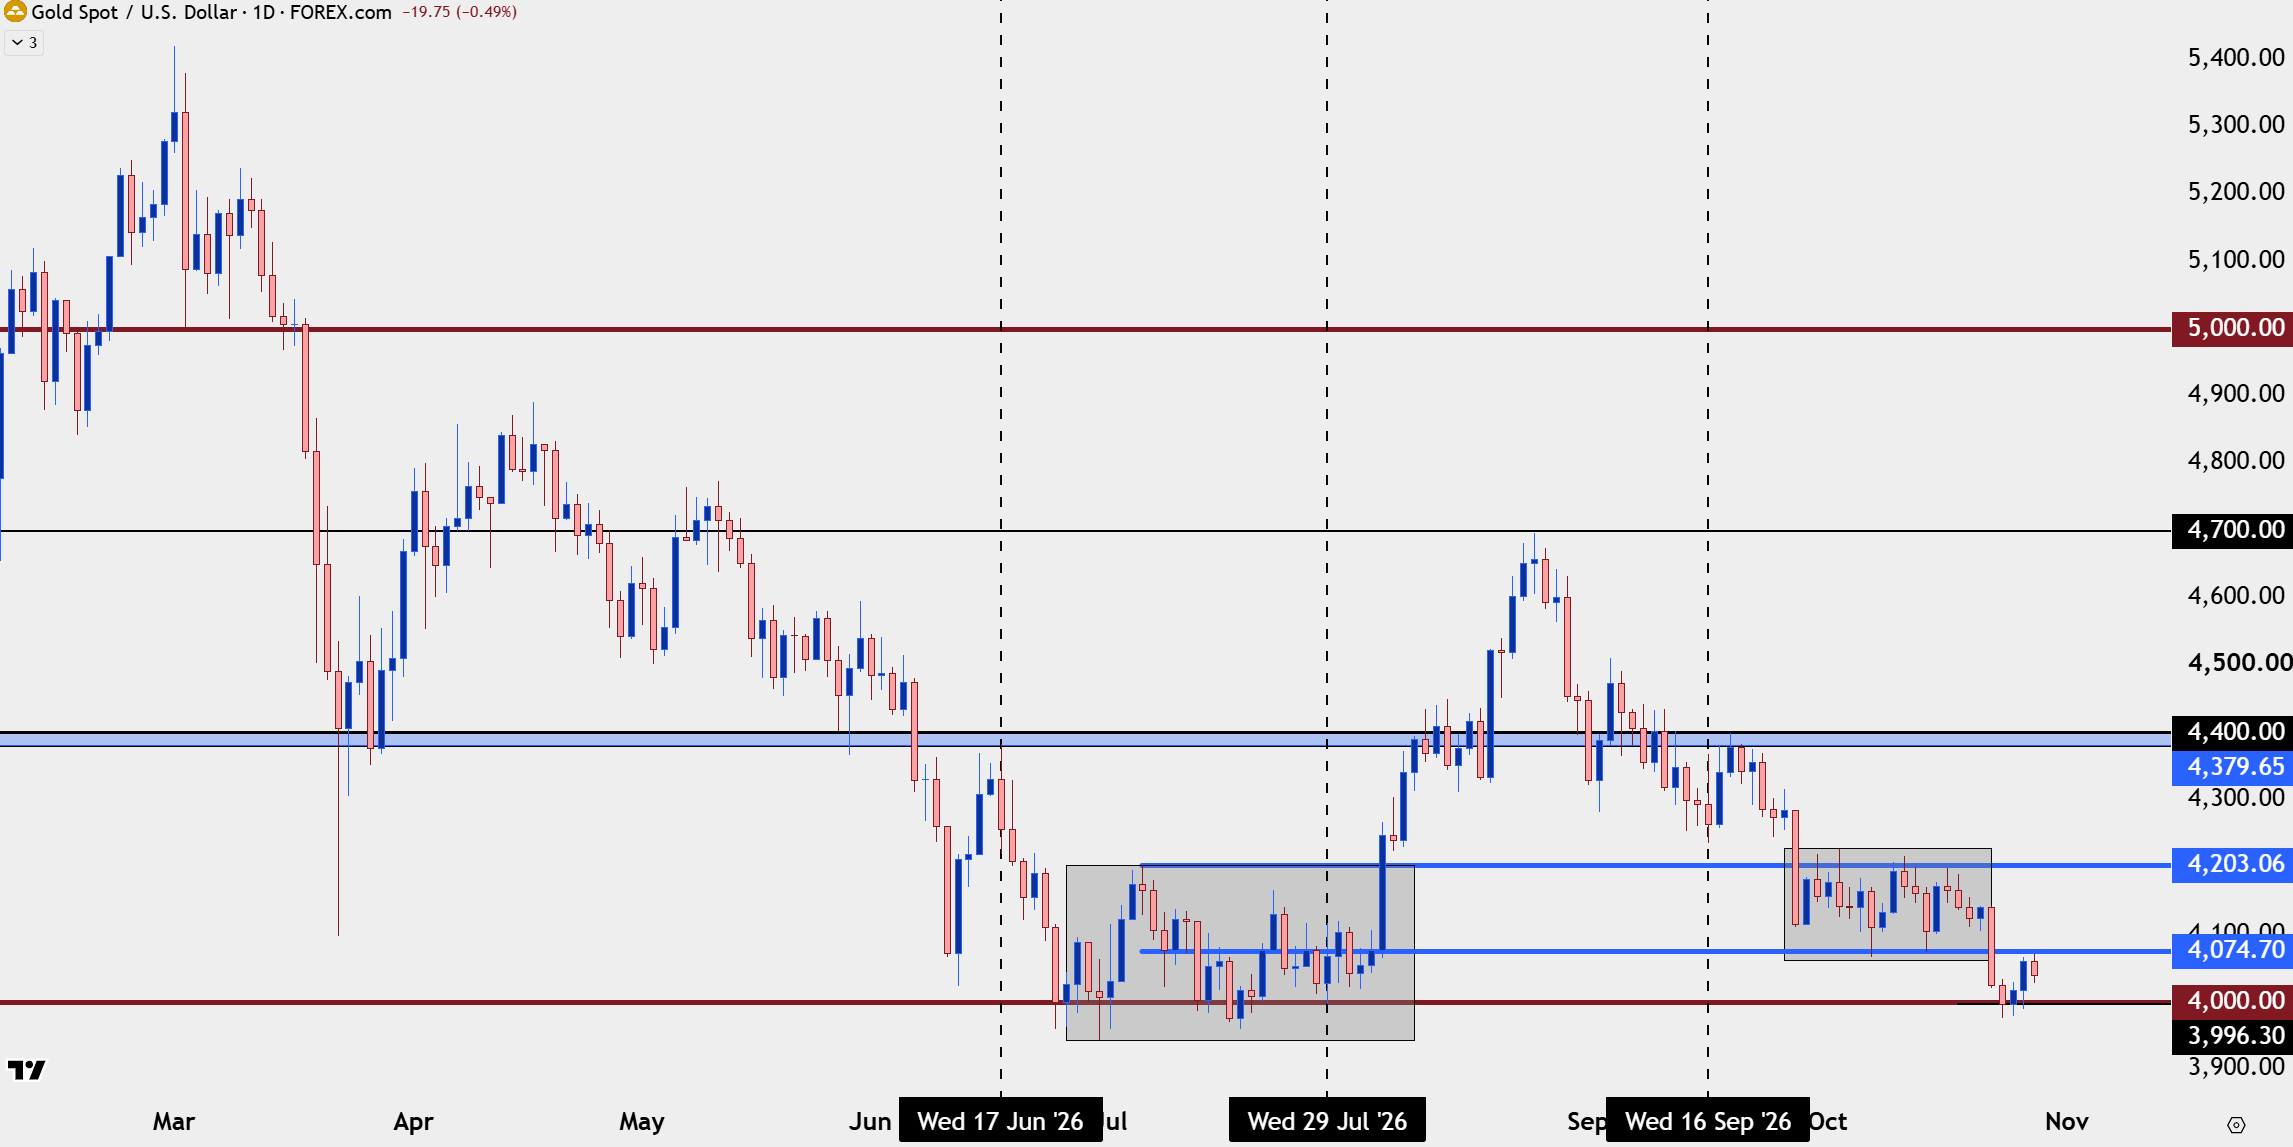
Chart prepared by James Stanley; data derived from Tradingview
Gold: A Recovery Begins to Show
Last week ended on a sour note for bulls as gold did something it hadn’t done for more than a year prior: It finished the week below the $4k psychological level. This went along with a few different items of risk aversion fear such as a sell-off in USD/JPY and a harsh Thursday in tech stocks, going along with what had already started to show as sizable pullbacks in Japanese and Korean stocks.
But, so far this week, there’s an optimistic push as bulls have responded to the $4k level and price on the four-hour chart is working with a fresh higher-high and a possible higher-low right around that big figure test.
And as I looked at in the webinar yesterday, this is a non-quarterly meeting at the Fed, meaning Warsh has probably more sway than he would if the bank was issuing updated guidance and projections. So, provided that there’s no surprise rate hikes, this gives Warsh a bit more latitude in speaking optimistically about the economy or tempering hawkish expectations. And given the mid-term election next week, there’s perhaps more motive for him to do so as sounding uber hawkish could potentially create a more decisive risk-off event before voters go to the polls.
On the below chart, we can see resistance so far playing in from prior swing support, around $4067, and higher-low support having held from shorter-term resistance (green dashed line).
Gold Four-Hour Chart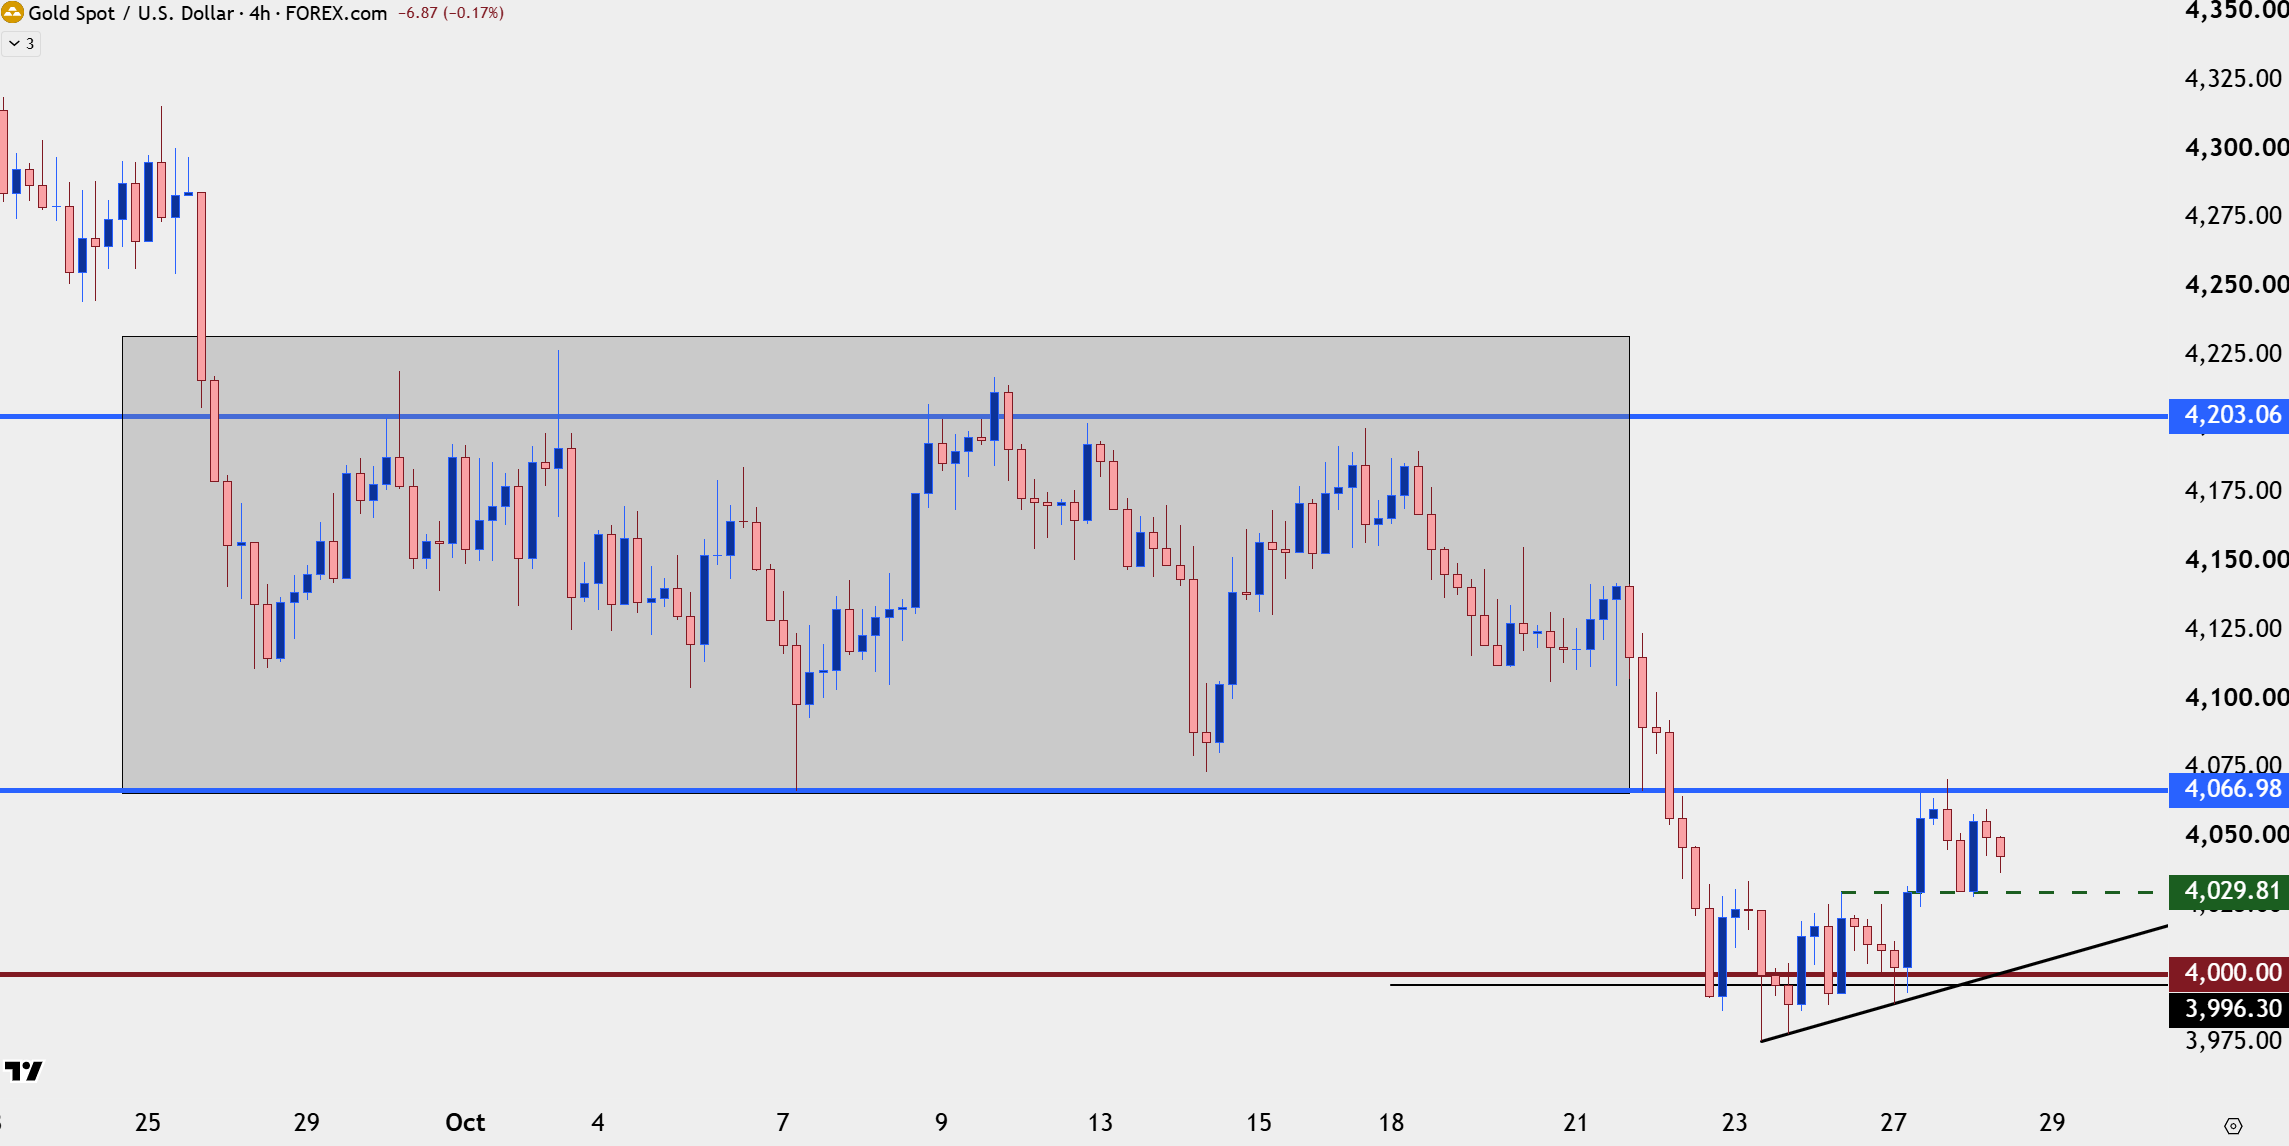
Chart prepared by James Stanley; data derived from Tradingview
Gold: The Bearish Scenario
I covered this topic in this week’s Top 5 Charts video but the fact that we had a weekly close below $4k is something that must be respected, especially given that it went along with a few other hints of larger risk aversion.
I think expecting Kevin Warsh to kick this into a downward spiral may be a bit presumptuous, especially given election timing, but the fact of the matter is that, so far, sellers have been hitting tech stocks on bounces and there’s legitimate worry about the AI bubble popping, especially with what’s shown already in Asian markets (we can include China in that mix, as well).
And if we are truly in a period of harsh risk aversion, like we saw back in 2008 during the Financial Collapse, that can lead to further downside in gold.
At this point, the driver can probably be drawn back to oil prices and, further, the continued military operation in Iran. The longer that drags out, the more inflation potential that oil represents and that puts the Fed in the unenviable spot of having to hike rates regardless of growth.
When we do end up with that backdrop of recession fear, that’s when we can see correlation across risk markets with investors flocking to the safe haven of Treasuries, which is what showed up last week. But, so far this week the 10-year has poked back above 5% and we’ve seen bounces in tech stocks and gold, so there is some optimism for bulls in those markets, at this point. That does not mean, however, that what happened last week should already be forgotten.
Gold Weekly Price Chart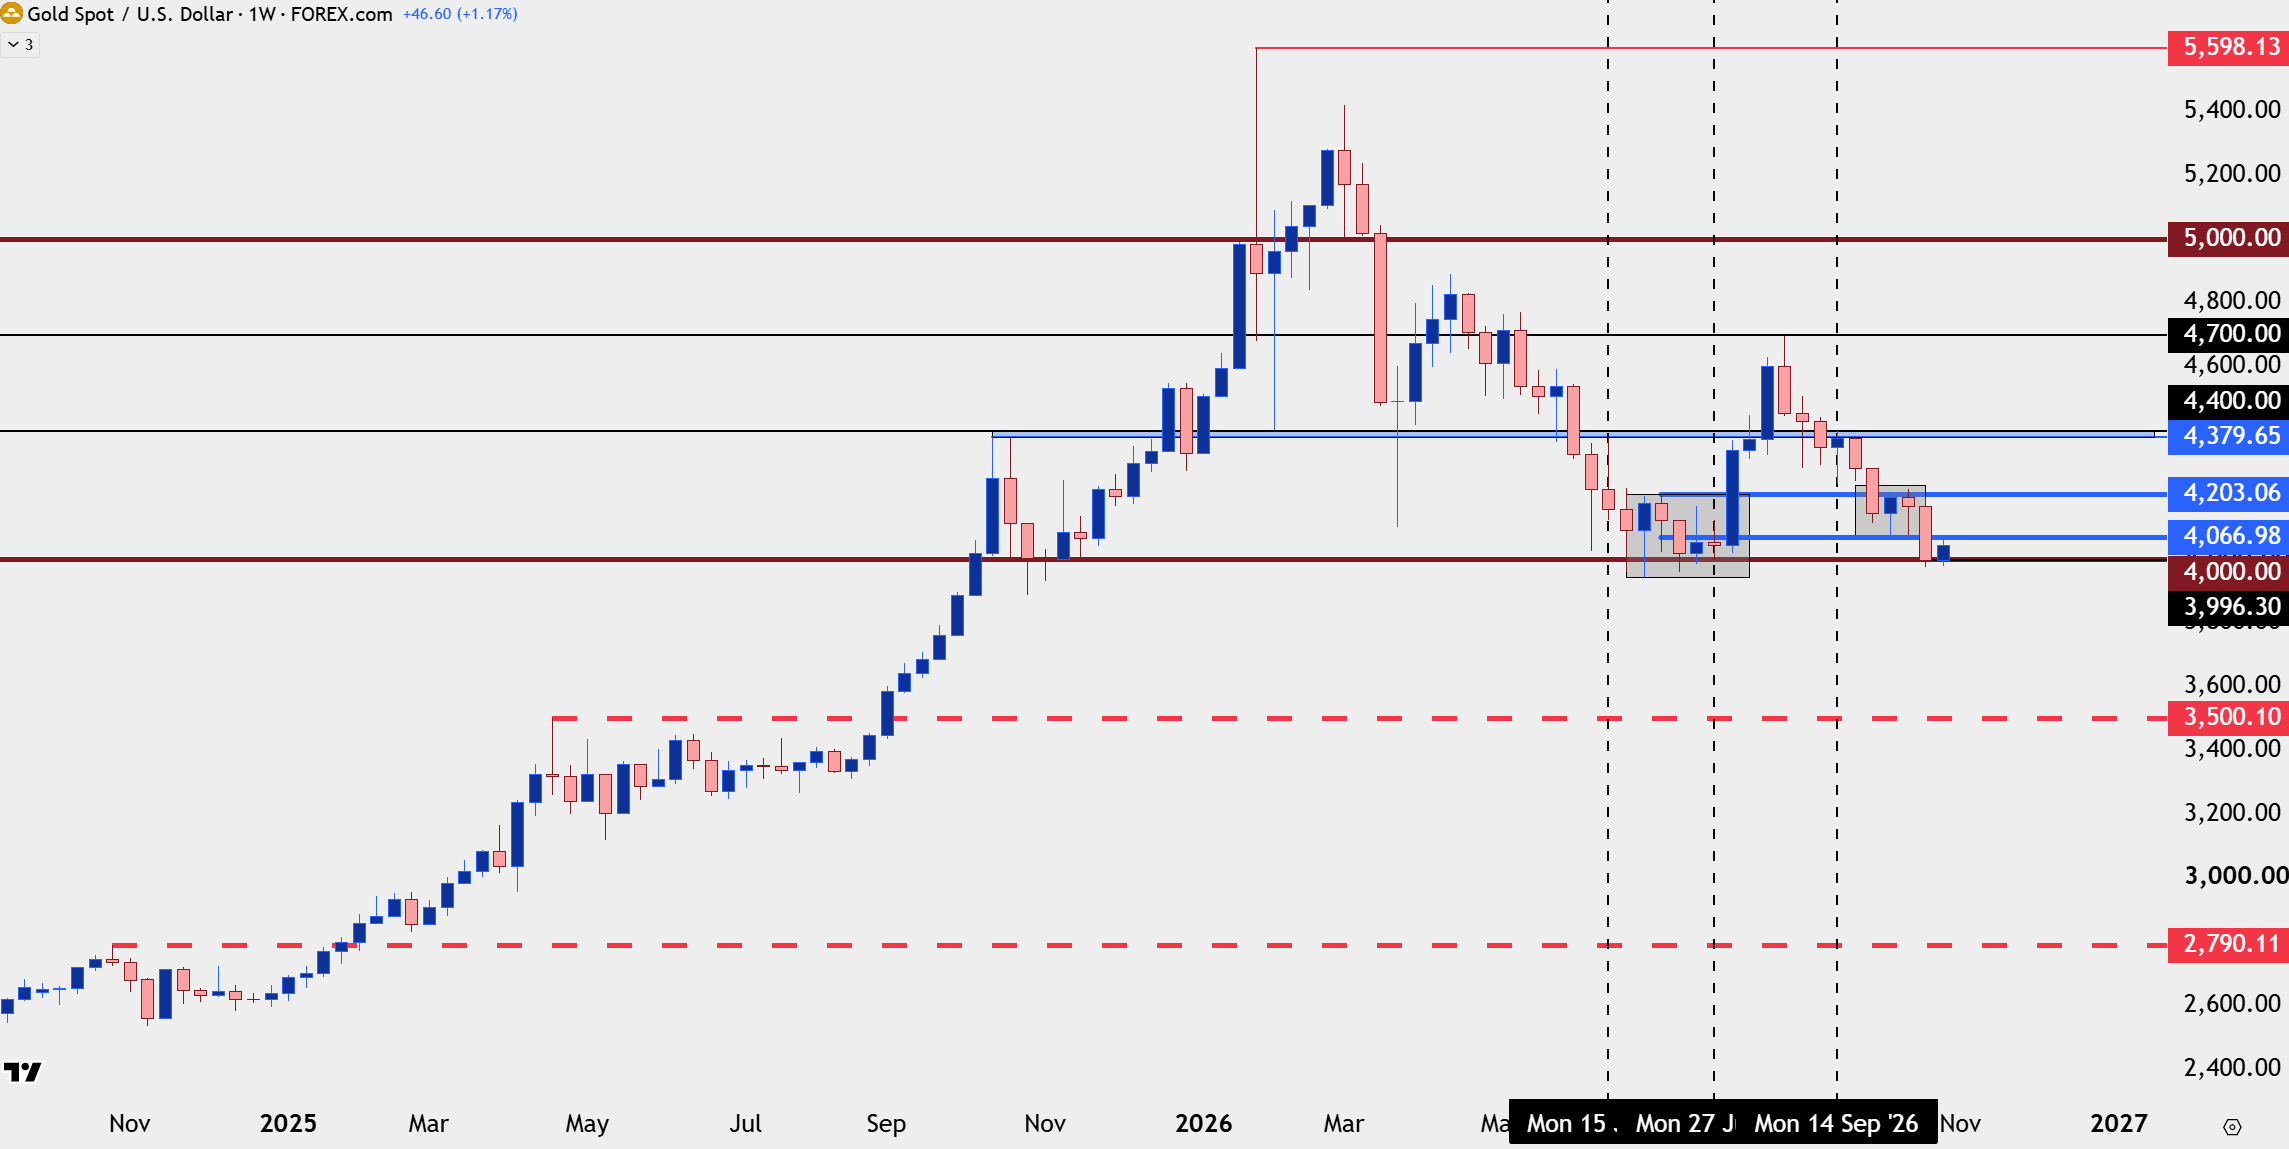
Chart prepared by James Stanley; data derived from Tradingview
--- written by James Stanley, Senior Market Analyst, Global Macro
Related tags:
Latest market news








Web Trader platform
Our sophisticated web-based platform is packed with features.
Open an account today
Experience award-winning platforms with fast and secure execution.
Economic calendar
Related articles

Gold and S&P 500 analysis: What now after Warsh’s hawkish speech?
The dollar surged across the board after the Fed Chair Kevin Warsh surprised with a hawkish-leaning speech at the Jackson Hole summit. All the bearish dollar bets that had been accumulated since last Friday on the back of data weakness and bond market troubles had to be squared and that triggered a short squeeze rally for the dollar. Gold and silver dropped, as a result, as too did bitcoin, while US indices were giving back earlier gains.


Gold Falters at Resistance, Grappling With PCE, Month-End Flows and Jackson Hole
Gold has pulled back from resistance after sticky PCE data, with month-end flows and Jackson Hole now shaping the near-term outlook.


Gold forecast: XAU/USD retreats along with dollar debasement trade
Gold was down nearly 1.5% on the session, with US indices and Bitcoin also struggling. Is this a mere pause before more gains are seen, or have we already seen the end of the recent bullish advance?