


Gold Price Short-term Outlook: XAU/USD Holds Critical Support as Breakout Nears
Gold is consolidating after a steep selloff, with momentum divergence raising the stakes for the next move ahead of the Fed decision.
Written by
Michael Boutros
Sr. Technical Strategist
Gold Technical Outlook: XAU/USD Short-term Trade Levels
- Gold has declined nearly 10% from the September high, but selling pressure has stalled near major technical support.
- XAU/USD has held above a pivotal support zone for two weeks, with daily momentum divergence warning of possible downside exhaustion.
- The October opening range remains intact, putting the focus on a decisive break for near-term directional guidance.
- A sustained push above range resistance would strengthen the case for a more meaningful recovery.
- Failure to preserve support would threaten another wave of accelerated selling and bring the yearly lows back into focus.
- Resistance 4230, 4307/19 (key), 4382- Support 4096-4104 (key), 4007, 3951
Gold remains at an important technical crossroads as October trade unfolds, with buyers attempting to establish a foothold following the sharp decline from the September highs. Although the broader near-term trend remains bearish, increasingly divergent momentum suggests selling pressure may be losing traction, leaving the market vulnerable to a larger reaction in the days ahead. The immediate challenge is whether bulls can force a recovery through overhead resistance or whether another wave of selling triggers a deeper correction. Meanwhile, this week's hotter-than-expected inflation data and subsequent Fed commentary have fueled sharp swings in Treasury yields and interest-rate expectations, adding another layer of uncertainty ahead of the October FOMC decision. Battle lines drawn on the XAU/USD short-term technical charts.
Gold Price Chart – XAU/USD Daily
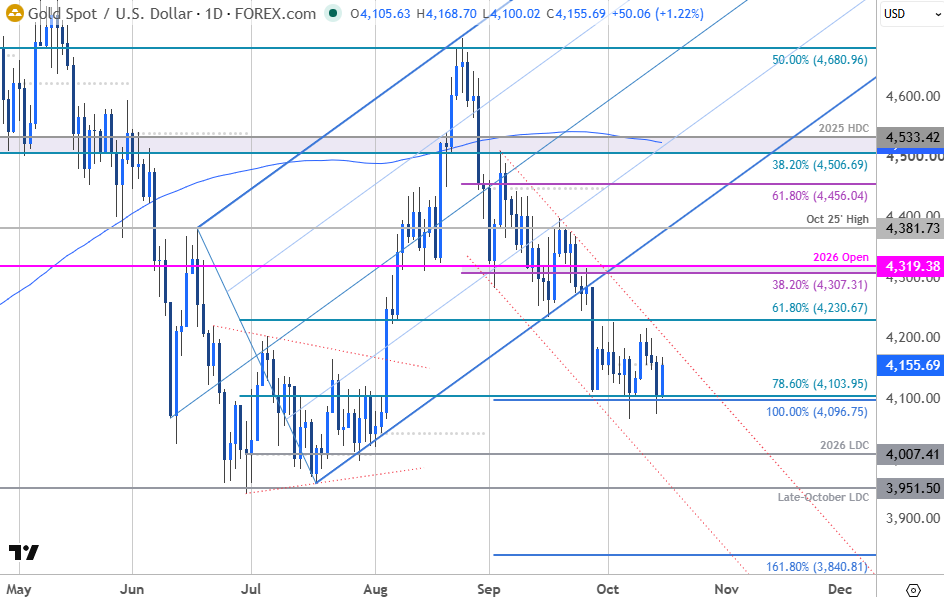
Chart Prepared by Michael Boutros, Sr. Technical Strategist; XAU/USD on TradingView
Technical Outlook: In last month’s Gold Short-term Outlook we noted that XAU/USD was, “trading just above pivotal support with the monthly opening range preserved ahead of major event risk. From a trading standpoint, losses would need to be limited to 4230 for the July uptrend to remain viable..” A definitive late-month break lower invalidated the July uptrend with the decline extending more than 9.8% off the September high.
The losses were halted at confluent support near the 100% extension of the August selloff and the 78.6% retracement of the late-June rally at 4096-4104. Gold has been unable to mark a daily close below this level and the focus remains on possible inflection off this threshold with the October opening range intact just above. Ongoing momentum divergence on the daily chart suggests that the bears remain vulnerable while above this zone with price still holding within the confines of the September channel.
Gold Price Chart – XAU/USD 240min
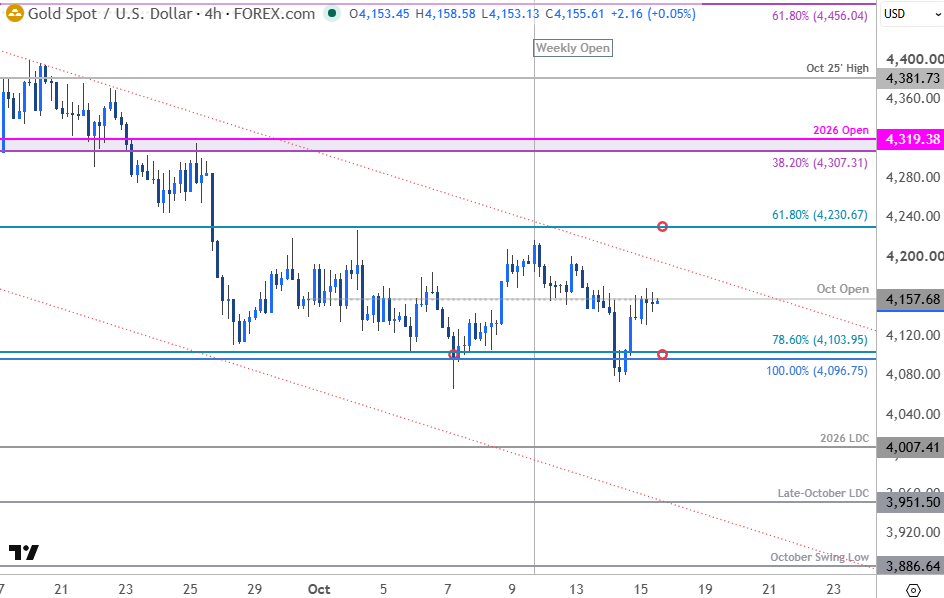
Chart Prepared by Michael Boutros, Sr. Technical Strategist; XAU/USD on TradingView
Notes: A closer look at gold price action shows XAU/USD trading within a well-defined range straddling the October open at 4158 for the past two weeks. Initial resistance is eyed at the upper parallel with a breach / close above the 61.8% retracement of the June advance at 4230 needed to suggest a more significant near-term low is in place, and a larger recovery is underway. Key resistance is eyed at the 38.2% retracement of the August decline and the objective yearly open at 4307/19. A rally surpassing this threshold exposes the next major technical considerations at the October 2025 swing high at 4382 and the 61.8% retracement near 4456.
A break / daily close below confluent support would threaten another bout of accelerated losses for the yellow metal. Subsequent support objective rest at the 2026 low-day close (LDC) at 4007 and the yearly low / 2025 late-October LDC at 3942/51- look for a larger reaction there IF reached.
Bottom line: Gold has defended a key support zone the past two weeks with the monthly range set just above- look for the breakout to offer guidance here in the days ahead. From a trading standpoint, losses need to be limited to 4096 IF gold is going to make a larger recovery here with a breach / close above 4230 needed to fuel a larger breakout. Keep in mind that a decisive break below this key pivot zone could trigger a sharp deterioration in the technical outlook, opening the door for a much steeper decline.
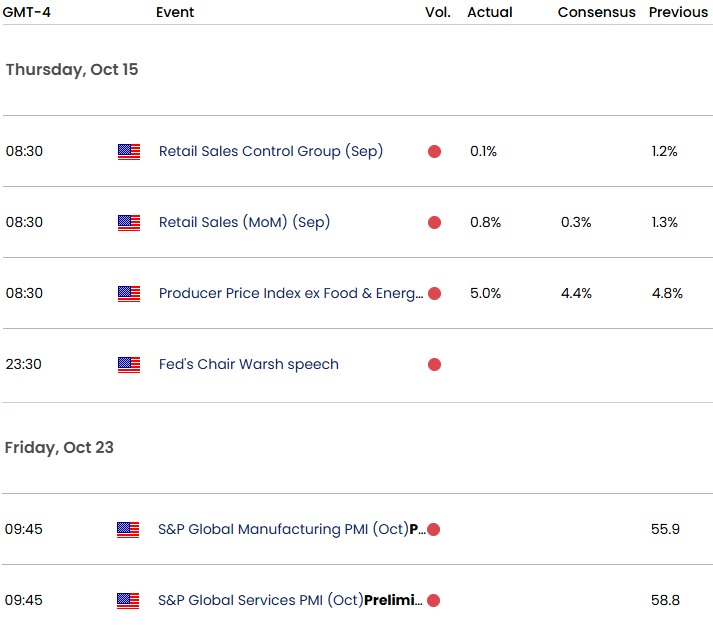
Event risk remains elevated for gold into the weekly close, with Fed Chair Kevin Warsh’s latest commentary in focus following this week’s hotter-than-expected CPI report and subsequent reversal in Treasury yields. Although expectations for an October rate hike briefly climbed to nearly 50% following the inflation release, markets have since reversed course, now pricing a 72% probability the Fed will hold rates steady this month. With the economic calendar relatively light next week and Fed officials entering their pre-meeting blackout period, Treasury yields and the U.S. dollar are likely to remain key drivers for bullion ahead of the October FOMC decision. Stay nimble into the weekly close and watch for signs of a more decisive technical move in the days ahead. Review my latest Gold Weekly Technical Forecast for a closer look at the longer-term XAU/USD trade levels.
Key US Economic Data Releases
--- Written by Michael Boutros, Senior Technical Strategist
Follow Michael on X @MBForex
Latest market news










Web Trader platform
Our sophisticated web-based platform is packed with features.
Open an account today
Experience award-winning platforms with fast and secure execution.
Economic calendar
Related articles

Gold and S&P 500 analysis: What now after Warsh’s hawkish speech?
The dollar surged across the board after the Fed Chair Kevin Warsh surprised with a hawkish-leaning speech at the Jackson Hole summit. All the bearish dollar bets that had been accumulated since last Friday on the back of data weakness and bond market troubles had to be squared and that triggered a short squeeze rally for the dollar. Gold and silver dropped, as a result, as too did bitcoin, while US indices were giving back earlier gains.


Bitcoin Forecast: BTC/USD Back to $80K Ahead of Warsh’s Jackson Hole Speech
After surging over $15,000 in the past 10 days alone, there is risk of a near-term pullback if Warsh says anything remotely hawkish at Jackson Hole - what are the levels to watch from here?

Gold Falters at Resistance, Grappling With PCE, Month-End Flows and Jackson Hole
Gold has pulled back from resistance after sticky PCE data, with month-end flows and Jackson Hole now shaping the near-term outlook.
