


S&P 500 Another Thursday Bounce After CPI-Fueled Sell-Off
Carnage may be overstating it a bit given that fresh ATHs were printed just a week ago but if you were reading the headlines, it would certainly seem to be more than just a -2.28% pullback from the high.
Written by
James Stanley
Sr. Strategist
S&P 500 Talking Points:
- All the talk of an AI bubble has the world on edge and yesterday’s sell-off saw many proclaiming that the bubble had burst. In reality, we’re still in the early innings of whatever this will become.
- Of late, there’s been a tendency for late-week bounces to develop and so far this week we’re seeing another, with a significant swing low on Thursday morning.
Late-week rallies have been a thing for US equities over the past month and this morning is sticking with that script, as an initial sell-off on the back of the PPI report found support at a huge spot – and that’s been followed by a sizable rally.
This Thursday bounce echoes what’s happened for the past six Thursdays, highlighted on the below chart with vertical lines.
S&P 500 Futures Four-Hour Chart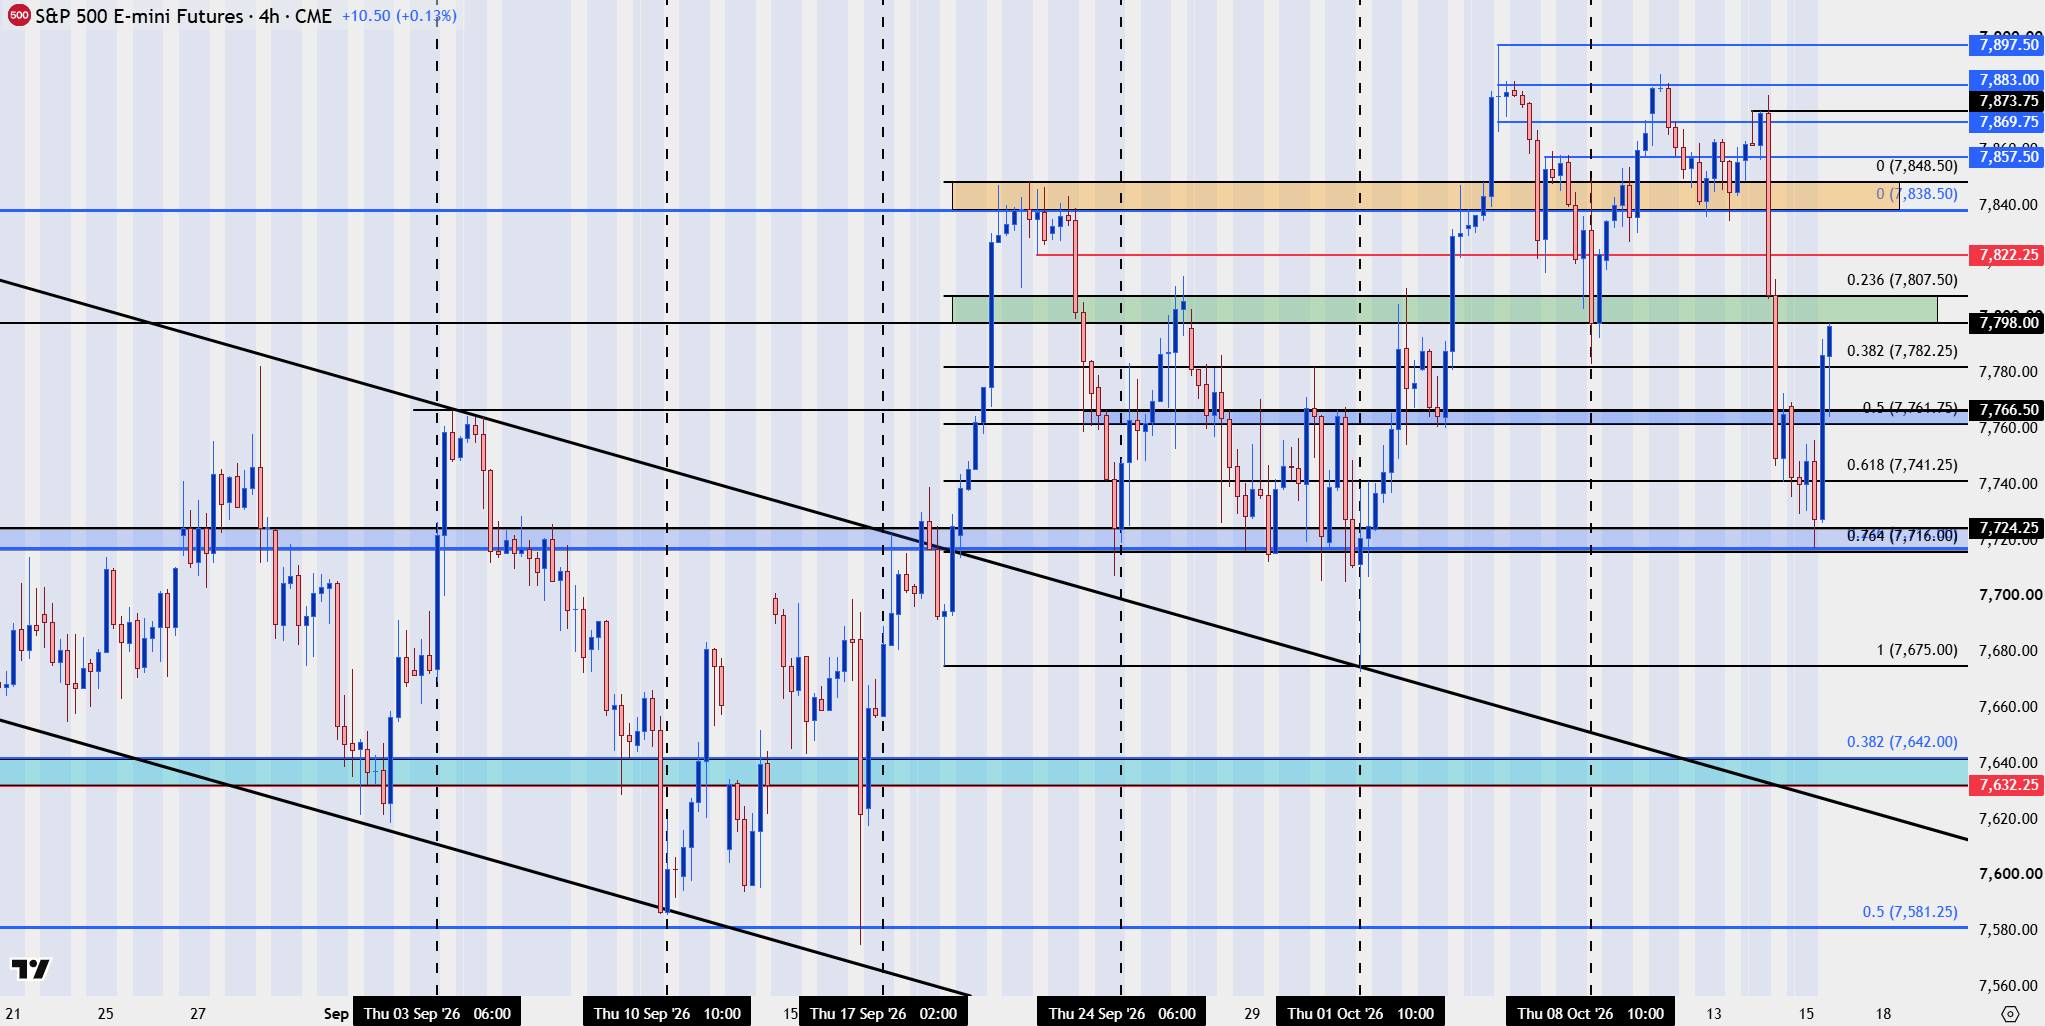
Chart prepared by James Stanley; data derived from Tradingview
The Friday Set Up in Stocks
While a few items of worry had started to show, with a larger sell-off in the Nasdaq and NVDIA leading the way lower, there’s been a pattern of late-week rallies of late likely due to the fear of holding short positions into the weekend. With President Trump pumping markets via comments as we are now just a few weeks away from mid-term elections, it can be a difficult time to be caught short, and I think that’s played a role.
Perhaps the larger question is what happens in the scenario where Republicans lose the House, which seems likely at this point. As President Trump has warned already, Democrats winning either house of Congress brought an economic threat to the country.
At this point, however, bulls are still in the ballgame and the weekly chart of the S&P 500 shows that well, as price has, so far, held at a big spot of prior resistance. The patterning is a rising wedge, which could point to bearish reversal potential, but as looked at earlier in the week, the more vulnerable area appears to be the high-flying tech stocks that led the way from the 2022 lows.
S&P 500 Futures Weekly Chart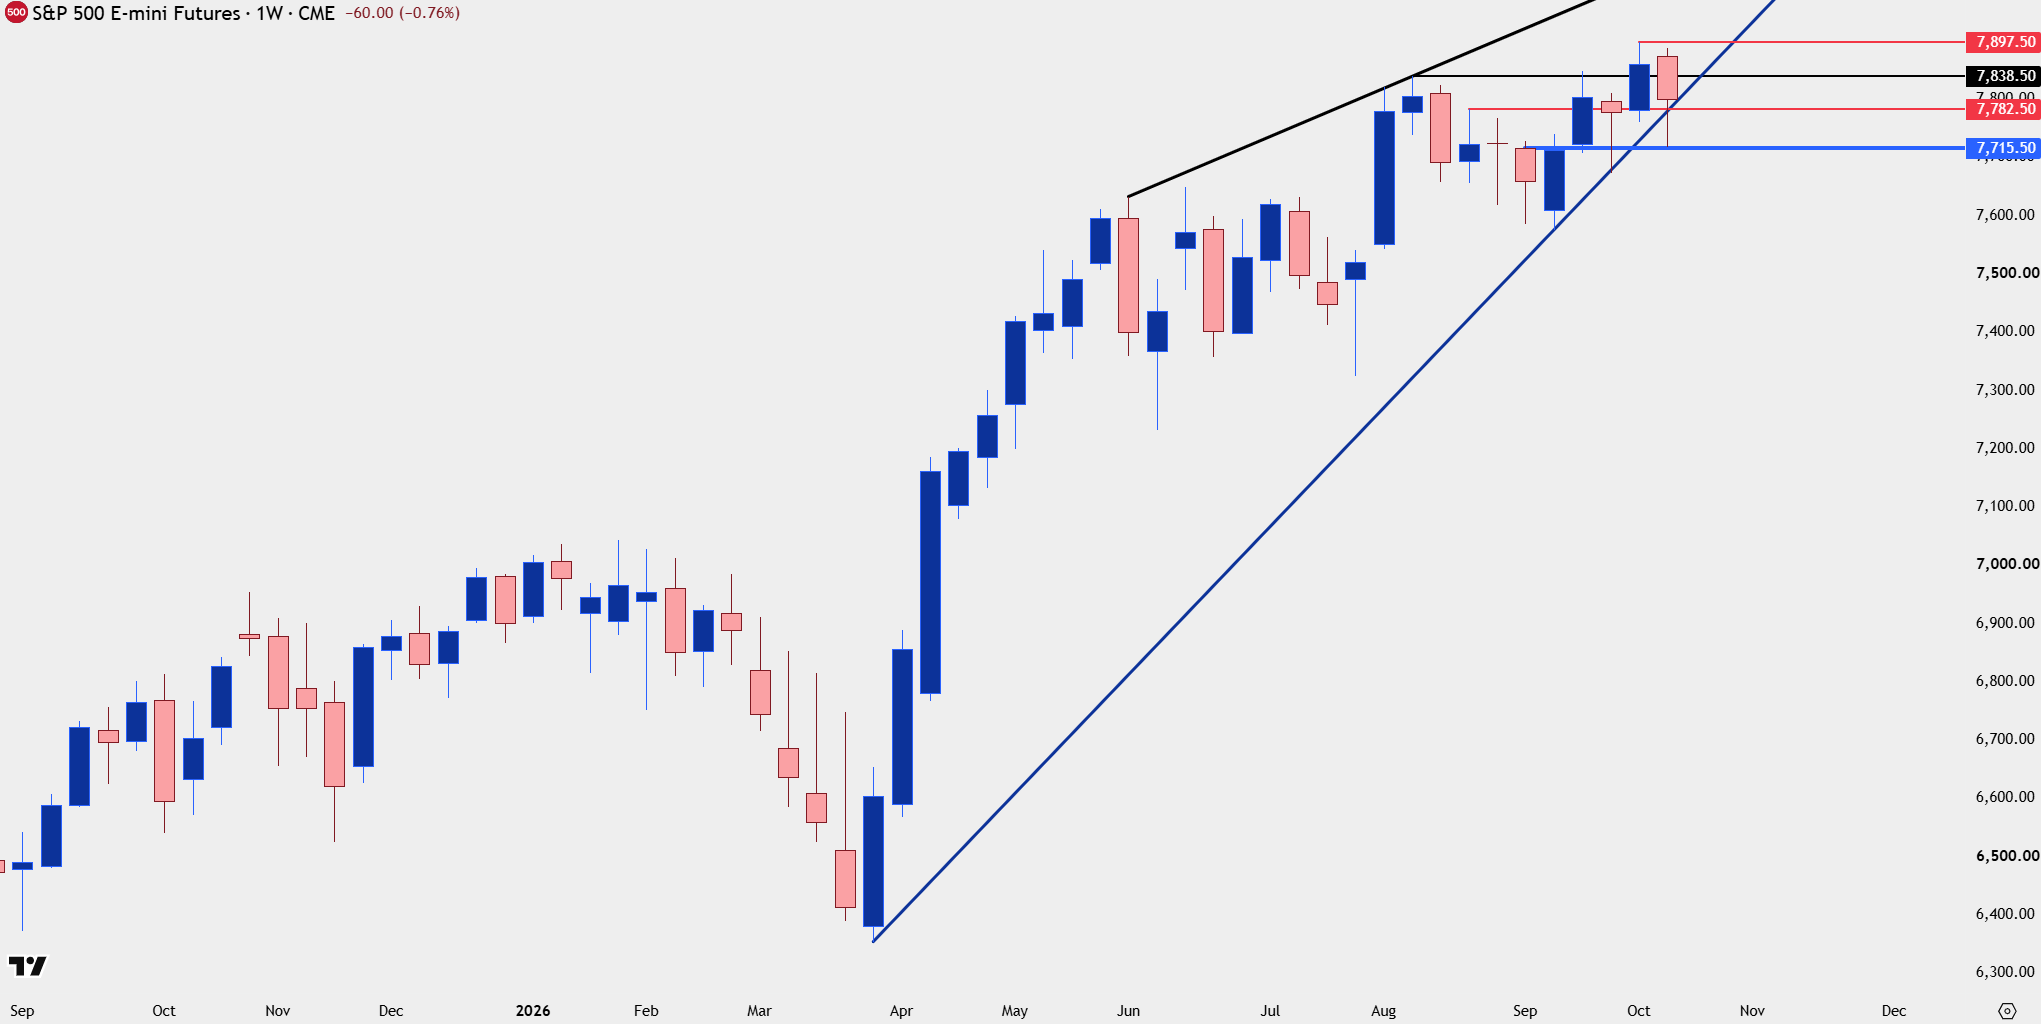
Chart prepared by James Stanley; data derived from Tradingview
--- written by James Stanley, Senior Market Analyst, Global Macro
Related tags:
Latest market news










Web Trader platform
Our sophisticated web-based platform is packed with features.
Open an account today
Experience award-winning platforms with fast and secure execution.
Economic calendar
Related articles

Gold and S&P 500 analysis: What now after Warsh’s hawkish speech?
The dollar surged across the board after the Fed Chair Kevin Warsh surprised with a hawkish-leaning speech at the Jackson Hole summit. All the bearish dollar bets that had been accumulated since last Friday on the back of data weakness and bond market troubles had to be squared and that triggered a short squeeze rally for the dollar. Gold and silver dropped, as a result, as too did bitcoin, while US indices were giving back earlier gains.


S&P 500 Forecast: SPX after Nvidia revives confidence in the AI trade
U.S. stocks are heading higher on Thursday, with technology leading the move after Nvidia's stronger-than-expected outlook revived confidence in the AI trade.

S&P 500 Forecast: SPX rises modestly lower ahead of key catalyst week
U.S. stocks are under pressure at the start of the week, extending last week's losses, with technology stocks leading the decline. Investors are becoming more cautious ahead of a busy week featuring Nvidia earnings, core PCE inflation and the Federal Reserve's annual Jackson Hole symposium.