


Nasdaq & Silver Price Outlook: Cautious Optimism Ahead of the FOMC
Nasdaq and Silver Price Outlook: Markets remain cautiously optimistic ahead of the FOMC as Hormuz optimism offsets inflation and dollar strength.
Written by
Razan Hilal
Market Analyst
Cautious optimism continues to support global markets this week as investors weigh developments surrounding the US-Iran peace agreement, the potential reopening of the Strait of Hormuz, and the inflation implications that may be addressed at today's FOMC meeting chaired by Kevin Warsh.
Headline inflation remains elevated at 4.2%, while the proposed US-Iran agreement still depends on progress regarding Iran's nuclear program and security arrangements along the Lebanese border. I discussed the memorandum and its broader market implications in greater detail in my recent analysis covering gold and the US Dollar Index : DXY, Gold Price Forecast: Will Kevin Warsh's First FOMC Halt or Support Gold's Rebound?
Markets Hold Below Key Resistance Levels
Major asset classes remain below key resistance levels while crude oil attempts to stabilize near $74, a zone that coincides with the peak of the 2025 Middle East conflict rally.
- Gold remains below the key 4,370 resistance, representing the 61.8% Fibonacci retracement of the May 29–June low decline.
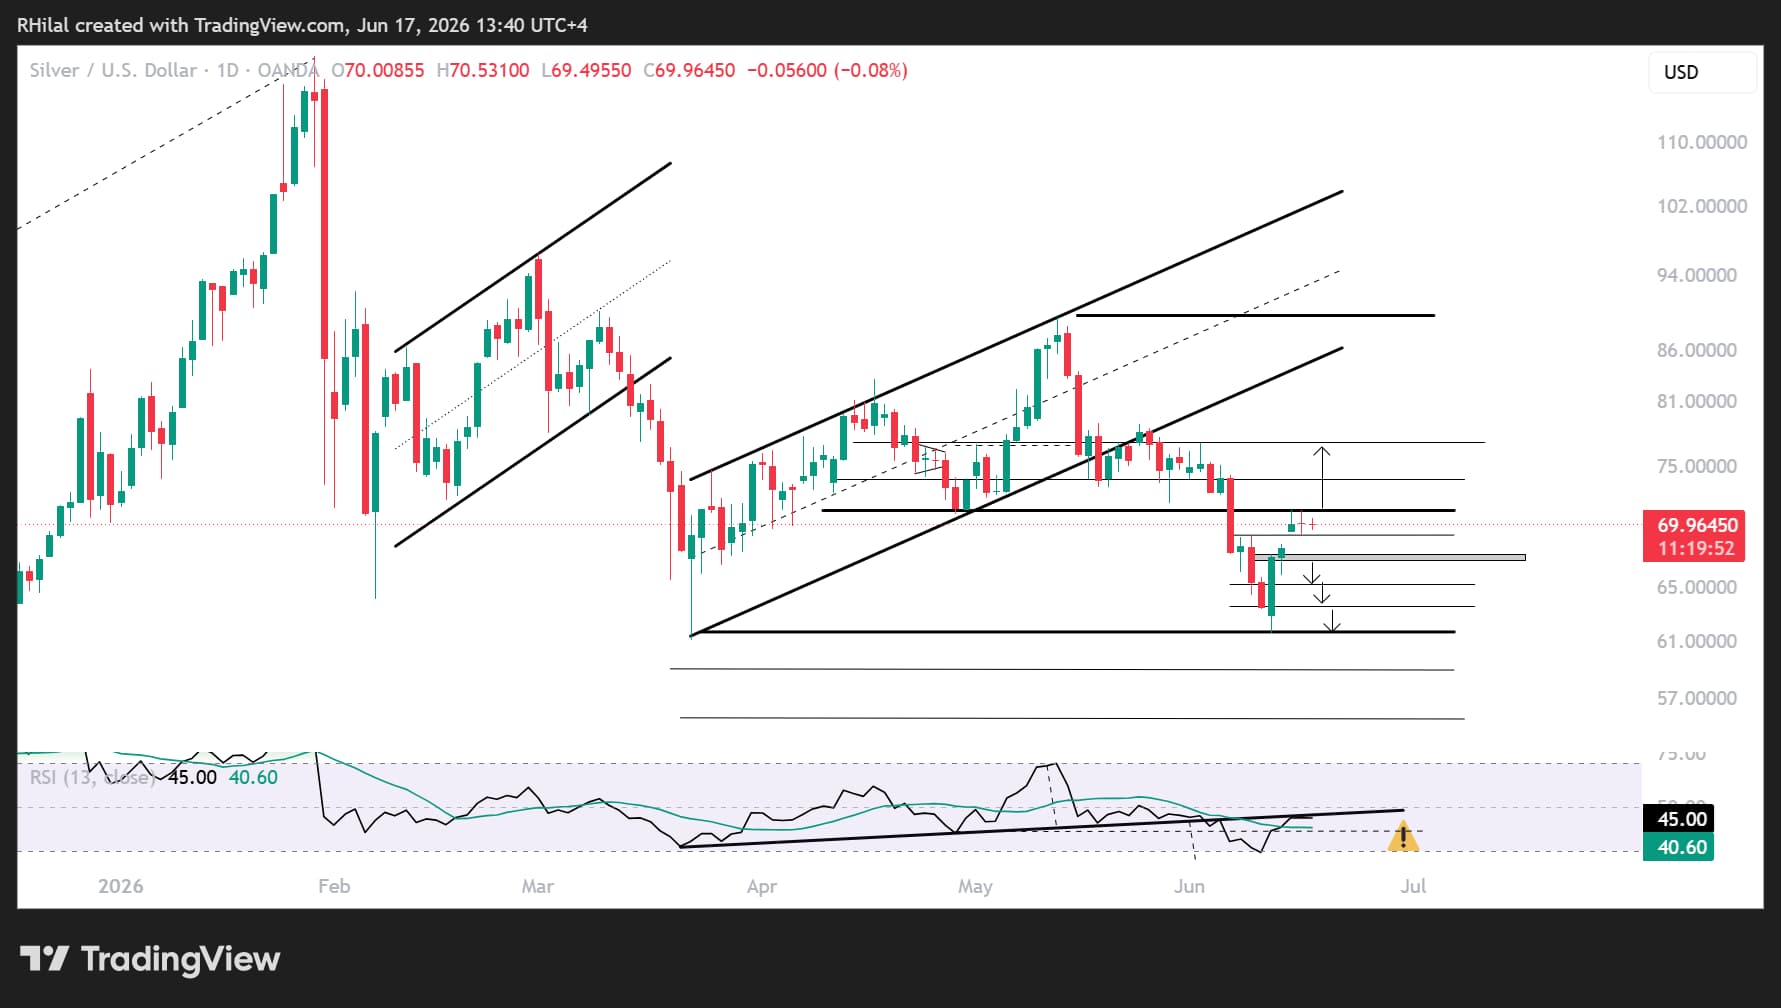
- Silver continues to trade below 71, the 61.8% Fibonacci retracement of the June high-low move.
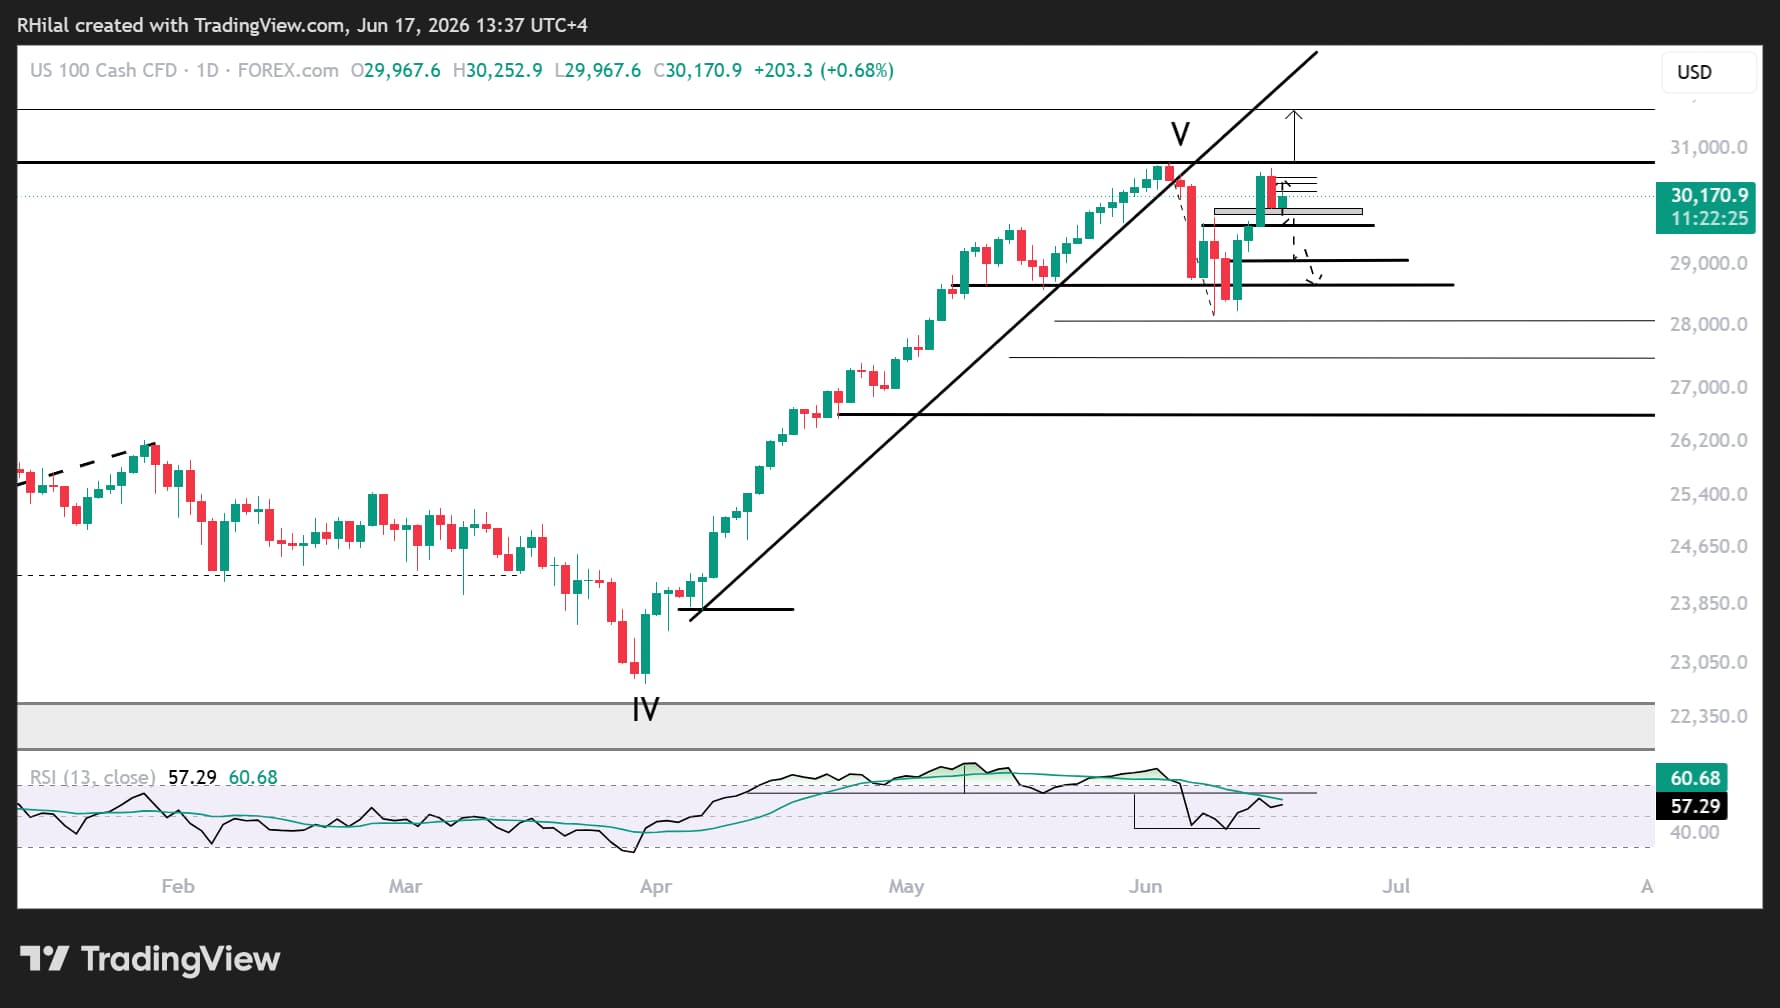
- Nasdaq has retreated more than 500 points after failing to sustain a breakout above its 30,700 all-time high.
- Dow Jones remains below the 52,000 record level, where a multi-month ascending resistance trendline continues to cap gains.
- DXY is holding above 99.30, preserving its bullish structure across monthly, yearly, and broader multi-year trends.
These levels reflect the cautious optimism currently present across markets and may ultimately determine whether longer-term bullish or bearish trends prevail. I discuss these levels in my daily MENA market call, register here for the next webinar: https://attendee.gotowebinar.com/register/1712903232130037596
Nasdaq Price Outlook: Daily Time Frame – Log Scale
Source: TradingView
Nasdaq Challenges the 30,700 Record High
The bullish rebound following Monday's market open pushed the Nasdaq back toward its record high near 30,700 before the index retreated more than 500 points to retest the critical 30,100–30,000 support zone.
While the broader uptrend remains intact, the recent pullback highlights the market's hesitation ahead of key developments from the Federal Reserve and the evolving geopolitical landscape.
Bullish Scenario – Reclaiming 30,400
A daily close above 30,400 could revive bullish momentum toward the 30,600–30,700 resistance zone for another test of the all-time highs.
A confirmed breakout above 30,700 could trigger an additional 1,000-point advance toward 31,700, aligning with the ascending trend support that has connected consecutive higher lows since April 2026.
Such a move would reinforce the broader bullish trend and confirm that investors remain willing to buy dips despite elevated valuations and ongoing macroeconomic uncertainty.
Bearish Scenario – Breaking Below 30,000
A breakdown below 30,000 would expose the key 29,700 support level, which may determine whether the index stages another bullish rebound or enters a deeper corrective phase.
Further weakness below 29,700 could expose downside targets at 29,000 and 28,600 before a broader bearish outlook gains traction, particularly given the persistent dip-buying appetite that has supported the Nasdaq throughout 2026.
For now, the 30,000 level remains the key line in the sand separating a healthy consolidation from a deeper correction.
Silver Price Outlook: Daily Time Frame – Log Scale
Source: TradingView
Silver Continues to Stall Below 71
Silver continues to trade cautiously below the key 71 resistance level, which previously acted as a major support zone throughout much of the price action since April 2026.
The metal remains highly sensitive to shifts in US dollar strength, inflation expectations, and broader risk sentiment. I discuss this chart regularly in my daily MENA market call and biweekly webinar.
Bullish Scenario – Reclaiming 71.30
A sustained move above 71.30, which coincides with the 61.8% Fibonacci retracement of the June high-low decline, could extend gains toward the next major Fibonacci levels:
- 73.90 (78.6% Fibonacci retracement)
- 77.00 (100% Fibonacci retracement)
A breakout above these levels would strengthen the case for the next bullish leg higher and confirm that silver is rejoining gold in a broader precious metals recovery.
Bearish Scenario – Closing Below 69
A break below the 69 support level could fill the recent opening gap and expose downside targets at previous supports:
- 67
- 65
- 63
A sustained move below these levels would reinforce the bearish outlook and increase the risk of a retest of the yearly low near 61.
Should selling pressure accelerate further, silver could revisit the former multi-decade resistance zone since 1990 that has acted as support since the 2024 breakout, between 55 and 48.
FOMC and Hormuz Remain the Key Catalysts
As markets await Kevin Warsh's first FOMC decision, both silver and the Nasdaq remain at critical technical inflection points.
The combination of easing geopolitical risks, falling oil prices, elevated inflation, and a resilient US dollar will likely determine whether current optimism evolves into a broader bullish breakout or fades into another corrective phase.
For now, cautious optimism remains the dominant theme, but confirmation above resistance levels will be required before markets can confidently re-establish their longer-term bullish trends.
Written by Razan Hilal, CMT
Follow on X: @Rh_waves







Web Trader platform
Our sophisticated web-based platform is packed with features.
Open an account today
Experience award-winning platforms with fast and secure execution.
Economic calendar
Related articles

USD/JPY weekly outlook: Payrolls may challenge the Fed’s hawkish reset
USD/JPY has finally woken from its slumber. Payrolls now loom as the key test of whether the latest hawkish repricing sticks or sinks.


Nasdaq 100 Forecast: NDX slips ahead of Fed Chair Warsh’s speech
U.S. stocks are edging lower on Friday, giving back some of yesterday's gains after Nvidia's strong outlook revived the tech trade. The focus has now shifted firmly to Fed Chair Kevin Warsh's Jackson Hole speech, with investors looking for more clarity on the outlook for interest rates.


Jackson Hole Returns: Nikkei 225 and Nasdaq 100 Volatility in Focus
Historical Jackson Hole returns point to elevated Nikkei 225 volatility around Fed speech day, with Nasdaq 100 direction hinging on Kevin Warsh.
