

S&P 500, Nasdaq 100 Drive into Correction Territory
Both the S&P and Nasdaq set fresh all-time-highs just last month, but quite a bit has happened since then. Sellers are in control as stocks just posted their worst week since April of 2025.
Written by
James Stanley
Sr. Strategist
S&P 500, Nasdaq Talking Points:
- The sell-off gained steam this week as a persistently hawkish Fed didn’t seem to yields to falling equity prices, adding worry to possible collapse of an AI bubble.
- NVDA is the obvious focal point but the entire neocloud and AI space was hit this week, as was the broader market which indicates that there’s another major push behind the sell-off.
- In the post-GFC backdrop, the Fed has often leaned towards accommodation and dovishness, and that’s what’s changed so drastically of late as last week brought a chorus call of Fed speakers talking up the prospect of higher rates.
It’s been a perfect storm in the equity space and, perhaps surprisingly, the big driver from the past week has not been the more obvious item of long-term interest rates. Although, to be sure, Treasuries did catch a bid as investors ducked for cover in safe haven Treasuries. dx
I spoke about this in the Q4 Forecast for Equities. It was the first in which I took a bearish forecast since starting to write these in early 2023. I titled the article ‘Cracks Begin to Show’ and, just past the halfway point of Q4 and those cracks have already turned into craters.
To be sure, there’s a plethora of risks facing equity markets at the moment. High US Treasury rates make for an unforgiving backdrop for corporates, although, like I’ve been highlighting in Top 5 Charts videos for StoneX, surging Treasury prices (and falling yields) create a sizable opportunity cost for stock market investors.
That’s what was on display last week, as capital left stocks and pushed into bonds, and that carries the big question of continuation as the US Treasury Department still has a lot of supply coming online in the coming months.
But also of issue last week was the continued spiraling of the AI trade. While the headlines are populated with personal matters or treason accusations, it’s the revenue model at the core of NVDIA that remains of question, as they were an outsized driver of capital to AI firms (who would then turn around and buy NVDA products). And with interest rates moving higher and NVDA backing away from some of these vendor-funded financing deals, along with other companies such as TSMC backing away, as well, there’s a legitimate liquidity concern.
This helps to explain why the tape in the Nasdaq was so incredibly heavy last week, as sellers just pounced on any element of a bounce and the index is now in negative territory for the year.
Nasdaq 100 Daily Chart
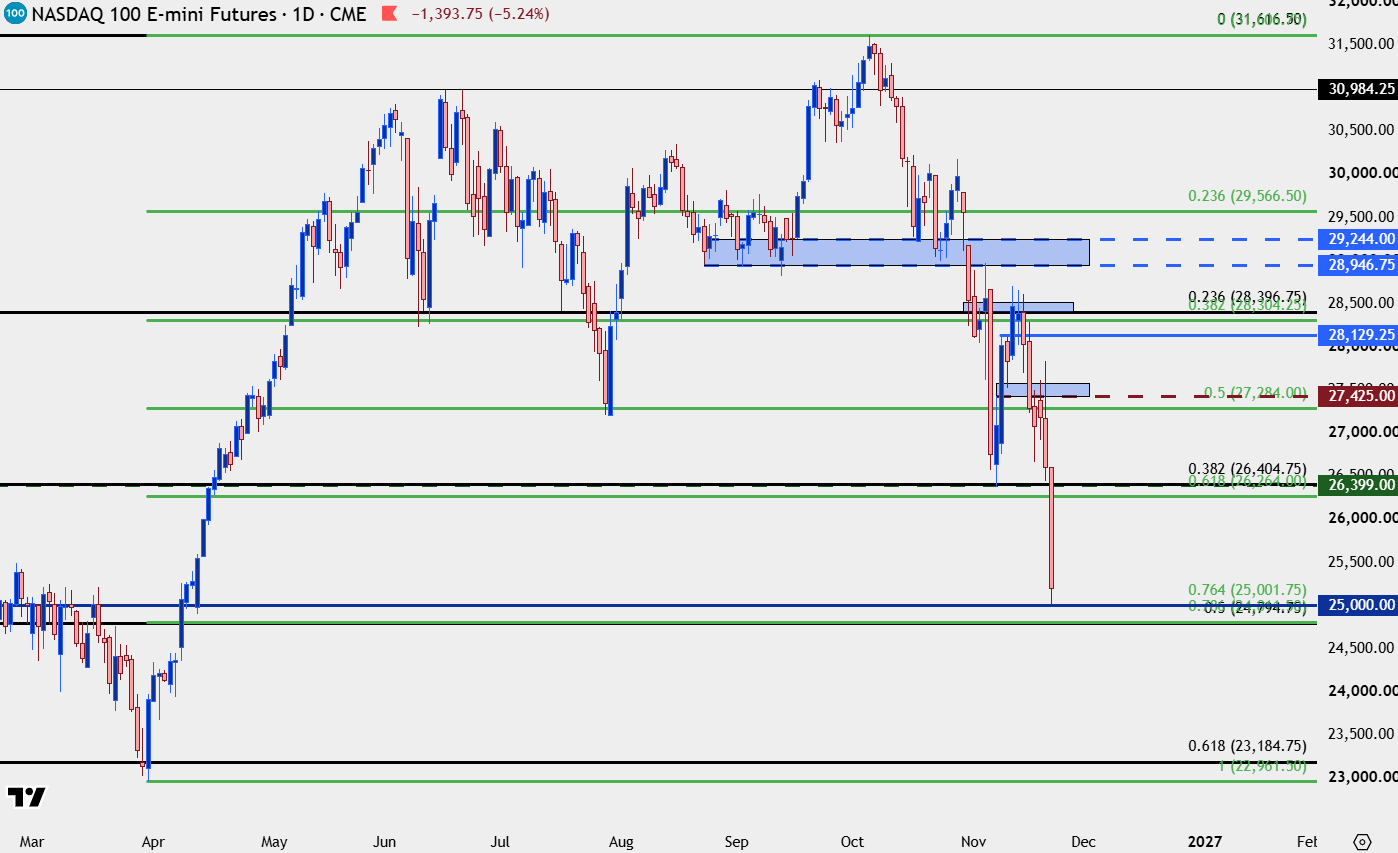
Chart prepared by James Stanley; data derived from Tradingview
Catching Falling Knives
The reason that price action is front and center, first and foremost in everything I do is because markets will often display a degree of irrationality. This should be no secret, but perhaps more damaging to the trader is if hinging performance on ‘gut instinct’ and ability to guess, well that can be a recipe for frustration. Price action, however, at the least attempts to strike some degree of objectivity. And perhaps most importantly, it allows the trader to put risk outlay – using simple math – on their side to the point where they won’t even need a coin flip or a 50/50 to seek out a profitable model.
The point of all this is to say that when we have a move such as we have in the Nasdaq, chasing is problematic because we’re far from any logical resistance areas.
But perhaps more to the point – we have to expand our expectations and keep an open mind, especially in a backdrop such as we have now where everything seems to be pointing in the same direction.
This has created a heavy, oversold environment that could be prone to short-squeezes and it’s from that scenario that we can better gauge just how aggressive sellers might continue to be.
From the weekly chart of the Nasdaq, there’s a major spot a little lower, around the 25k psychological level which is confluent with a Fibonacci level. If this comes into play early next week, and prods an oversold bounce, bears can then look for lower-high resistance in continuation scenarios.
Nasdaq 100 Weekly Chart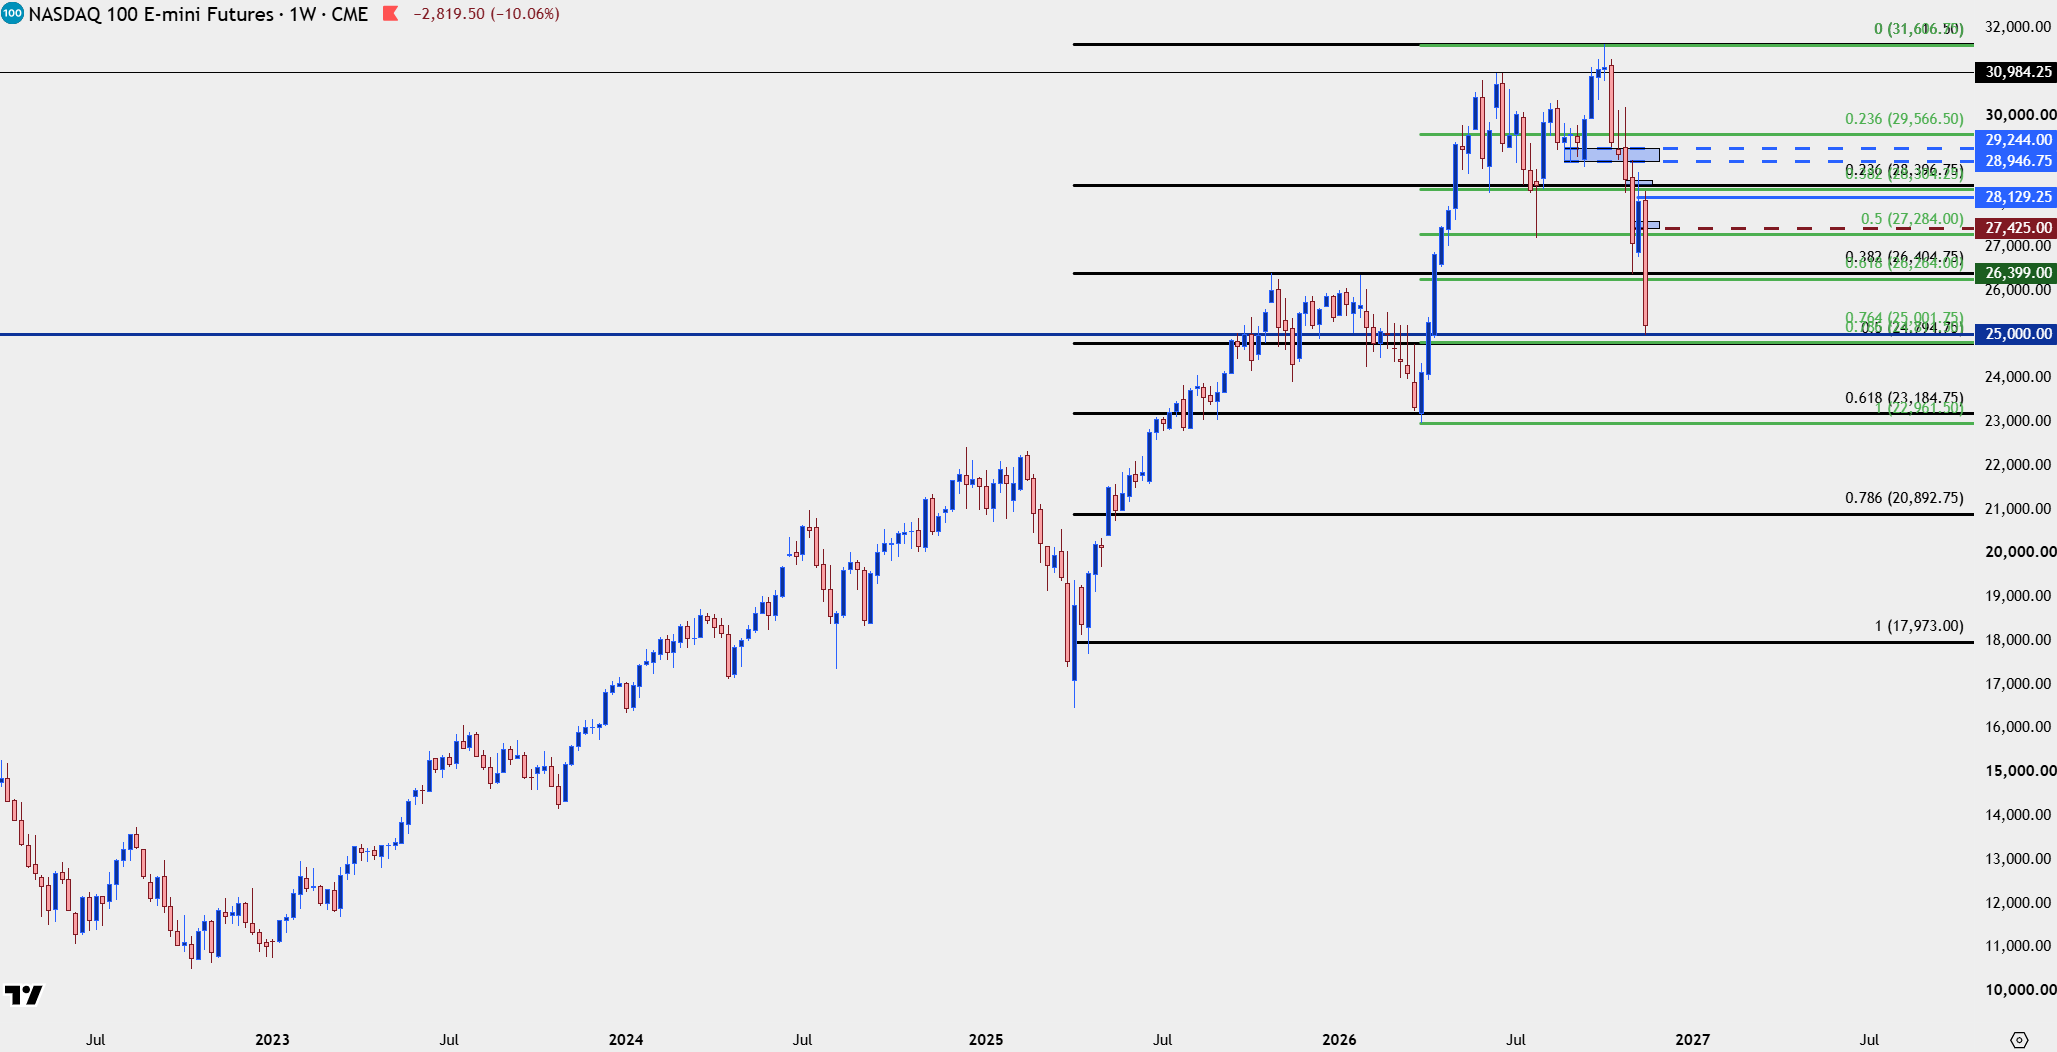
Chart prepared by James Stanley; data derived from Tradingview
S&P 500
It was last month when the S&P 500 printed a bearish engulf on the weekly chart, just one week after setting a fresh all time high. Matters have developed quickly since, and already, the index has erased 61.8% of the rally that started back in March.
This is a massive area, with the 7k psychological level nearby and like the above in NVDA, an oversold daily backdrop sets the stage for a possible bounce. Whether that turns into a rally, however, will likely have something to do with headlines and sentiment as the past week has shown a plethora of fear.
S&P 500 Daily Price Chart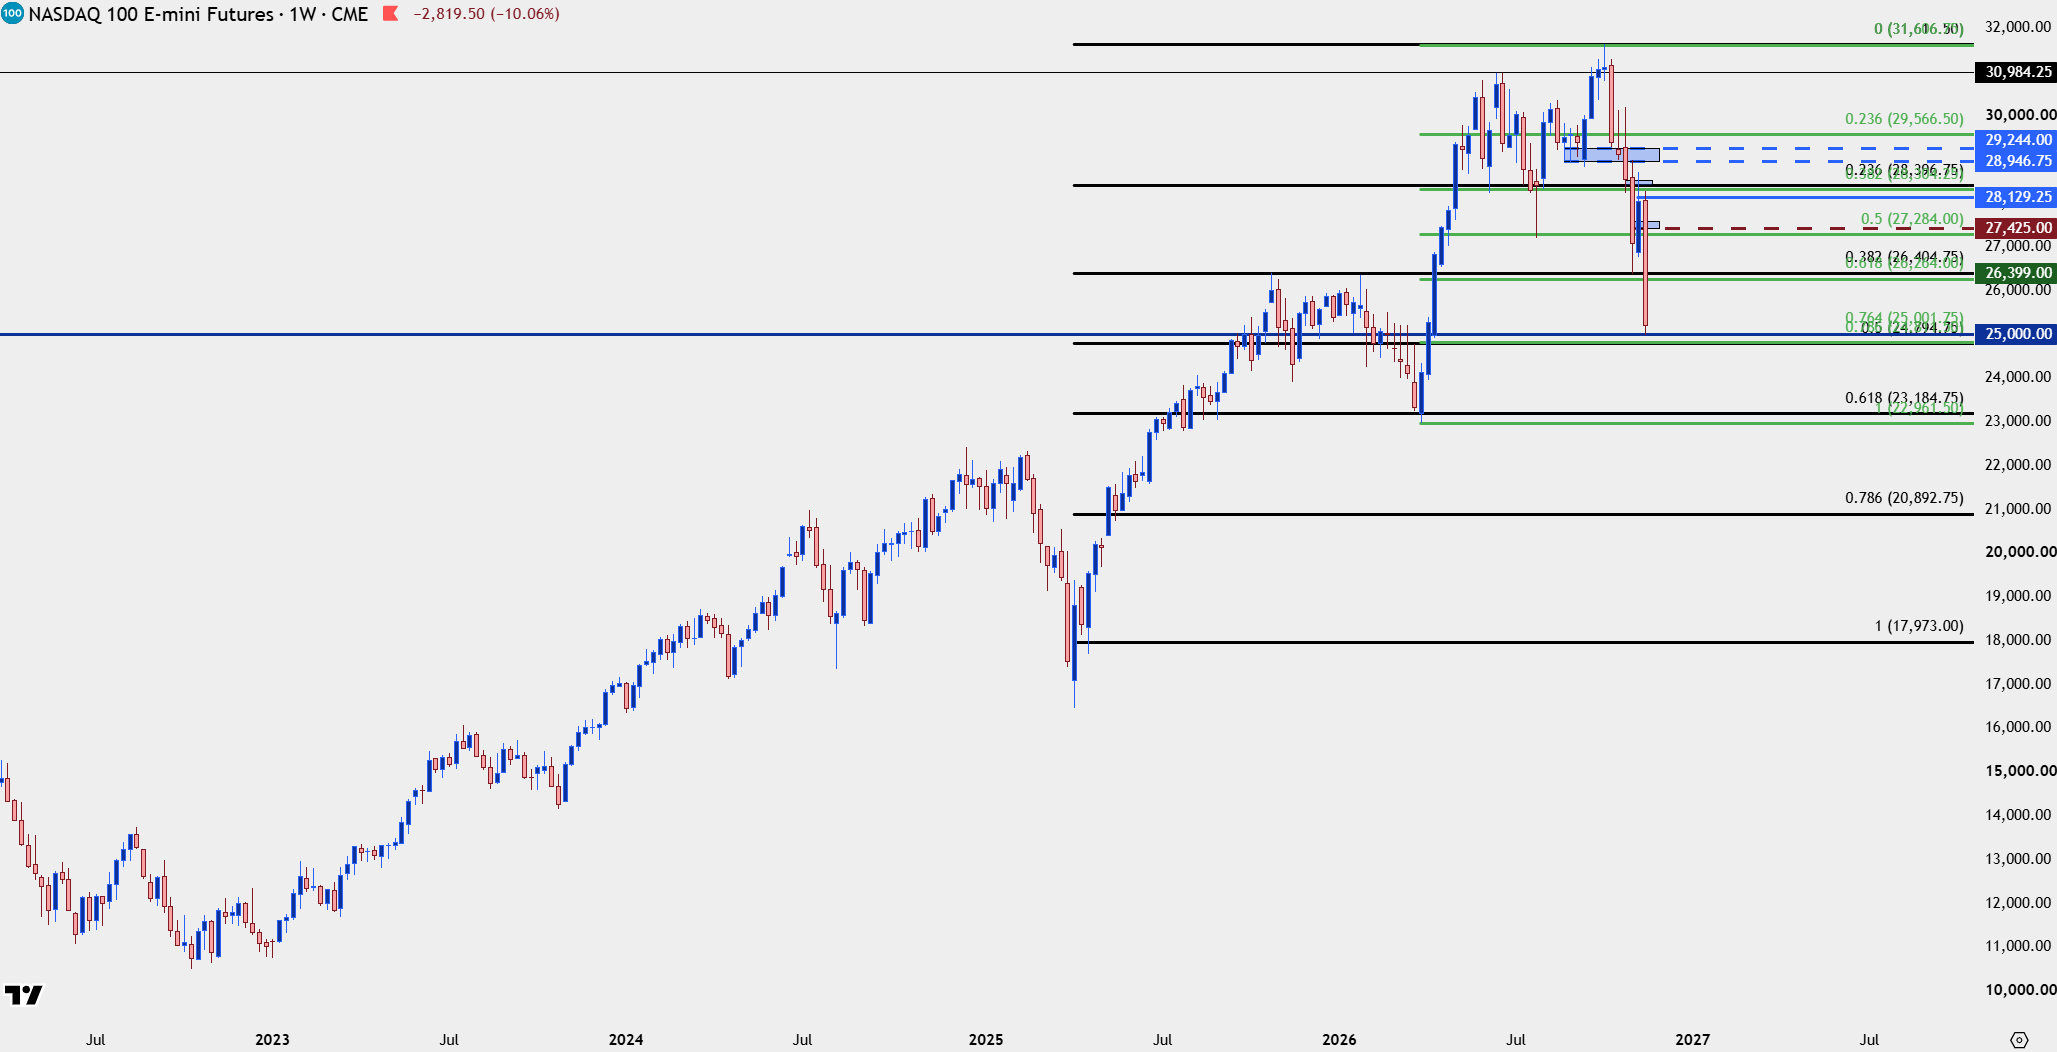
Chart prepared by James Stanley; data derived from Tradingview
--- written by James Stanley, Senior Market Analyst, Global Macro
Related tags:
Latest market news








Web Trader platform
Our sophisticated web-based platform is packed with features.
Open an account today
Experience award-winning platforms with fast and secure execution.
Economic calendar
Related articles

USD/JPY Weekly Outlook: AI earnings could overshadow the Fed and BoJ
AI sentiment has become a major driver of US Treasury yields and USD/JPY. With Microsoft, Alphabet and Amazon reporting this week, central bank decisions may have competition for traders' attention.


Gold and S&P 500 analysis: What now after Warsh’s hawkish speech?
The dollar surged across the board after the Fed Chair Kevin Warsh surprised with a hawkish-leaning speech at the Jackson Hole summit. All the bearish dollar bets that had been accumulated since last Friday on the back of data weakness and bond market troubles had to be squared and that triggered a short squeeze rally for the dollar. Gold and silver dropped, as a result, as too did bitcoin, while US indices were giving back earlier gains.


Nasdaq 100 Forecast: NDX slips ahead of Fed Chair Warsh’s speech
U.S. stocks are edging lower on Friday, giving back some of yesterday's gains after Nvidia's strong outlook revived the tech trade. The focus has now shifted firmly to Fed Chair Kevin Warsh's Jackson Hole speech, with investors looking for more clarity on the outlook for interest rates.
