
Silver's bullish breakout case builds as bond yields retreat
The Democratic blue wave has sent crude and Treasury yields sharply lower, improving the outlook for precious metals. With gold already breaking higher, could silver be next?
Written by
David Scutt
Market Analyst
Is gold showing the way for silver when it comes to a potential bullish breakout?
The Democratic blue wave in the US midterm elections has dramatically altered market expectations for the outlook for the Iran war, with US Vice President JD Vance's acknowledgement that the conflict contributed to the heavy Republican defeat helping spark a huge decline in crude prices on Wednesday, with appetite for an extension of the conflict clearly waning.
If we were to see an extension of Wednesday's moves, pointing to further downside risk for Treasury yields and, with it, the US dollar, it could provide a strengthening tailwind for precious metals.
We've already seen gold break the downtrend that's been in place since early September, while silver is banging on the door of its own equivalent bearish trend. And given silver's tendency to amplify daily moves in gold, the question is whether XAG/USD could be next to stage a dramatic break higher.
Gold showing the way for silver?
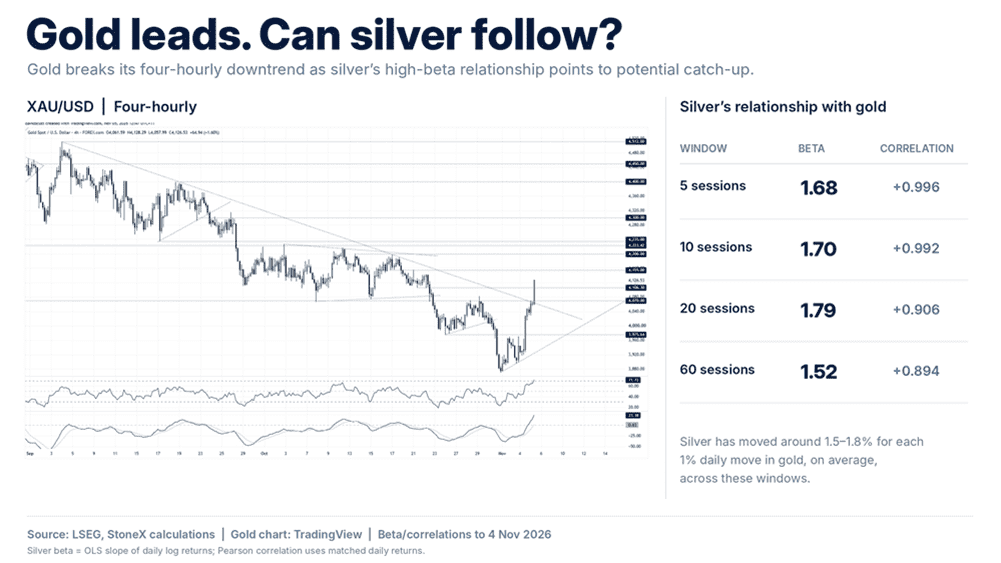
Putting increased emphasis on that last point, the graphic below shows not only gold's bullish breakout from its bearish trend, but also just how strong the relationship has been between the two metals, along with how much larger silver's daily percentage moves have tended to be, on average.
Source: LSEG, TradingView
Using daily returns calculated from LSEG data, silver's correlation with gold stands at +0.99 over the past ten sessions, easing only slightly to +0.91 over 20 sessions and +0.89 over 60. Essentially, the two metals have been moving almost in lockstep on a day-to-day basis recently. But it's not just the direction of the moves that matters. It's also their magnitude.
Over those same periods, silver's beta to gold has been 1.70, 1.79 and 1.52, respectively. In simple terms, a 1% daily move in gold has typically been associated with a move of around 1.5% to 1.8% in silver, on average.
With gold having already broken out, the combination of sustained strong positive correlations and silver's higher beta puts XAG/USD firmly on the radar for a potentially larger move should it stage its own bullish breakout.
Silver caught between two worlds
As flagged in our analysis earlier this week, the historic inverse relationships between precious metals, Treasury yields and the US dollar were showing signs of reasserting themselves, potentially providing a bullish catalyst for gold and silver. Complicating that argument, however, was the unusually strong positive correlation both metals had developed with technology stocks, raising the risk that further weakness in the AI trade could overwhelm the benefits of falling yields and a softer dollar.
Events over the past 24 hours may have significantly altered that equation. The sharp decline in crude prices, accompanied by falling Treasury yields and a weaker US dollar, has strengthened the macro argument for precious metals. With the prospect of a prolonged Iran conflict fading, an improvement in broader risk appetite could provide another tailwind, particularly for silver given its industrial uses.
Source: LSEG
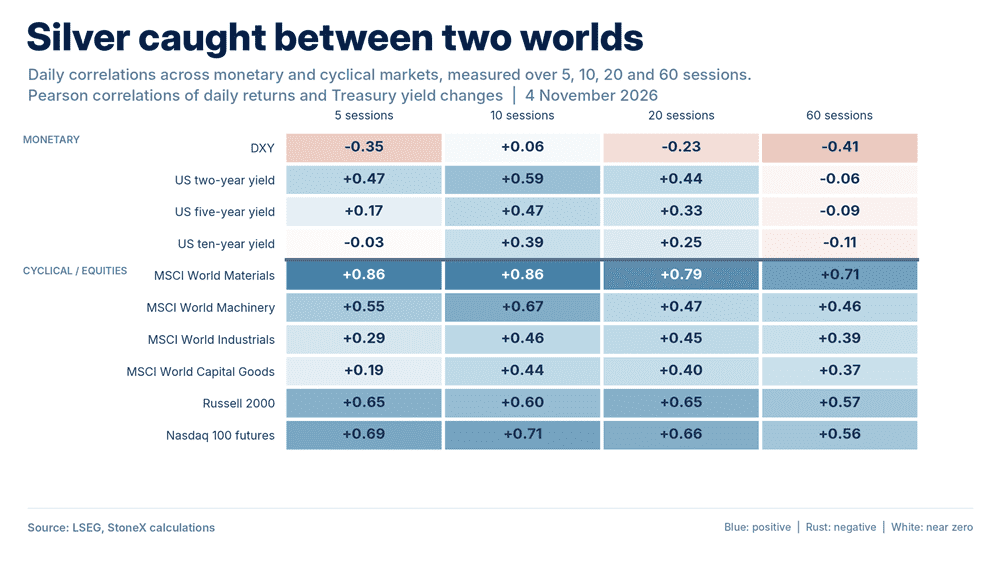
The heat map above shows silver has maintained strong positive correlations with global materials stocks and Nasdaq 100 futures, reaching +0.86 and +0.71 respectively over the past ten sessions. Its relationships with broader industrials and machinery have been less consistent, suggesting recent price action may have been more influenced by the commodity sector and equity market sentiment than perceptions towards industrial activity more generally.
However, given the abrupt shift in the macro environment overnight, it's far too early to rule out an improvement in the broader economic outlook becoming another bullish catalyst for silver should sentiment towards growth strengthen.
Silver's bullish breakout test
Source: TradingView
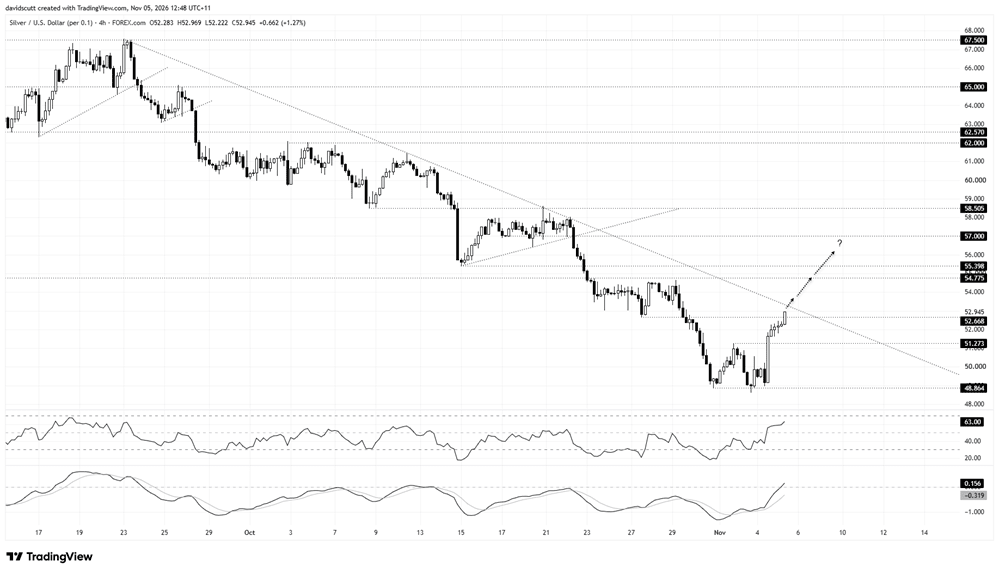
Looking at silver on the four-hourly chart, the price has staged a significant bounce after again failing to break beneath support at $48.86 over the past week. The recovery has seen the price reclaim two minor technical levels at $51.27 and $52.67, putting it within touching distance of downtrend resistance running from the highs set in late September.
That downtrend is now the key level to watch overhead. A bullish breakout that sticks, especially if followed by a backtest and bounce, could provide an appealing entry level for longs, allowing for a tight stop to be placed beneath the former downtrend for protection, targeting $54.78, $55.40 and $57, or even $58.50.
If silver fails to stage a bullish breakout similar to the one already seen in gold, $52.67 and $51.27 are the two immediate downside levels to watch.
The message from the oscillators on the four-hourly is one of building upside momentum. RSI (14) is setting fresh highs and is not yet overbought, while MACD has moved further above its signal line following a bullish crossover and has recently flipped into positive territory.
Latest market news








Web Trader platform
Our sophisticated web-based platform is packed with features.
Open an account today
Experience award-winning platforms with fast and secure execution.
Economic calendar
Related articles

USD/JPY Weekly Outlook: AI earnings could overshadow the Fed and BoJ
AI sentiment has become a major driver of US Treasury yields and USD/JPY. With Microsoft, Alphabet and Amazon reporting this week, central bank decisions may have competition for traders' attention.

Gold and S&P 500 analysis: What now after Warsh’s hawkish speech?
The dollar surged across the board after the Fed Chair Kevin Warsh surprised with a hawkish-leaning speech at the Jackson Hole summit. All the bearish dollar bets that had been accumulated since last Friday on the back of data weakness and bond market troubles had to be squared and that triggered a short squeeze rally for the dollar. Gold and silver dropped, as a result, as too did bitcoin, while US indices were giving back earlier gains.


Nasdaq 100 Forecast: NDX slips ahead of Fed Chair Warsh’s speech
U.S. stocks are edging lower on Friday, giving back some of yesterday's gains after Nvidia's strong outlook revived the tech trade. The focus has now shifted firmly to Fed Chair Kevin Warsh's Jackson Hole speech, with investors looking for more clarity on the outlook for interest rates.
