


Gold Hammered After CPI, Tests Below $4100
Gold prices came into the day with a bullish backdrop but that has dimmed after the CPI release earlier on the day.
Written by
James Stanley
Sr. Strategist
Gold Talking Points:
- Gold hasn’t yet taken out last week’s low but price is close to a re-test.
- Bigger picture, it’s still the $4k level that looms large after the ardent defense from June and July.
Gold bulls had an open door to force a push as we came into today, but their prospects aren’t looking as good after this morning’s CPI print.
Gold had built into an inverse head and shoulders pattern, with a neckline at the familiar zone of 4200-4235. The round number held the high on Monday night and, initially, it was a clean pullback that had stalled at support. But after this morning’s strong CPI report, bulls evacuated quickly, and prices dipped back-below the 4100 level that had helped to produce a pivot a week ago.
At this point, the formation isn’t completely nullified until price trades through the head, or the low from last week at 4066. But it’s difficult to argue this as a bullish case given the open door that buyers had over the past three weeks where they were seemingly disinterested from forcing a rally.
Gold Four-Hour Price Chart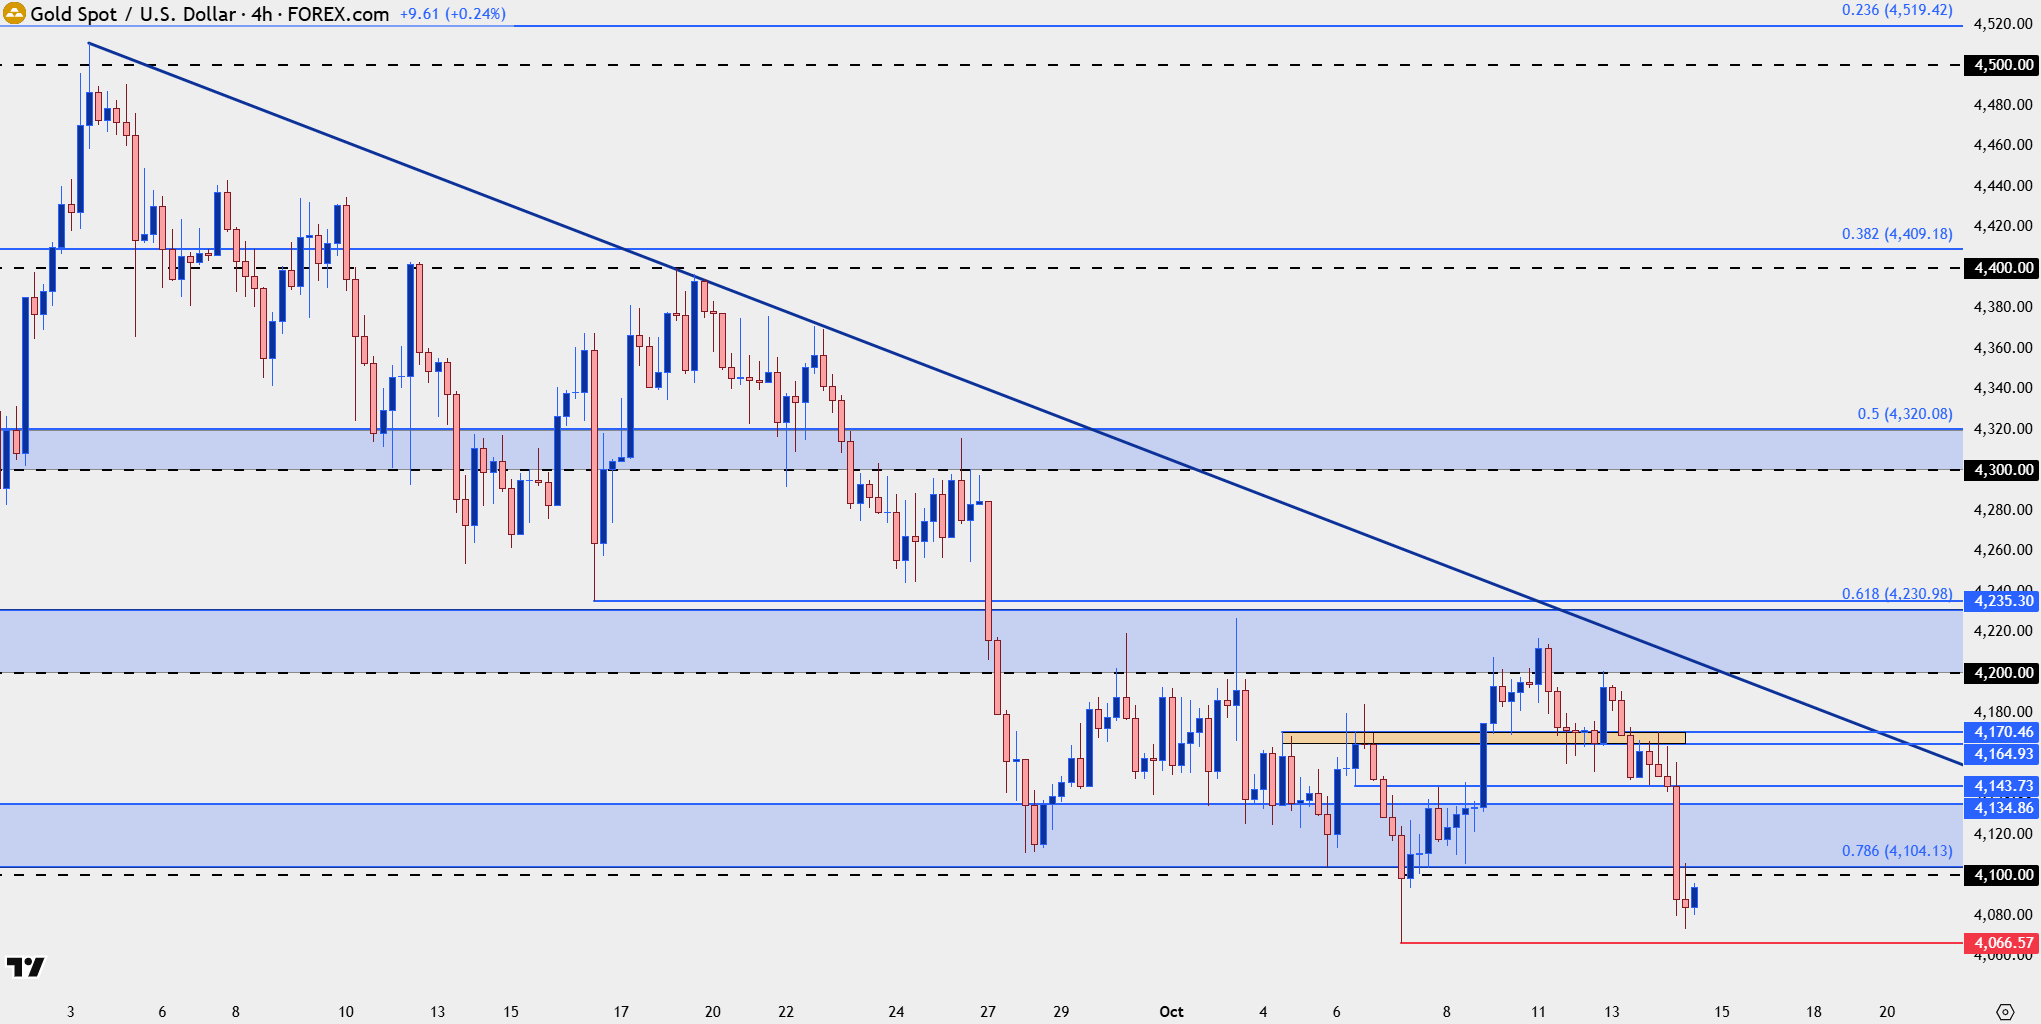
Chart prepared by James Stanley; data derived from Tradingview
Gold Big Picture
At this point it’s all about the $4k level. Like we saw earlier in the year, there was a degree of bullish anticipation as buyers initially wouldn’t allow for a test of the big figure. This is why we had a strong bounce up to $4400 in June; but it was after the FOMC meeting that month, when Warsh took many by surprise in just how hawkish he sounded, that sellers were finally able to push for a test.
But this is where defense came in, and widespread accusations of central bank buying to support the metal in a grinding backdrop that took a little more than a month before bulls were finally able to force a break after the July FOMC meeting.
Gold Daily Chart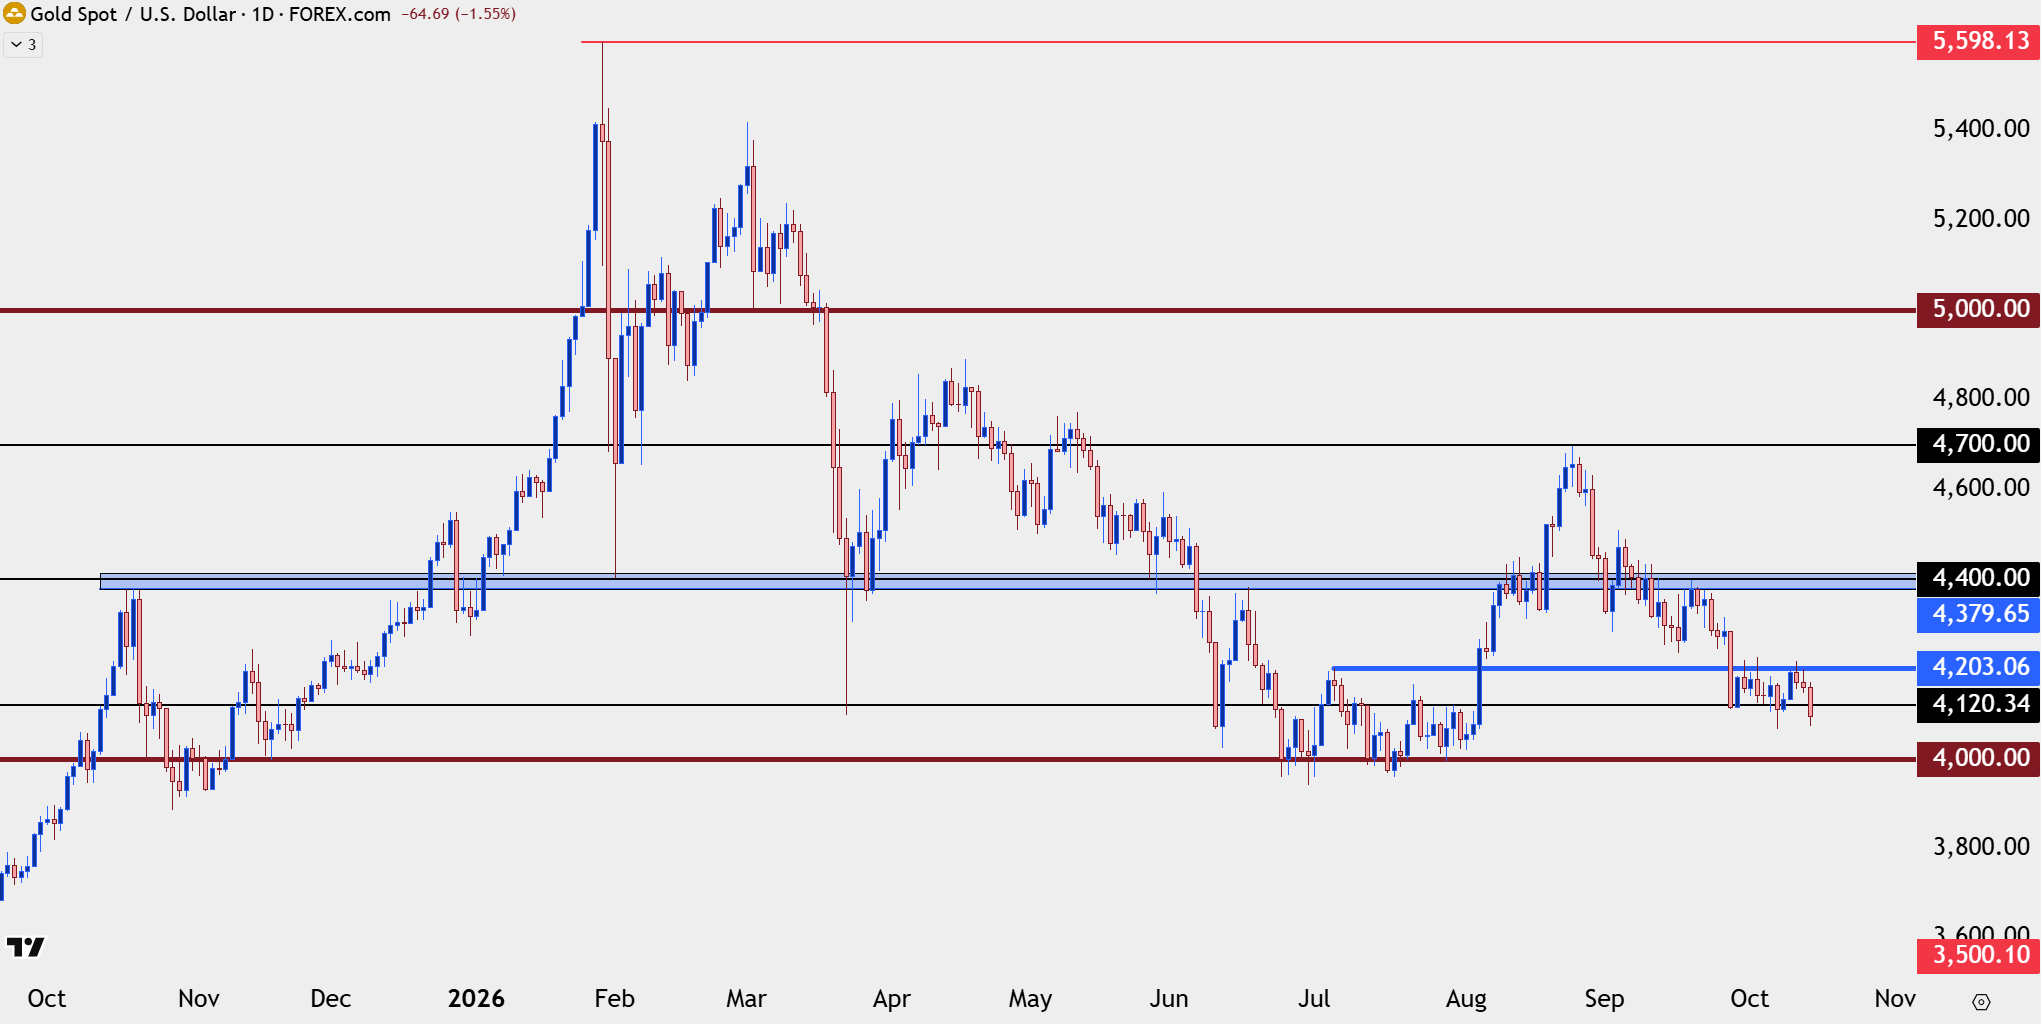
Chart prepared by James Stanley; data derived from Tradingview
Gold Shorter-Term Strategy
The challenge at this point is that price has stalled so near the lows, but for those that do want to press the short side of the matter, there’s now a few levels of note overhead that can be looked to for resistance potential. Price is already near the $4100 level and 4104 sits just above that, but perhaps more compelling is the 4135 level which was a swing high from back in July that helped to demarcate resistance before the prior breakout. Above that, it’s the 4164-4170 zone and if that gets traded through by the end of the week, we’re dealing with another situation entirely as a wide underside wick would illustrate failure from sellers to push. But, as such, that can be considered as a ‘r3’ element of resistance, at this point.
Gold Four-Hour Chart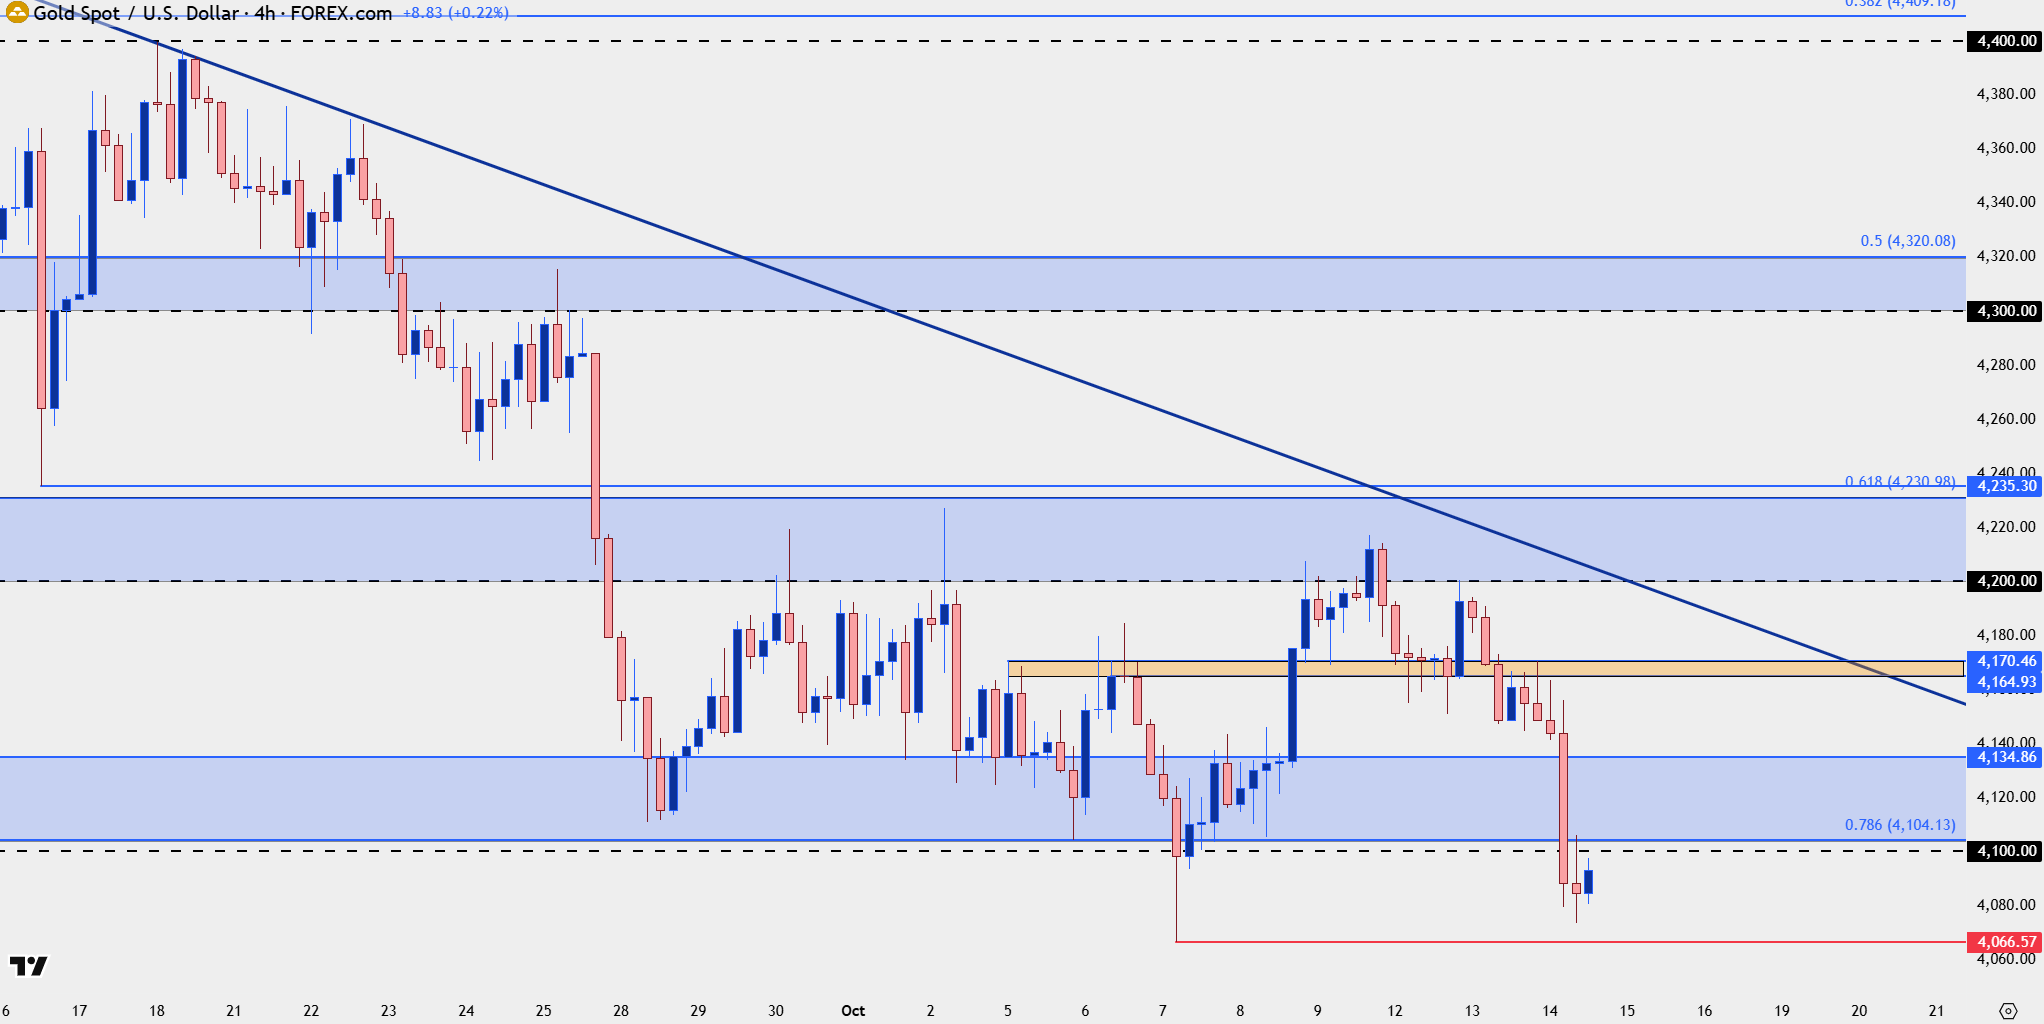
Chart prepared by James Stanley; data derived from Tradingview
--- written by James Stanley, Senior Market Analyst, Global Macro
Related tags:
Latest market news









Web Trader platform
Our sophisticated web-based platform is packed with features.
Open an account today
Experience award-winning platforms with fast and secure execution.
Economic calendar
Related articles

Gold and S&P 500 analysis: What now after Warsh’s hawkish speech?
The dollar surged across the board after the Fed Chair Kevin Warsh surprised with a hawkish-leaning speech at the Jackson Hole summit. All the bearish dollar bets that had been accumulated since last Friday on the back of data weakness and bond market troubles had to be squared and that triggered a short squeeze rally for the dollar. Gold and silver dropped, as a result, as too did bitcoin, while US indices were giving back earlier gains.


Gold Falters at Resistance, Grappling With PCE, Month-End Flows and Jackson Hole
Gold has pulled back from resistance after sticky PCE data, with month-end flows and Jackson Hole now shaping the near-term outlook.


Gold forecast: XAU/USD retreats along with dollar debasement trade
Gold was down nearly 1.5% on the session, with US indices and Bitcoin also struggling. Is this a mere pause before more gains are seen, or have we already seen the end of the recent bullish advance?